

Weather data looks simple until a customer, board member, or analyst asks where the number came from. The global weather information technologies market reached $9.2 billion in 2025, according to Grand View Research, and 75% of surveyed executives said weather had a moderate or high impact on their business, according to The Weather Company and Magid (2024). Yet most teams building weather-sensitive products discover the hard way that current observations, historical records, and climate normals come from entirely different systems with different access methods and reliability profiles.
A weather API is not automatically the right answer to a climate-normal problem. A government archive can be authoritative while still being slow and hard to query for a 30-person engineering team. The source that works for a quick daily history check is often the wrong call for backtesting or for a customer-facing dashboard where data provenance will end up in a due-diligence questionnaire.
This guide cuts through that confusion. It compares 12 weather data sources across access type, data depth, and practical fit, so you can match the source to the actual decision your team is making.
What's inside
This guide compares 12 weather data sources covering current observations, historical records, climate normals, marine data, satellite layers, and map-based access. Sources were selected from official government agencies, research institutions, NWS climate interfaces, and established consumer history tools.
Selection criteria:
- Data type: Current observations, historical, forecast, marine, satellite, climate normals
- Access method: Web tables, maps, CSV downloads, weather APIs, station pages
- Trust level: Official government, institutional, consumer network, state climatology
- Fit for SaaS use: Product feature, operational dashboard, backtesting, planning
TL;DR
- Best official all-around source: NOAA for broad U.S. weather and climate data with strong provenance
- Best for operational forecasts and warnings: NWS for public alerts and location-specific climate pages
- Best for historical climate archives: NOAA NCEI for multi-decade records and downloadable datasets
- Best for quick daily history: Weather Underground for readable daily summaries without building a pipeline
- Best for marine and buoy observations: NDBC for offshore and coastal station-level meteorological data
- Best for Great Lakes conditions: Great Lakes Environmental Research Laboratory for regional high-frequency data
- Best for climate risk and long-range outlooks: Climate Prediction Center for ENSO monitoring and drought signals
What is weather data?
Weather data is structured information about atmospheric conditions, collected from stations, satellites, radar, buoys, models, and observation networks.
The term covers several distinct data types that behave very differently in product and analytical workflows:
- Current observations: Real-time or near-real-time station readings (temperature, wind, pressure, humidity, dew point)
- Historical observations: Past readings from a specific station or location, often archived by hour or day
- Forecast data: Model-generated predictions for future conditions, updated on rolling cycles
- Climate data: Statistical summaries of atmospheric patterns across long time periods
- Climate normals: Multi-decade reference averages, typically 30-year periods, used as baseline expectations
- Station metadata: Station ID, location, elevation, instrument type, observation interval, and time zone
- Marine and coastal data: Buoy, offshore platform, and coastal station readings for wind, wave height, pressure, and sea surface temperature
- Satellite or map layers: Remotely sensed data for sea surface temperature, ocean color, precipitation, and imagery
Key features to look for
When evaluating a weather data source, check for the following:
- Data provenance: Is the source a station, buoy, radar, model, satellite, or personal weather station network?
- Update frequency: Two-minute intervals, hourly, daily, or monthly
- Geographic coverage: Local, regional, national, or global
- Variables covered: Temperature, precipitation, wind, pressure, humidity, snowfall, degree days
- Historical depth: Recent weeks only, or multi-decade records going back to the 1940s
- Access method: Web tables, CSV or netCDF downloads, weather APIs, map viewers, or plot tools
- Metadata quality: Station ID, coordinates, elevation, instrument context, quality-control flags
- Licensing and reuse: Whether commercial use, redistribution, or attribution requirements apply
The right source depends on the question. Use current observations for operational dashboards, historical data for backtesting and analysis, climate normals for benchmarks, forecasts for forward planning, and station metadata when every number needs to be traceable to an instrument.
When to use weather data
Build location-aware product features
Logistics ETAs, energy optimization, field-service routing, and insurance workflows all require weather inputs that update reliably. For product features that will appear in a customer-facing interface, use an official or institutionally maintained source. Consumer-grade sources may be readable, but they carry more risk when a customer or auditor asks where the number originated.
Validate operational decisions retrospectively
When a VP asks whether weather affected churn, delivery rates, or usage spikes last quarter, historical weather data becomes the analysis layer. Daily observation tables from NOAA NCEI, NOWData, or Weather Underground let your data team run that retrospective without building a custom pipeline from scratch.
Model climate and long-term risk
Market expansion decisions, facility planning, and supply chain risk assessments move from weather data to climate data. Climate normals, long-term precipitation records, and drought outlook products give the baseline context that a standard 10-day forecast cannot. This is where NOAA NCEI and the Climate Prediction Center matter more than a consumer weather app.
Weather data source comparison
The table below maps 12 weather data sources to their primary use case, key differentiator, pricing, and G2 rating. All 12 are public agencies, government research programs, or established data interfaces rather than commercial SaaS products, so G2 ratings are not applicable. Pricing was verified against each source's official site in 2026.
| # | Product | Best for | Key differentiator | Pricing | G2 rating |
|---|---|---|---|---|---|
| 1 | NOAA | Official U.S. weather and climate data | Broad public datasets: Observations, forecasts, climate | Free (most datasets) | N/A |
| 2 | NWS | Operational forecasts and warnings | National forecast authority with public alerts | Free | N/A |
| 3 | NOAA NCEI | Historical climate archives | Long-term climate records and environmental data | Free (digital); fees for some certified services | N/A |
| 4 | Weather Underground | Quick daily weather history | Consumer-friendly daily tables and station network | Free (ad-supported); Ad-Free at $9.99/year | N/A |
| 5 | NOWData | Local climate summaries | Station-based daily, monthly, and annual climate tables | Free | N/A |
| 6 | Climate Prediction Center | Long-range outlooks and climate signals | Drought, ENSO, and seasonal forecast products | Free | N/A |
| 7 | Great Lakes Environmental Research Laboratory | Great Lakes meteorological data | High-frequency observations and lake-focused context | Free | N/A |
| 8 | NDBC | Marine and buoy observations | Buoy and coastal station data for marine conditions | Free | N/A |
| 9 | CoastWatch | Satellite and coastal data | Satellite-derived ocean and coastal environmental data | Free | N/A |
| 10 | NowCOAST | Map-based weather and ocean data | GIS-style map layers for observations and forecasts | Free | N/A |
| 11 | Wisconsin State Climatology Office | Wisconsin climate records | State-level climate data and local normals | Free | N/A |
| 12 | Weather Almanac | Daily climate reference | Almanac-style daily records and normal comparisons | Free (web access) | N/A |
Best 12 weather data sources for 2026
1. NOAA
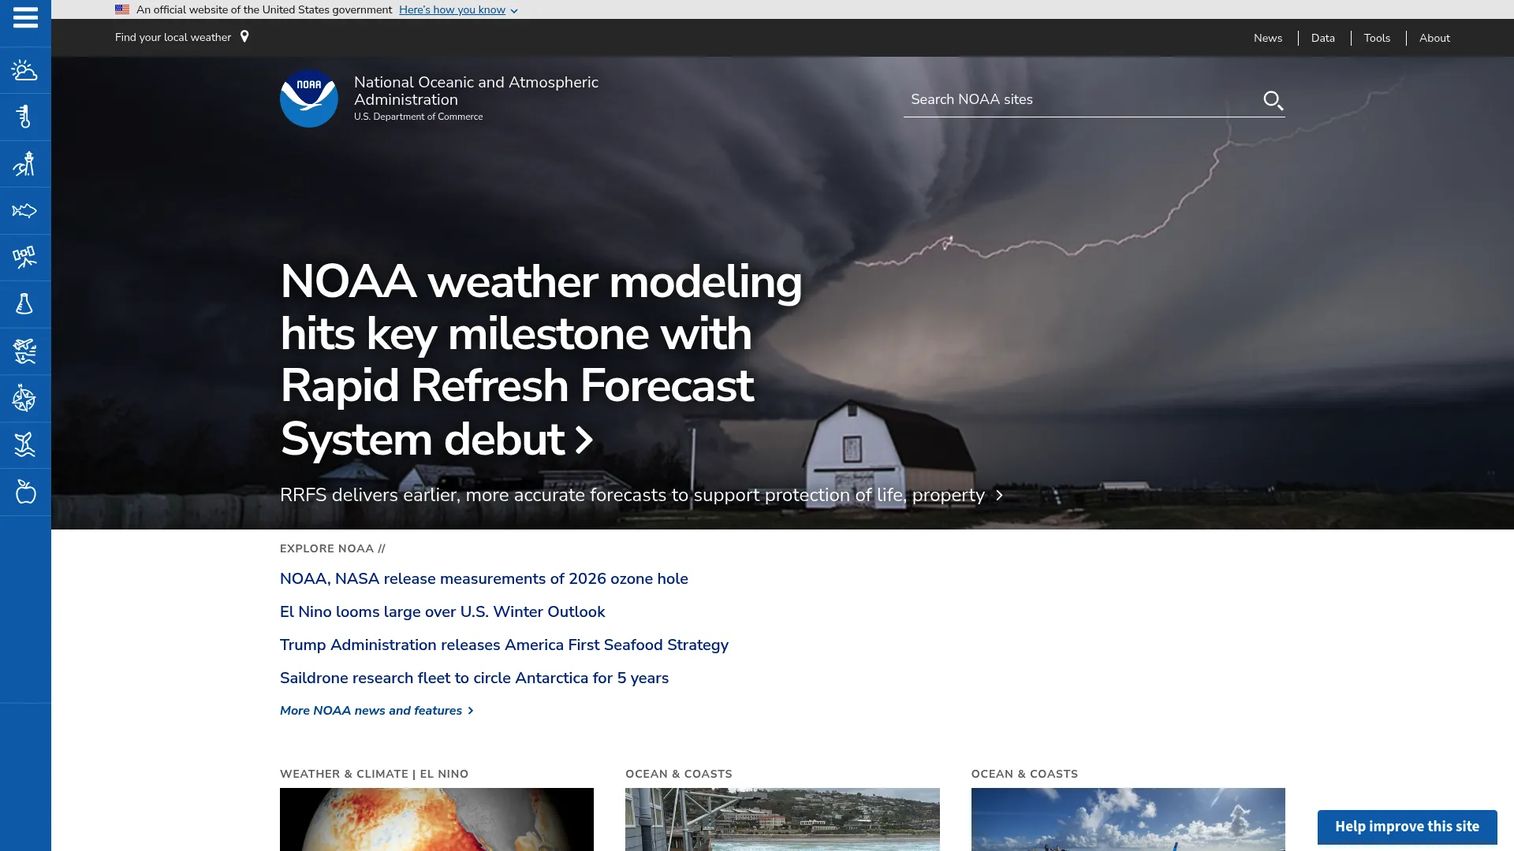
NOAA is the National Oceanic and Atmospheric Administration, the U.S. federal agency responsible for environmental science, weather, climate, ocean data, navigation information, and ecosystem services. It is the upstream source behind most U.S. weather products, meaning the data your team finds in downstream APIs and commercial platforms often originates here. For teams that need defensible provenance on a number that will appear in a board deck or customer dashboard, NOAA is the place to start.
Best for: Founders and data teams needing official U.S. weather and climate datasets with traceable provenance.
Key features
- Official U.S. weather and climate datasets covering observations, forecasts, and archives
- Earth observation and environmental data access across ocean, atmosphere, and coastal systems
- Nautical charts and navigation information for marine operations
- Big Data Program providing free cloud access to NOAA Open Data Dissemination datasets
- Station and metadata context for quality-controlled surface observations
Why choose NOAA: Use NOAA when traceability matters more than UI polish. If a regulator, enterprise customer, or investor will ask where your weather number came from, pointing to an official government source is a stronger answer than a third-party app.
NOAA pricing: Most NOAA datasets are free to access through the NOAA Open Data Dissemination program and public data portals. Customized requests, certified copies, physical media, and certain specialized products may carry fees. Verify any non-standard data order against the specific product page before building it into a commercial workflow.
2. NWS
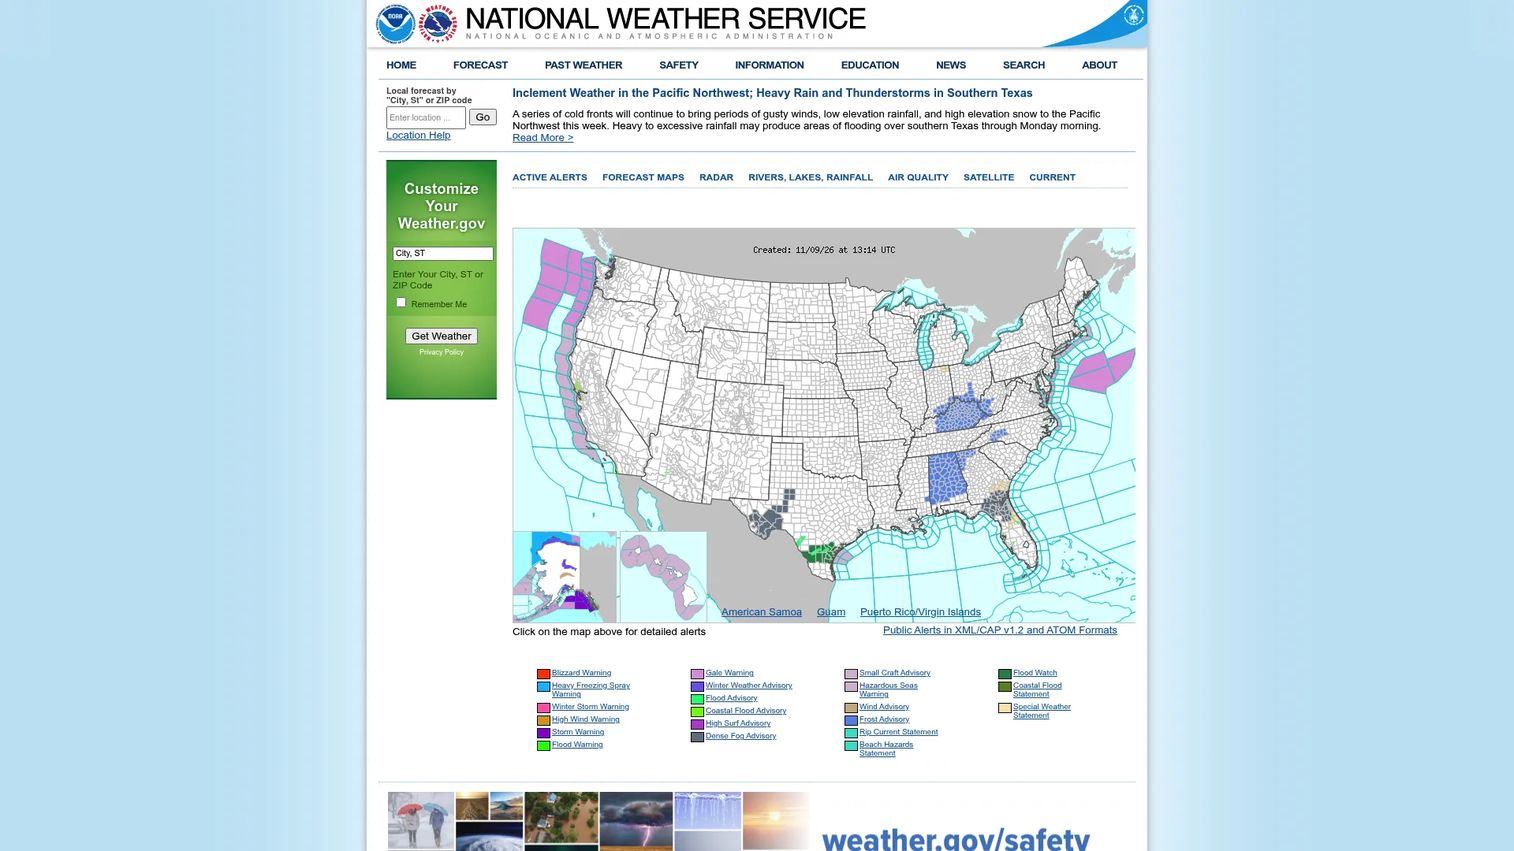
NWS, the National Weather Service, is the operational weather arm of the U.S. government. It publishes public forecasts, weather watches, warnings, and advisories, as well as local climate pages, recent observation summaries, and station-linked data. NWS is built for operational weather, not deep historical archiving. Its value is in current conditions, official alerts, and reliable location-specific forecast products that your team can cite with confidence.
Best for: Teams that need authoritative operational weather forecasts, public warnings, and location-specific climate pages.
Key features
- Local and graphical weather forecasts updated on standard NWS cycles
- Weather watches, warnings, and advisories covering the full U.S.
- Radar, satellite, and air-quality information layers
- Local climate pages linked to airport and reporting stations
- Text bulletins and summaries for structured data consumption
Why choose NWS: Pick NWS when you need a trusted operational forecast or official warning feed. It is not a polished API product, but it is the authoritative source that commercial weather providers rely on. For teams building alert workflows or operational dashboards, that chain of custody matters.
NWS pricing: All NWS public forecasts, warnings, data, and products are free. NWS is a government service, so there are no subscription tiers or commercial access fees for standard public products.
3. NOAA NCEI
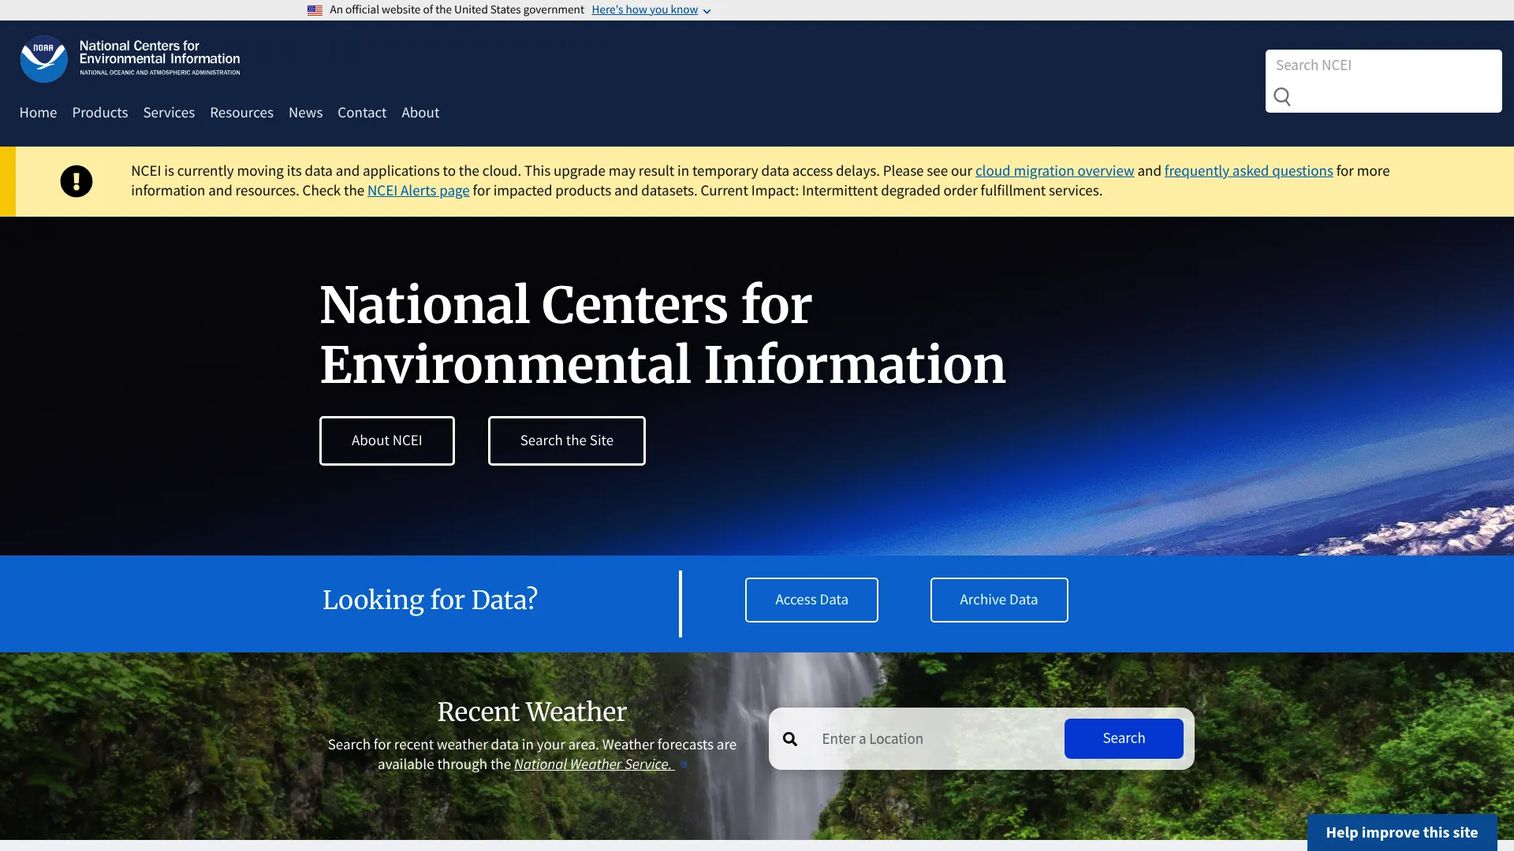
NOAA NCEI, the National Centers for Environmental Information, is the world's largest archive for atmospheric, coastal, geophysical, and oceanic environmental data. Historical depth is its core strength. NCEI holds multi-decade climate records, climate normals, archived radar data, and downloadable station-based datasets that support research-grade analysis. If your team is building a backtesting model, running climate risk analysis, or needs defensible long-term temperature and precipitation records, NCEI is the right source.
Best for: Analysts and founders who need historical weather data for research, risk modeling, or long-term climate analysis.
Key features
- Historical climate archives spanning decades across thousands of U.S. and global stations
- Climate normals data products including anomalies, ranks, degree days, and thresholds
- Archived and near-real-time weather radar access
- Weather and Climate Toolkit for data access, visualization, and CSV export
- Maps and geospatial products for spatial analysis
Why choose NOAA NCEI: Use NCEI when historical depth matters more than speed of access. The interface requires more navigation than a consumer tool, but the data provenance is stronger and the archive depth covers use cases that a 30-day weather history API cannot.
NOAA NCEI pricing: Digital data access is free. Paper copies and certain certified or specialized delivery services carry fees. Verify any specialized data order on the NCEI product page before committing to it in a production workflow.
4. Weather Underground
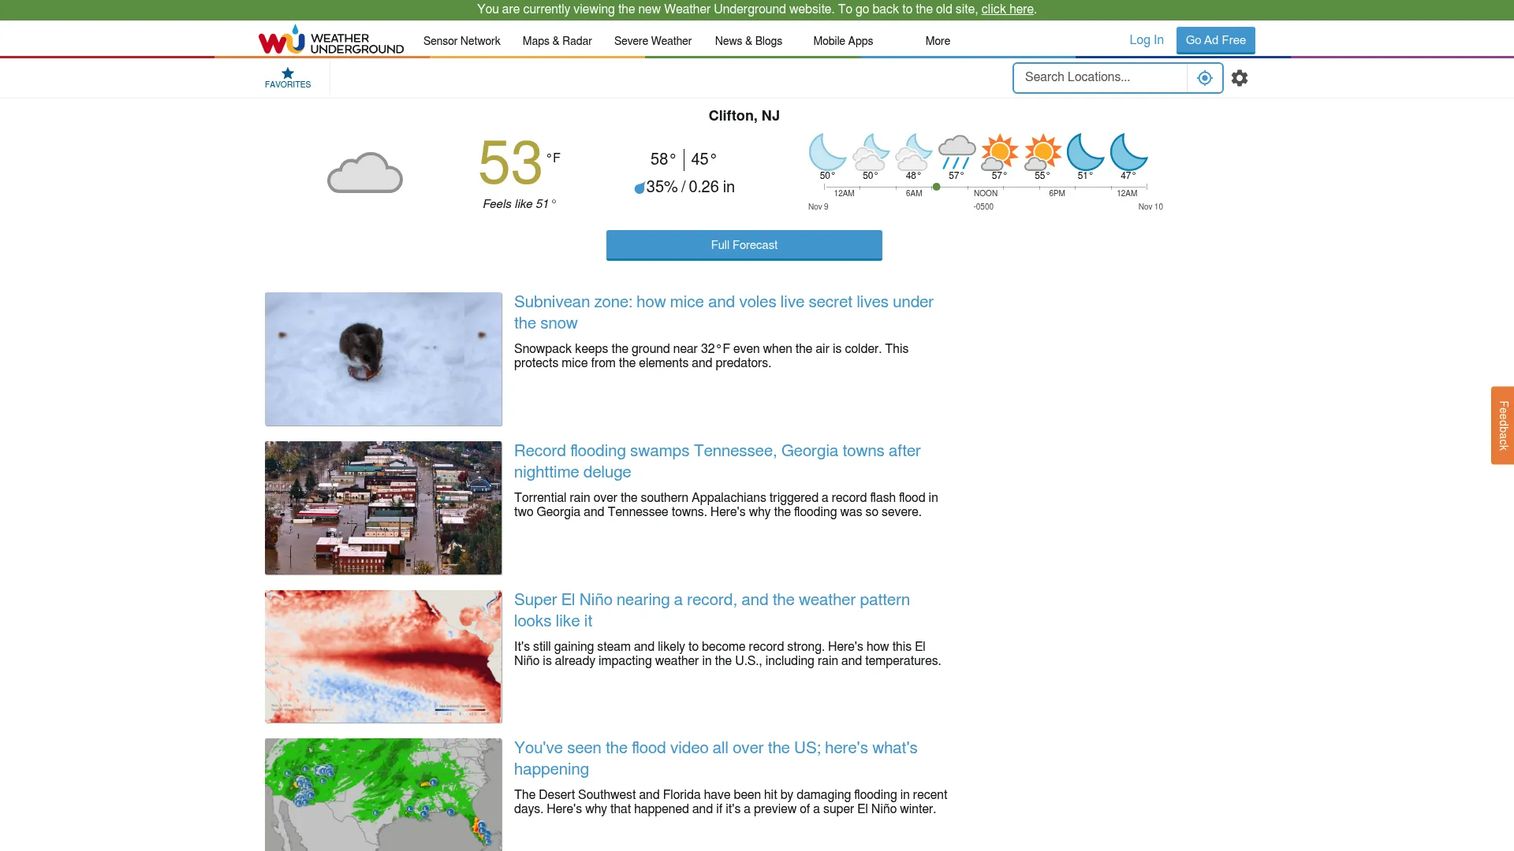
Weather Underground is a consumer-facing weather service with a large personal weather station network, hyper-local forecasts, interactive maps, and a daily weather history interface that most non-technical users can navigate without help. The history pages show daily temperature highs and lows, precipitation, dew point, wind speed, humidity, pressure, visibility, and astronomical data. For quick date-based lookups, it is one of the most readable options available.
Best for: Non-technical users who need quick daily weather history without building a data pipeline.
Key features
- Daily weather history tables with actual, average, and record comparisons
- Hyper-local forecasts powered by personal weather station data
- Interactive radar, satellite, and weather maps
- Severe weather alerts for specific locations
- Mobile apps for iPhone, iPad, and Android
Why choose Weather Underground: Choose it when speed and readability matter more than deep archive access. A VP of Product who needs to check what the weather was during last quarter's sales dip can pull that in a minute. For production analytics, commercial redistribution, or automated pipelines, verify API access terms and data licensing before you build.
Weather Underground pricing: Free ad-supported access covers core weather features and history. The Ad-Free subscription runs $9.99 per year. A monthly option is listed on the subscription page but no monthly price was visible at the time of verification.
5. NOWData
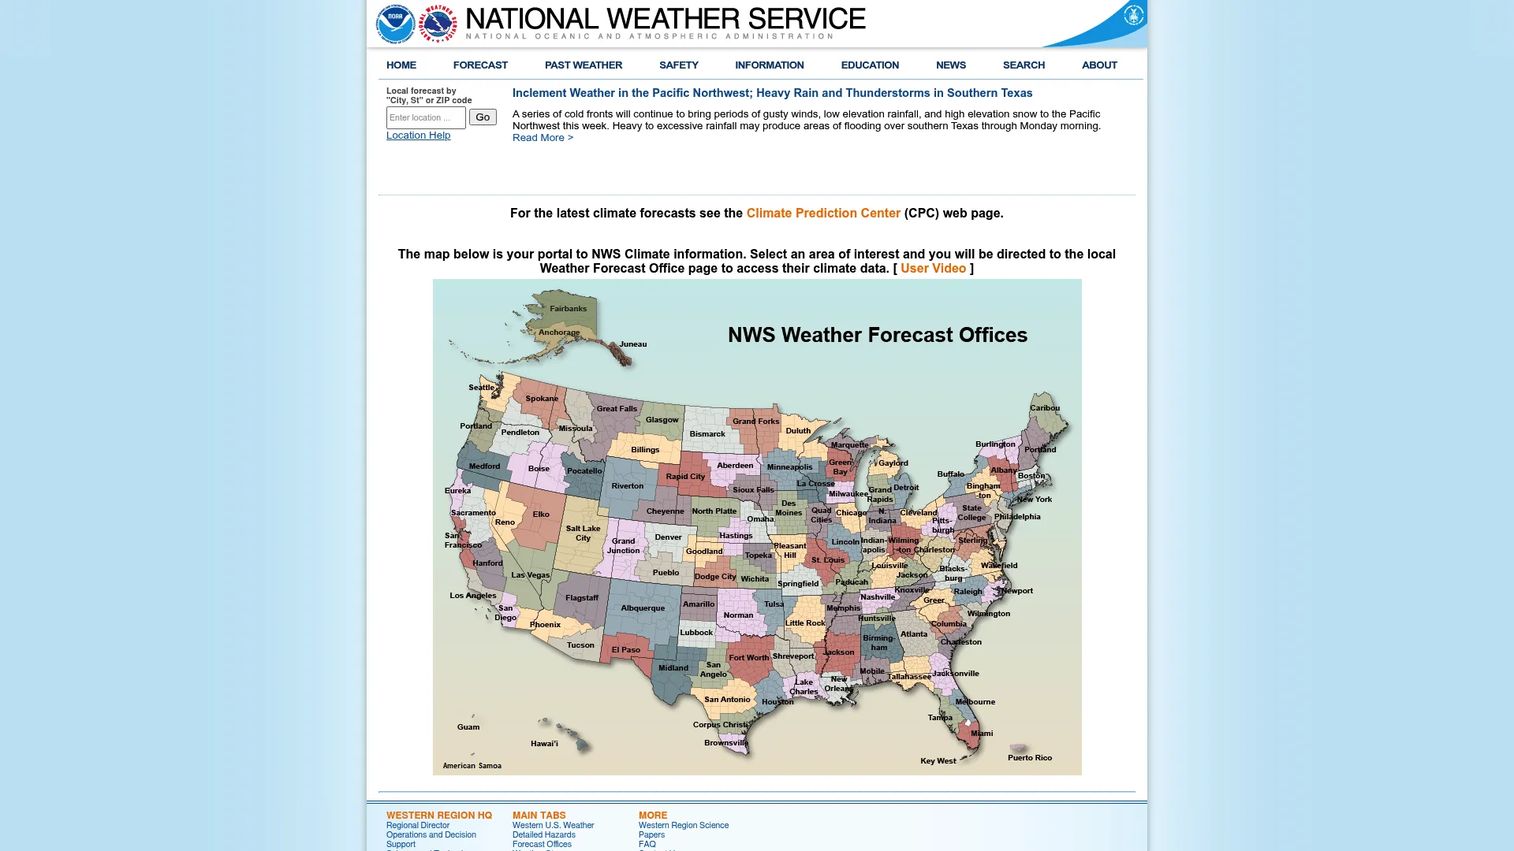
NOWData is a public data-query interface run by the National Weather Service for accessing preliminary climate statistics from U.S. weather observing stations. It provides daily, monthly, seasonal, quarterly, and annual summaries without requiring users to download raw archive files. For teams that need structured local climate tables fast, NOWData is a practical middle ground between a consumer weather app and a full NCEI archive query.
Best for: Teams that need station-based local climate summaries in table form for reporting and benchmarking.
Key features
- Daily climate reports for selected stations
- Preliminary monthly and annual climate data summaries
- Snowfall, snow depth, and degree-day statistics
- Record event reports covering temperature and precipitation extremes
- Station selector interface for locating the nearest reporting station
Why choose NOWData: Use NOWData when you need structured local climate values fast and a full archive download is more than the job requires. It works well for building climate benchmark tables or checking what the normal conditions are for a given location and season.
NOWData pricing: Free to access. NOWData is a public NWS service with no subscription or commercial tiers.
6. Climate Prediction Center
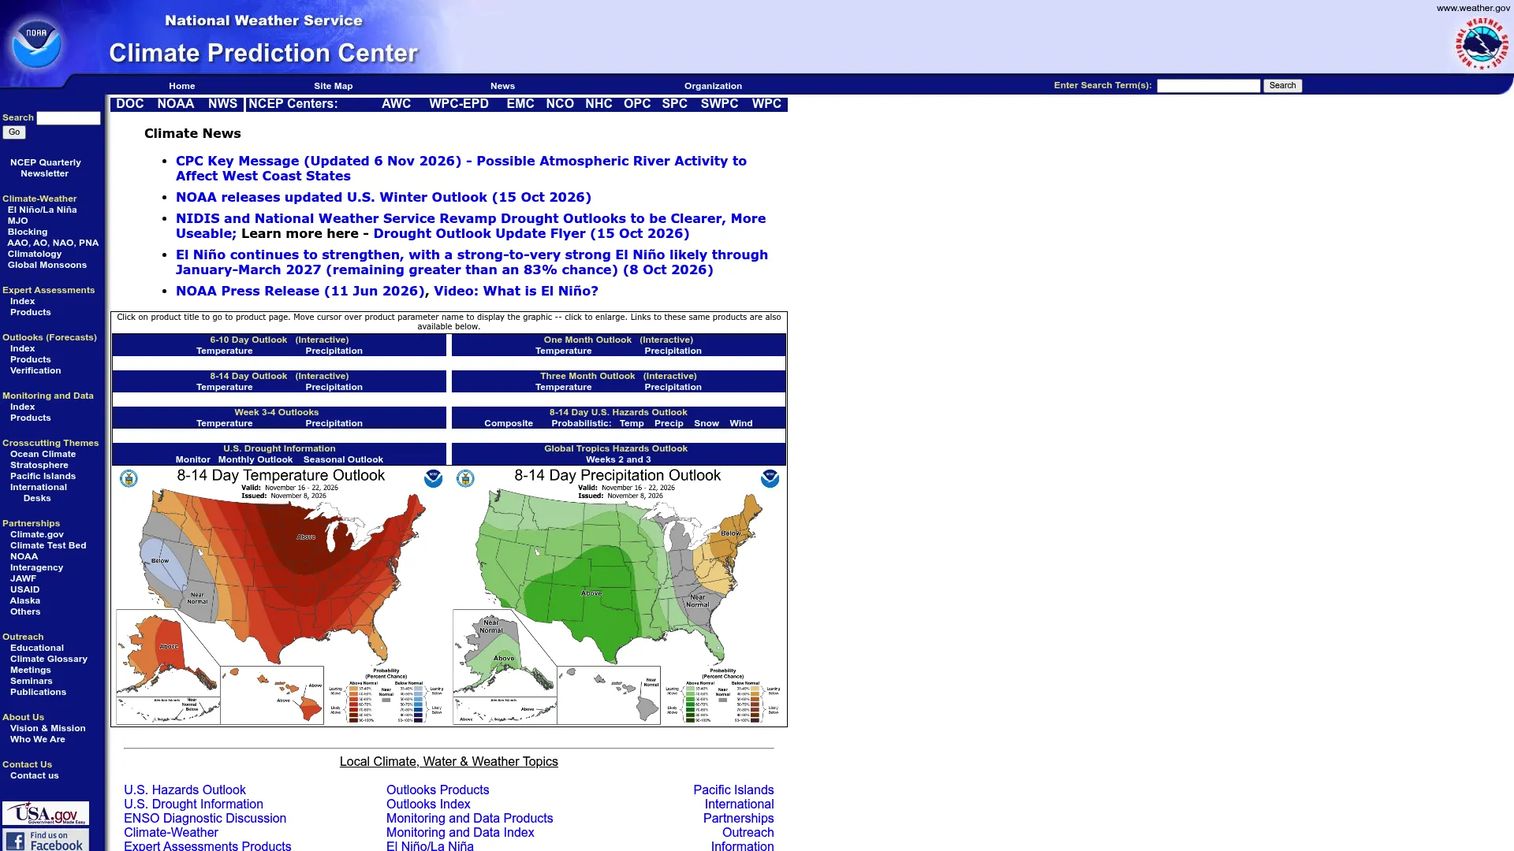
Climate Prediction Center (CPC) is a NOAA office that publishes operational climate forecasts, monitoring products, and long-range outlooks extending from two weeks to 13 months ahead. CPC is not a source for today's weather or historical station records. Its value is in forward-looking climate signals: Temperature and precipitation probability maps, ENSO monitoring, drought outlooks, and seasonal risk products. For founders building in agriculture, energy, insurance, or supply chain, CPC products give the planning context that a standard forecast cannot.
Best for: Teams modeling seasonal risk, drought exposure, or longer-range climate variability signals.
Key features
- Six-to-ten-day and eight-to-fourteen-day temperature and precipitation probability outlooks
- Monthly-to-seasonal outlooks covering up to 13 months ahead
- ENSO monitoring and El Nino/La Nina status products
- Drought and soil-moisture monitoring layers
- UV index and climate hazard products
Why choose Climate Prediction Center: Choose CPC when the question moves beyond the next 10 days. It is a planning input for strategic decisions, not a replacement for operational forecasts at the local level. Pair it with NWS for current conditions and NCEI for historical context.
Climate Prediction Center pricing: All CPC products are free to access as public NOAA climate services.
7. Great Lakes Environmental Research Laboratory
NOAA's Great Lakes Environmental Research Laboratory (GLERL) conducts research, observations, modeling, and forecasting for the Great Lakes and adjacent coastal ecosystems. For teams with operations, logistics, environmental monitoring, or analytics products tied to Great Lakes conditions, GLERL provides meteorological station data, buoy observations, wind plots, and high-frequency downloads that land-based national networks do not cover at the same resolution.
Best for: Teams that need Great Lakes station data, wind observations, and lake-focused meteorological context for regional analysis.
Key features
- Great Lakes environmental observations from buoys, vessels, and remote-sensing platforms
- High-frequency data downloads for wind speed, wind direction, and air temperature
- Three-hour and five-day meteorological plots for situational awareness
- Wind rose plots for directional frequency analysis
- Integrated physical and ecological modeling covering water levels and circulation
Why choose Great Lakes Environmental Research Laboratory: Pick GLERL when Great Lakes conditions are operationally significant to your product or analysis. It is not a general-purpose global weather platform. Its precision is regional, and that regional depth is exactly what general sources miss.
Great Lakes Environmental Research Laboratory pricing: Free to access as a NOAA federal research program. No commercial plans or subscription tiers.
8. NDBC
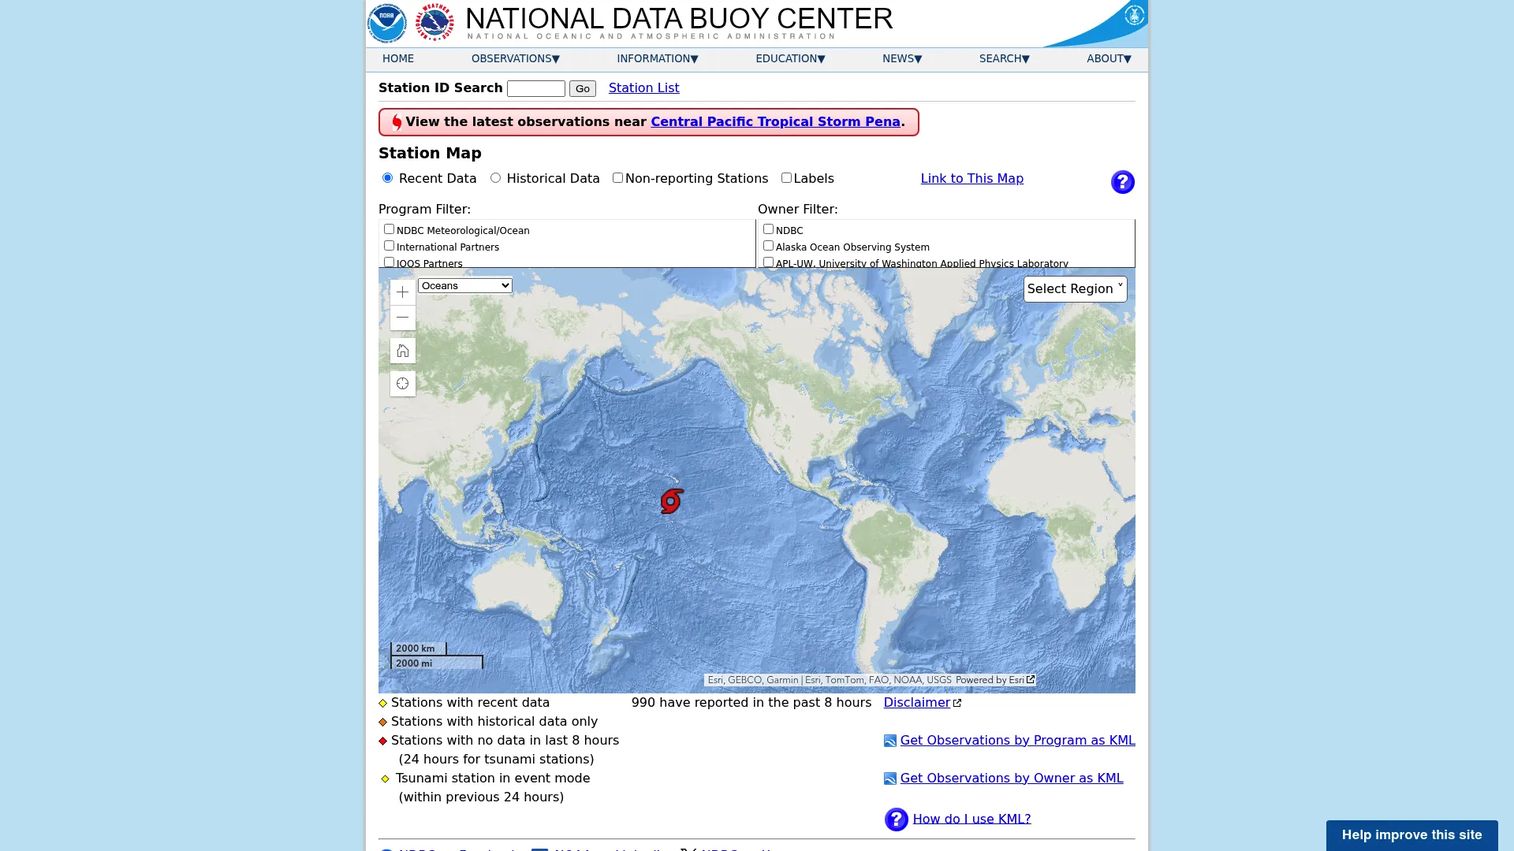
NDBC, the National Data Buoy Center, operates and disseminates real-time marine, meteorological, oceanographic, and tsunami observations from moored buoys, coastal stations, drifting buoys, and offshore platforms. For wind data, wave height, barometric pressure, sea surface temperature, and marine condition records, NDBC is the primary official source. It supports maritime logistics, coastal risk assessment, offshore operations, shipping, and environmental monitoring products that land-based networks cannot serve.
Best for: Teams needing marine weather observations from buoy and coastal station networks.
Key features
- Real-time data from moored buoys, coastal stations, and drifting buoys
- Historical and quality-controlled station archives
- Station pages with current conditions, hourly history, and five-day plots
- HTTP and wget data access, plus station ID search and interactive maps
- Barometric pressure, wave height, and sea surface temperature records
Why choose NDBC: Use NDBC when land-based weather stations do not describe your operating environment. Products built around maritime conditions, coastal risk, or offshore asset management need observation data that originates at sea, not at an airport runway.
NDBC pricing: Free to access as a NOAA government observation and data service.
9. CoastWatch
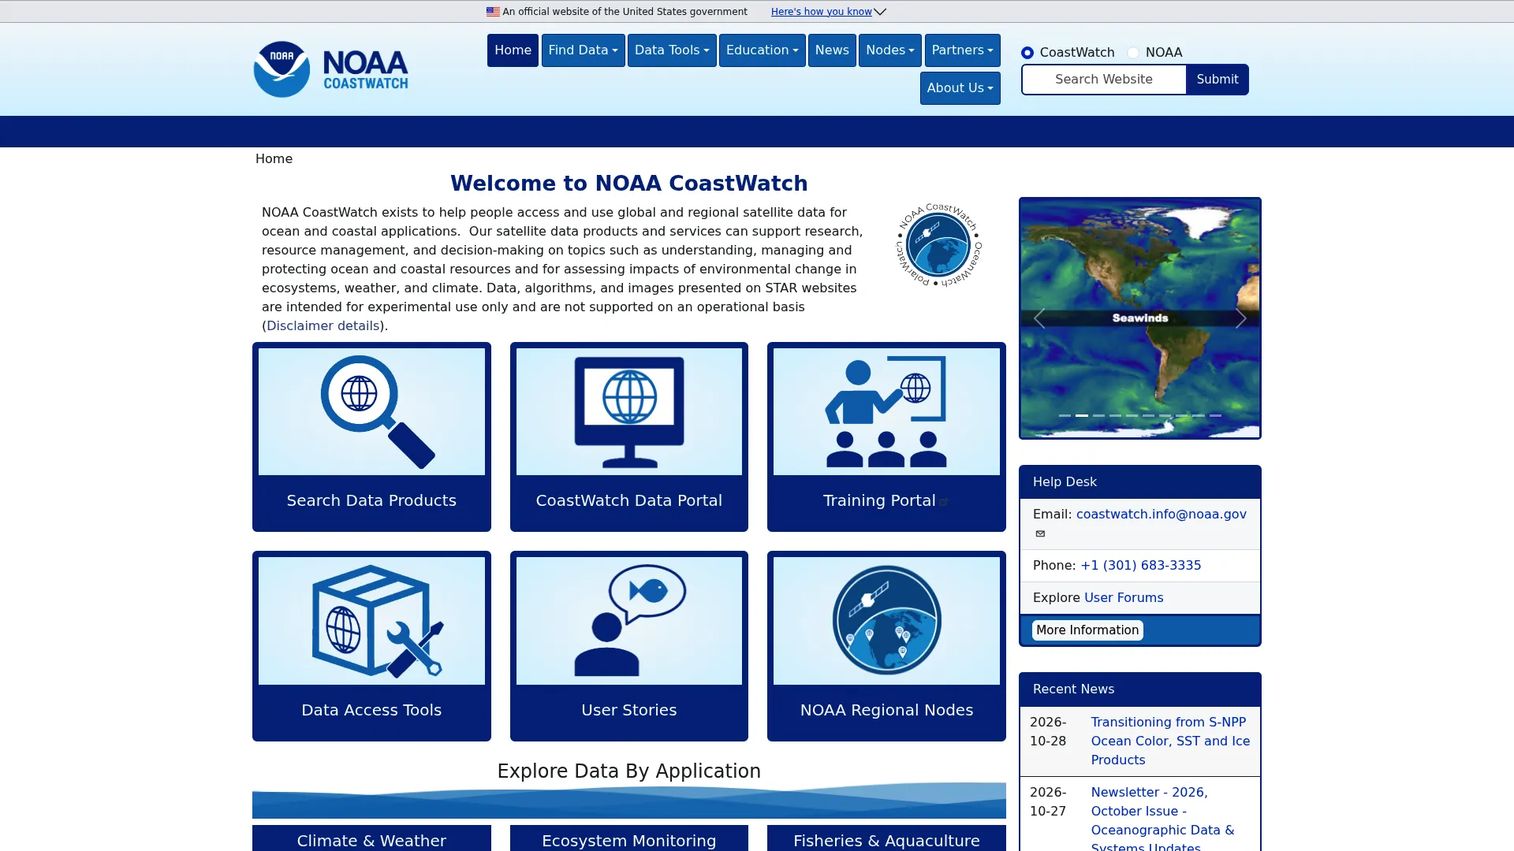
NOAA CoastWatch provides access to global and regional satellite data products for ocean and coastal research, resource management, and decision-making. Its data catalog covers sea surface temperature, ocean color, sea ice extent, wind fields, salinity, and ocean currents, all derived from satellite sensors rather than ground-based stations. For teams building ocean, coastal, fisheries, or environmental analytics products, CoastWatch fills the data gap that buoy networks and station archives leave.
Best for: Teams building ocean, coastal, fisheries, or environmental analytics products that require satellite-derived data.
Key features
- Satellite data product search across global and regional datasets
- CoastWatch Data Portal for discovery and access
- Sea surface temperature, ocean color, sea ice, winds, salinity, and currents
- Data access tools and training portal
- Regional data nodes for coastal and oceanographic applications
Why choose CoastWatch: Choose CoastWatch when satellite-derived spatial data matters more than point observations from a fixed station. It fits specialized environmental and ocean analytics products better than general weather dashboards built on station networks.
CoastWatch pricing: Free to access as a NOAA data and services program. No commercial subscription tiers.
10. NowCOAST
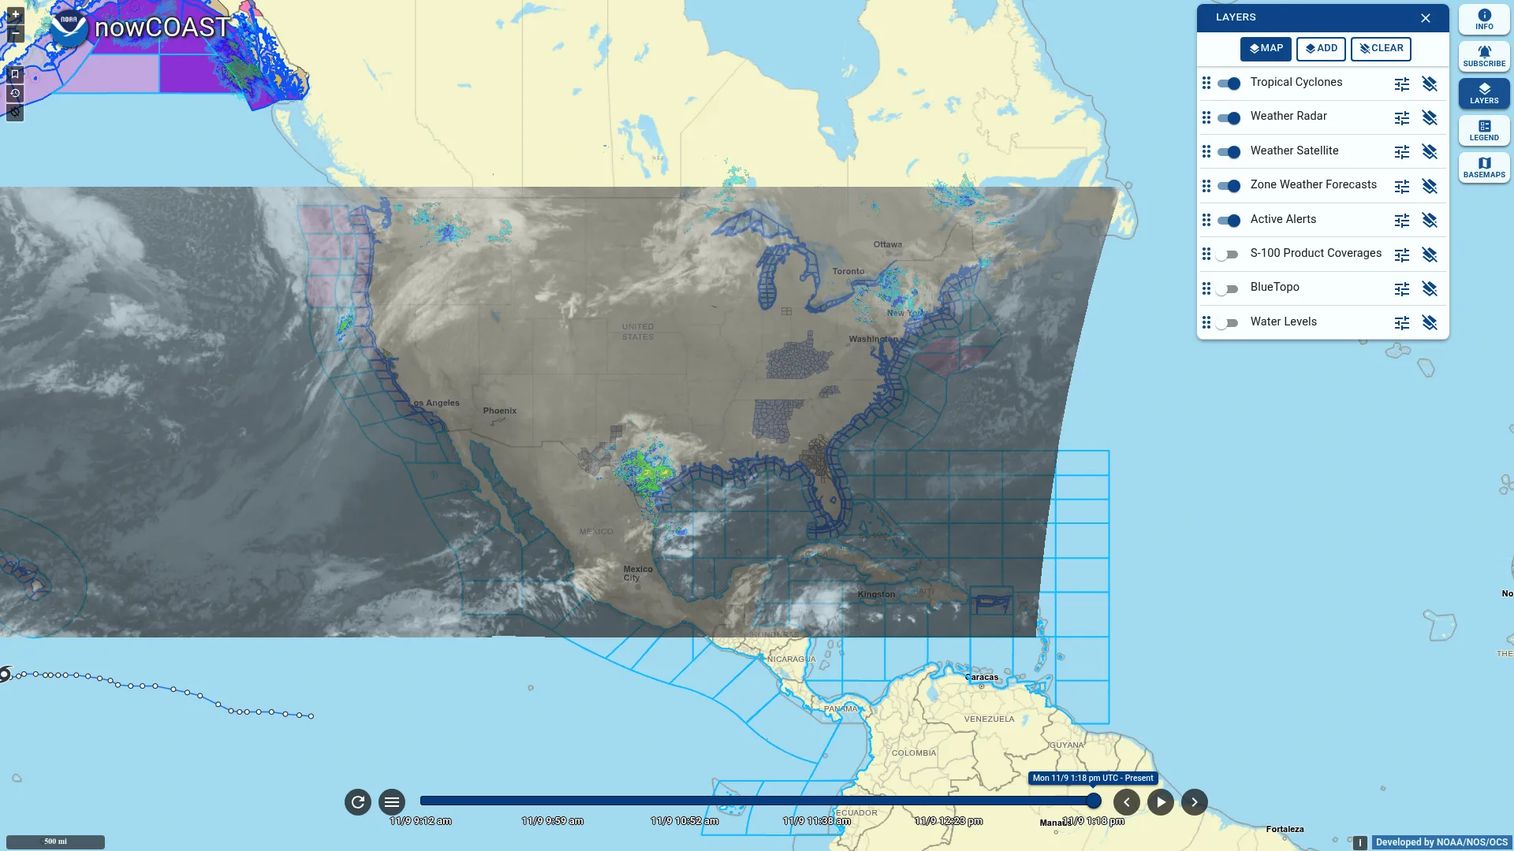
NowCOAST is NOAA's GIS-based web mapping application providing frequently updated coastal and marine observations, forecasts, alerts, and oceanographic model guidance. It is not a data download interface. It is a map viewer that combines weather, ocean, and coastal layers into a spatially integrated picture, with direct access to underlying map services for teams building their own GIS applications. For founders and analysts who need to understand weather context spatially before deciding which raw data source to query, NowCOAST is a practical starting point.
Best for: Teams needing map-based weather and coastal data layers for planning or situational awareness.
Key features
- Interactive map viewer for near-real-time weather and ocean observations
- Coastal and marine weather forecast, watch, warning, and advisory overlays
- Oceanographic model guidance for water levels, temperature, salinity, and currents
- Weather radar, satellite imagery, wind, and sea surface temperature layers
- Direct access to map services for integration into third-party GIS applications
Why choose NowCOAST: Pick NowCOAST when a map view tells you more than a spreadsheet. It helps teams see the full spatial picture before committing to a specific raw data source, and its underlying map services are available for integration if your product needs GIS-style weather layers.
NowCOAST pricing: Free to access as an online map viewer and map service. NOAA confirms no commercial pricing tiers.
11. Wisconsin State Climatology Office
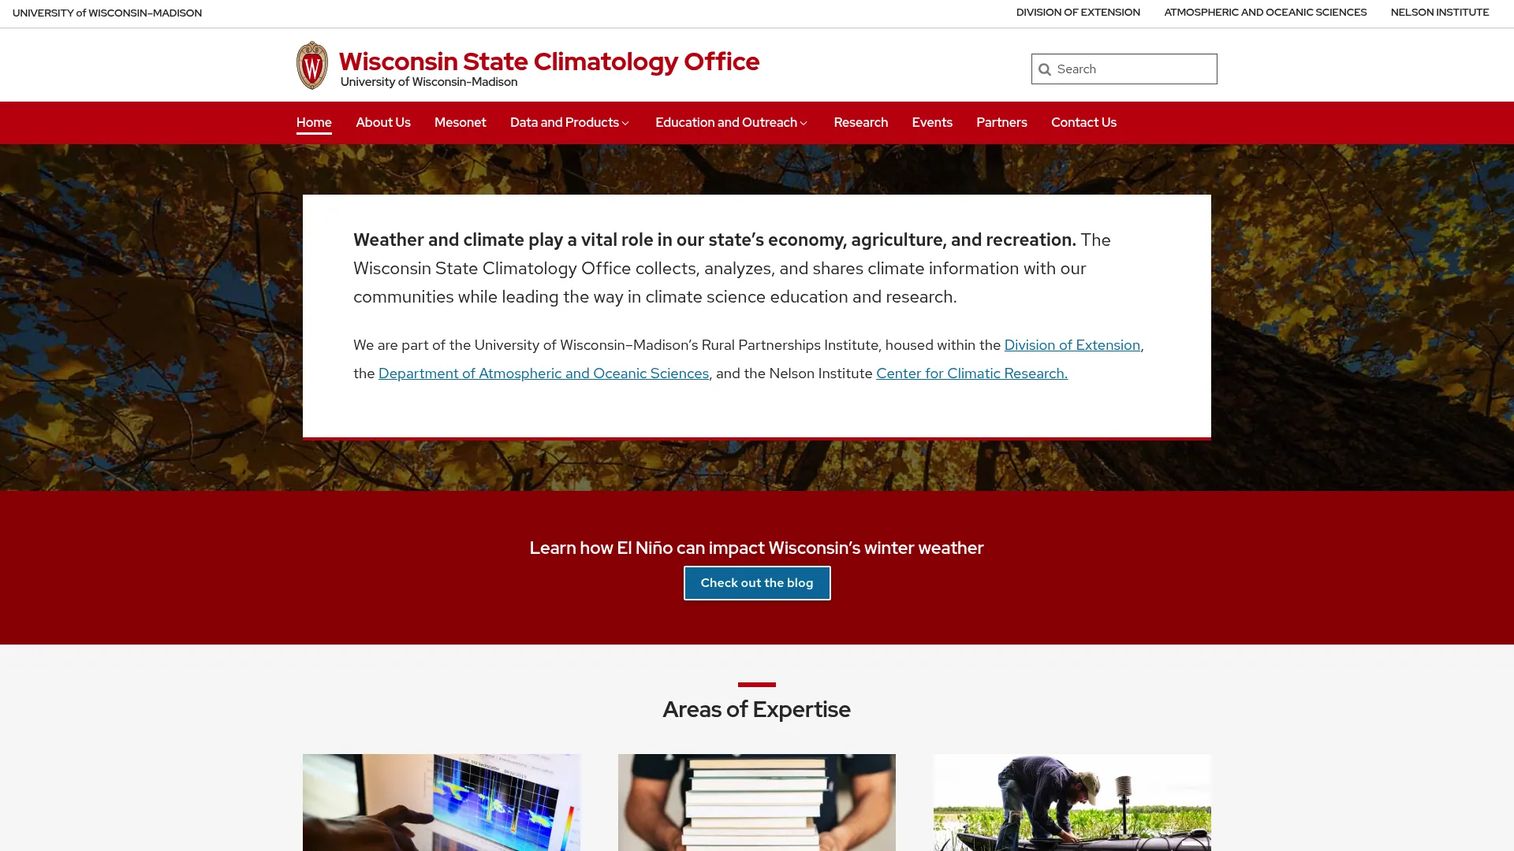
The Wisconsin State Climatology Office, based at the University of Wisconsin-Madison, provides Wisconsin climate data, research, and outreach services including recent and historic temperature and precipitation records, 1991 to 2020 climate normals, drought information, snowfall, degree-day data, and county-level climate profiles. It is representative of the network of state climatology offices that serve as regional authoritative sources when national archives are too broad and consumer tools lack institutional credibility.
Best for: Teams that need Wisconsin-specific climate context from an institutional source for local research or regional product development.
Key features
- Recent and historic temperature, precipitation, and snowfall data for Wisconsin
- 1991 to 2020 climate normals for Wisconsin stations
- Daily weather almanac with normal-versus-observed comparisons
- Degree-day data for agriculture and energy applications
- County climate profiles and station history context
Why choose Wisconsin State Climatology Office: Use it when state-level context matters more than national breadth. State climatology offices sit between NCEI's vast archive and a consumer weather page: They are institutionally credible, locally specific, and easier to navigate than a full federal archive query.
Wisconsin State Climatology Office pricing: Free to access as a University of Wisconsin public resource. No commercial plans.
12. Weather Almanac
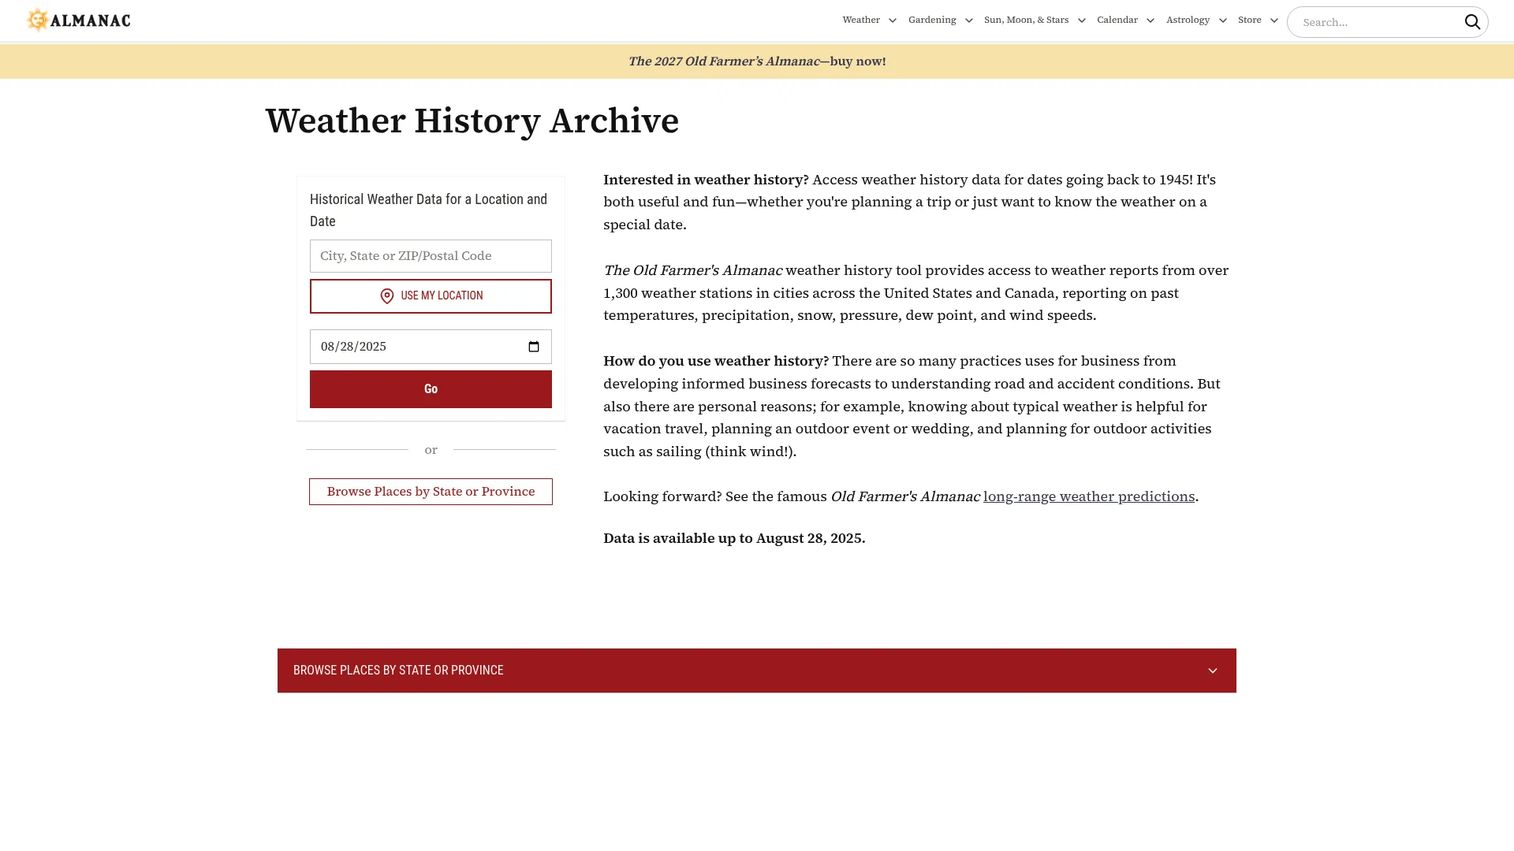
The Weather Almanac on The Old Farmer's Almanac site provides historical weather data for selected U.S. and Canadian locations dating back to 1945, drawing from more than 1,300 weather stations. The tool reports temperature, precipitation, snow, pressure, dew point, and wind speed for a selected date and location. It is an almanac-style interface, readable and direct, covering daily records, normal-versus-observed comparisons, and local climate reference values without requiring a data pipeline or technical query.
Best for: Teams and analysts who need quick daily climate context without building custom queries.
Key features
- Historical weather data dating back to 1945 for selected locations
- Coverage from more than 1,300 stations across the U.S. and Canada
- Temperature, precipitation, snow, pressure, dew point, and wind speeds
- Normal-versus-observed daily comparisons
- Almanac-style format with daily records for each date
Why choose Weather Almanac: Choose it when the question is simple: What happened, and how does today compare to the historical record? For deeper modeling or analysis requiring full station archives and downloadable datasets, pair it with NCEI or NOWData.
Weather Almanac pricing: Free web access on The Old Farmer's Almanac site. No subscription required for historical lookups.
Considerations when choosing weather data sources
Match the source to the decision
Current observations, historical records, climate normals, and forecasts answer different questions. Using a forecast feed for historical analysis produces wrong results. Using a climate normal as a current condition leads to dashboards that are off by design. Identify whether the decision is about now, the past, a long-term benchmark, or a future outlook before you evaluate any source.
Check station metadata before trusting the number
Look for station ID, geographic coordinates, elevation, instrument type, time zone, and observation interval before treating a weather number as production-ready. For dashboards, alerts, audit trails, and customer disputes, that metadata is what separates a defensible data point from a number you cannot explain.
Verify commercial and product-use terms before you build
Free access to public data does not automatically mean unlimited commercial reuse. Attribution requirements, rate limits, API terms, and redistribution rules vary by source and can change. Document the license decision before a feature ships, not after a customer or auditor raises the question.
Plan for missing data and preliminary records
Weather records can be preliminary, corrected, or simply unavailable for certain stations and date ranges. Build fallback logic and quality-control checks into any automated pipeline that depends on weather data. NCEI and NWS label preliminary data clearly, but downstream tools do not always carry those flags forward.
Decide whether the workflow is human-driven or automated
A web table is fast for a human analyst but wrong for a system that needs structured data on a schedule. A full archive download may be overkill for a one-time benchmark check. Match the access method to the actual operating workflow before committing to a source.
Conclusion
Pick the source by decision type, not by familiarity.
NOAA is the safest starting point for official U.S. weather and climate data with strong provenance. NWS handles operational forecasts and warning feeds. NOAA NCEI is the archive choice for historical and climate analysis that will survive board or customer scrutiny. Weather Underground is the fastest option for a quick daily history check when depth and licensing are not constraints.
NDBC and the Great Lakes Environmental Research Laboratory matter when water and wind conditions are the core variable. The Climate Prediction Center belongs in seasonal planning and risk modeling workflows rather than operational dashboards. State climatology sources like the Wisconsin State Climatology Office carry institutional credibility for regional work that national archives serve less precisely. For quick daily normal comparisons without a data pipeline, the Weather Almanac does the job.
Then test the data against one real workflow before you build it into your product. A source that looks right in a browser often behaves differently at query scale, in automated pipelines, or under commercial licensing scrutiny.
FAQs
No single source is the best for every job. NOAA is a strong starting point for official U.S. weather and climate data across observations, forecasts, and long-term records. Use NWS for operational forecasts and public warnings, NOAA NCEI for historical archives, and specialized sources like NDBC or CoastWatch for marine and satellite data.
NOAA NCEI is the primary archive for multi-decade U.S. climate and weather records with downloadable datasets and quality-controlled station data. NOWData provides station-based climate summaries in a faster web interface. Weather Underground covers recent daily history in a readable format, and state climatology offices are strong for region-specific historical records.
Weather data describes atmospheric conditions at specific times and locations: What the temperature was at 3pm on a given day, for example. Climate data summarizes patterns across long time periods, typically 30 years or more. Climate normals, which represent multi-decade averages, are used as baseline expectations for benchmarking and anomaly detection, not as descriptions of current conditions.
Free access does not automatically resolve commercial use. Each source has its own terms of service, attribution requirements, API rate limits, and redistribution rules. NOAA and NWS data are generally in the public domain, but API and commercial reuse terms for downstream products and services vary. Document the specific source, the license decision, and any attribution requirements before a commercial feature ships.
The right data type depends on the workflow the product serves. Use current observations for live operational dashboards, forecasts for planning features, historical data for backtesting and analytics, and climate normals for benchmark comparisons. Build in fallback logic for missing data and attach station metadata to any number that will appear in a customer-facing or auditable context.
Accuracy depends on station quality, maintenance schedule, sensor exposure, instrument type, and observation interval. Official government stations maintained by NOAA and NWS carry better metadata and pass through formal quality-control processes. Personal weather station networks offer broader geographic coverage but require more validation before you treat individual readings as production-grade inputs.
Climate normals are long-term statistical averages calculated over a standard reference period, currently 1991 to 2020 for U.S. normals. They represent expected conditions for a given location, month, and variable, and are used for planning, anomaly detection, agricultural scheduling, energy modeling, and local climate context. They are not current conditions or forecasts.
NDBC is the strongest source for buoy and coastal station wind data, wave height, barometric pressure, and sea surface temperature from offshore and nearshore platforms. The Great Lakes Environmental Research Laboratory provides high-frequency station data with wind rose plots for the Great Lakes region. NowCOAST and CoastWatch add map layers and satellite-derived coastal environmental data where spatial context matters as much as point observations.