You've run the retrospective. Engineering points at design handoffs. Design points at unclear requirements. Ops points at deployment bottlenecks. Everyone agrees there's waste in the system. Nobody agrees where it actually lives.
That's the problem value stream mapping software solves. A value stream map forces the whole flow onto one canvas - every step, wait time, and handoff - so the bottleneck isn't a theory anymore. It's a box on a diagram with a number next to it.
The market is responding. Custom Market Insights estimated the global value stream management market at USD 2.2 billion in 2024, with a projected 12.5% CAGR through 2034. Adoption is still uneven: A 2023 Atlassian PulseMeter survey found 40% of teams still rely on homegrown metrics, and only 15% report significant improvements. That gap between intent and outcome often traces back to tool choice, not methodology.
This guide cuts through the options for PMs who need cross-functional visibility, clear flow metrics, and a tool the team will actually maintain between sprints.
What's inside
This guide covers 7 value stream mapping tools evaluated for software delivery teams, lean operations, and cross-functional PM use cases. Selection criteria:
- Mapping capability: Does it support VSM symbols, current-state and future-state flows, and process metrics?
- Collaboration: Can engineering, design, and ops work in the same map without friction?
- Maintainability: How much overhead does it create when the product changes?
- PM fit: Does it surface the data a PM needs to prioritize improvements and make the case to stakeholders?
TL;DR
- Best purpose-built VSM tool: eVSM, for lean teams that need mixed-model mapping and automated analysis
- Best for collaborative diagramming: Lucidchart, for PMs who map with cross-functional stakeholders
- Best for software delivery flow metrics: Atlassian (Jira), for teams already in the Atlassian stack
- Best free framework resource: DORA, for benchmarking software delivery performance without buying software
- Best free CD practice guide: MinimumCD, for teams defining a baseline continuous delivery process
- Best for workshops and alignment: Miro, for facilitated current-state mapping before moving to a specialist tool
- Best for Microsoft environments: Microsoft Visio, for enterprise teams standardized on M365
What is value stream mapping software
Value stream mapping software is a category of diagramming and process analysis tools that helps teams document, visualize, and improve the end-to-end flow of work from customer request to delivery.
The discipline comes from lean manufacturing but applies directly to software delivery, where the "value stream" covers every step from feature request to production deployment - including all the queues, approvals, and handoffs in between.
Core capabilities to look for:
- VSM symbol libraries: Standard lean icons (process boxes, push arrows, inventory triangles, data boxes) for building recognizable current-state and future-state maps
- Process metrics: Fields for cycle time, lead time, process time, and percent complete and accurate (%C&A) at each step
- Collaboration: Real-time or async co-editing so engineering, design, QA, and ops can contribute to the same map
- Templates: Pre-built VSM starters that reduce setup time for teams new to the method
- Export and sharing: PDF, image, or link-based sharing for stakeholder reviews and documentation
- Integration: Connections to Jira, Confluence, or other delivery tools so the map stays close to where work actually happens
Key concepts:
- Current-state map: Documents how work flows today, including wait times and waste
- Future-state map: Shows the target flow after improvements are implemented
- Kaizen bursts: Annotations marking specific improvement opportunities on the map
- Lead time vs. cycle time: Lead time covers the full customer-facing duration; cycle time measures active work time at a given step
- Lean value stream mapping: The methodology originating from Womack and Jones, adapted for software delivery by practitioners like Karen Martin
For PMs, the most important output of VSM software isn't the diagram itself. It's the conversation the diagram forces - across engineering, product, and operations - about where wait time actually accumulates and what the highest-leverage improvement looks like.
When to use value stream mapping software
Visualize flow before a major re-architecture
When the team is debating whether to rebuild a system or refactor incrementally, a current-state value stream map makes the tradeoffs concrete. Mapping the existing flow often reveals that the bottleneck isn't technical debt in the code; it's a three-day approval queue or a manual testing step nobody had instrumented.
Align cross-functional teams on where delays live
Retrospectives surface pain, but they rarely produce shared agreement on root cause. A VSM workshop - with engineering, design, QA, and ops in the same session - builds that agreement fast. Everyone annotates the same map, so the conversation shifts from "your team is slow" to "this handoff takes six days and here's why."
Measure software delivery performance against a baseline
For PMs running continuous improvement programs, VSM software gives you a documented baseline. You capture lead time and cycle time at each step today, implement a change, and re-map to confirm improvement. Without that baseline, improvement claims are qualitative. With it, you have before-and-after data to bring to leadership.
Value stream mapping software comparison
The table below covers all 7 tools by best fit, key differentiator, pricing, and G2 rating. Guideflow is excluded from this list because value stream mapping is outside its category - it focuses on interactive demo automation. Use the table to shortlist before reading the full item sections.
| # | Product | Best for | Key differentiator | Pricing | G2 rating |
|---|---|---|---|---|---|
| 1 | eVSM | Lean teams, mixed-model VSM | Purpose-built VSM analytics and automation | From $1,950/year (small site) | 4.4/5 |
| 2 | Lucidchart | Cross-functional diagramming | Templates, real-time collaboration, integrations | From $7/user/month | N/A |
| 3 | Atlassian | Software delivery flow metrics | Jira-native workflow visibility | Free up to 10 users; from $7.91/user/month | 4.4/5 |
| 4 | DORA | Software delivery benchmarking | Research-backed capabilities and Quick Check diagnostics | Free | N/A |
| 5 | MinimumCD | CD practice baseline | Community-defined minimum viable continuous delivery | Free | N/A |
| 6 | Miro | Workshop facilitation and alignment | 7,000+ templates, AI workspace, 250+ integrations | Free; from $8/member/month | 4.6/5 |
| 7 | Microsoft Visio | Enterprise documentation | Microsoft-native diagramming with M365 integration | From $5/user/month (Plan 1) | 4.2/5 |
7 best value stream mapping software for 2026
1. eVSM
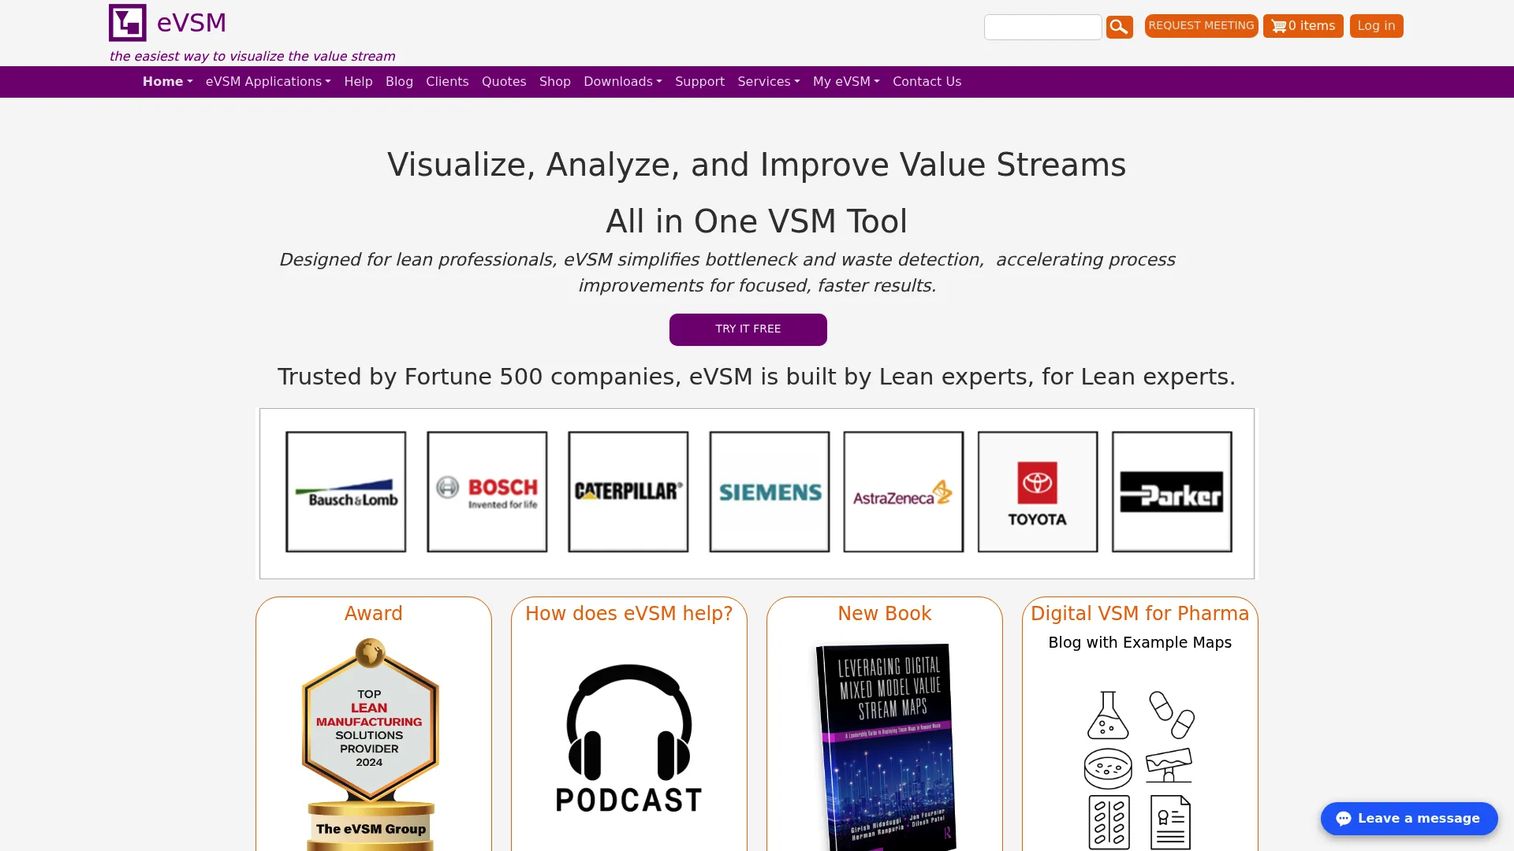
eVSM is purpose-built value stream mapping software for lean and operations teams. Unlike general diagramming tools, it ships with VSM-specific analytics, mixed-model mapping support, and a built-in improvement cycle workflow. It's the closest thing on this list to a specialist VSM platform rather than a diagramming tool that happens to include VSM templates.
Best for: Lean practitioners and operations teams that need digital VSM with quantitative analysis, not just a drawing canvas.
Key features
- Mixed-model value stream mapping for multi-product or multi-variant flows
- Built-in analytics: Automated cycle time, lead time, and efficiency calculations
- Full improvement-cycle planning, from current state through kaizen to future state
- eLearning, software updates, and technical support bundled with all licenses
Why choose eVSM: If your team runs formal lean improvement programs and needs a tool that enforces VSM methodology rather than just enabling it, eVSM is the right fit. For PMs at manufacturing-adjacent software companies or DevOps teams running structured kaizen events, the automated analysis removes the manual spreadsheet math that usually slows down post-mapping work.
eVSM pricing: The small site annual license runs $1,950/year, with additional seats at $390 each. An academic license is available at $150/year. Larger organizations with more than 500 associates are charged $1,450 plus $1 per associate annually. An 8-hour coaching package is available separately at $1,950 as a one-time add-on. There is no free tier.
eVSM holds a 4.4/5 rating on G2 based on verified reviews.
2. Lucidchart
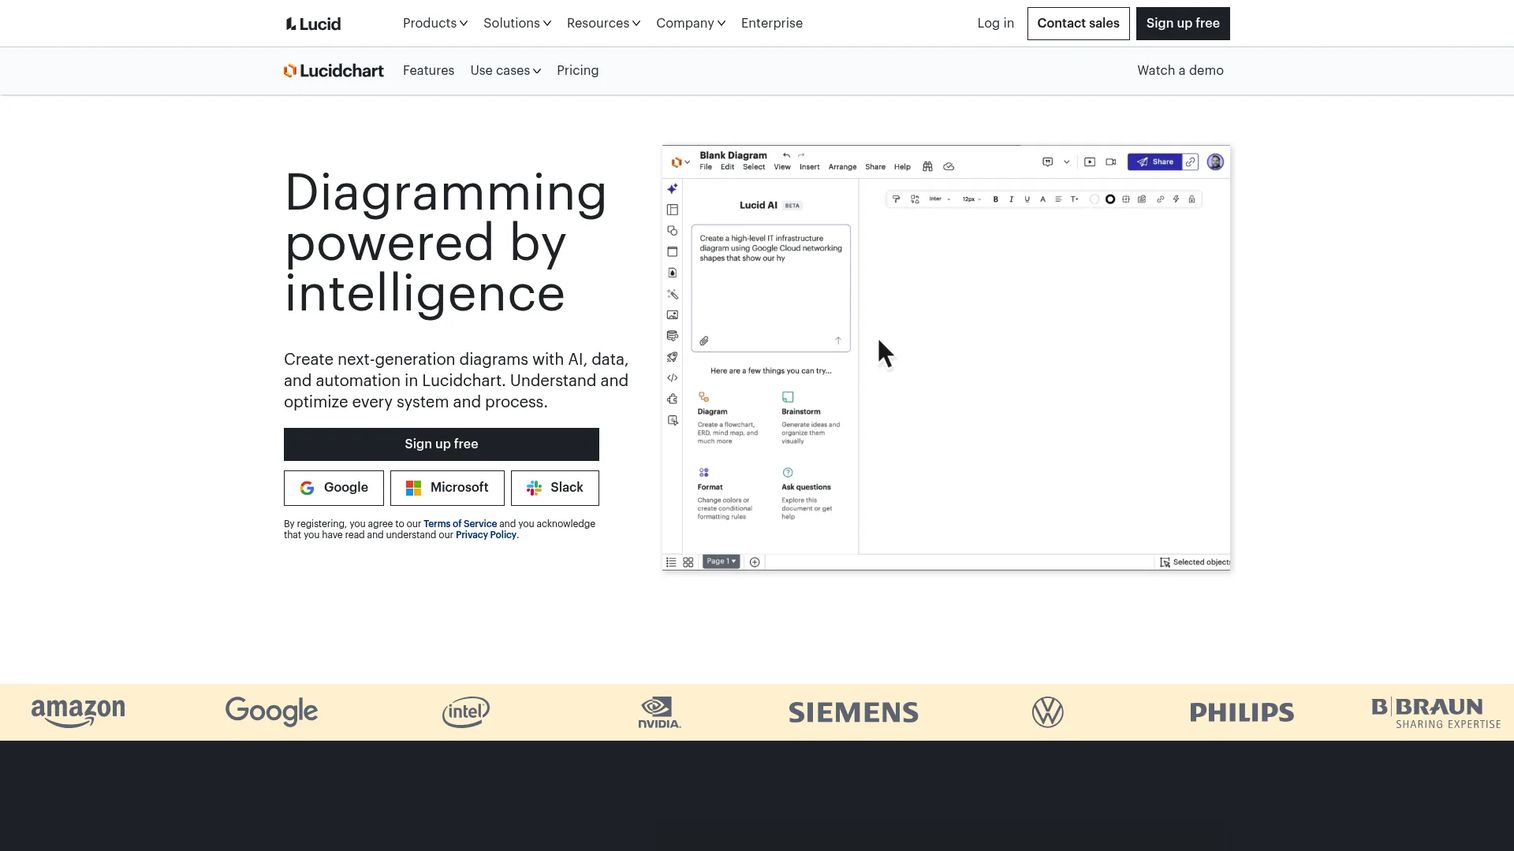
Lucidchart is cloud-based diagramming and visual collaboration software. It covers flowcharts, org charts, network diagrams, and process maps - including value stream maps via its template library. For PMs who need to map flows with stakeholders across engineering, design, and operations, Lucidchart's real-time co-editing and sharing capabilities make the collaboration side straightforward.
Best for: Cross-functional product and engineering teams that need collaborative process mapping with strong sharing and presentation features.
Key features
- VSM and process map templates, plus a full lean symbol library
- Real-time co-editing with comment threads and revision history
- Integrations with Jira, Confluence, Google Workspace, and Microsoft 365
- Shareable links, embed options, and export to PDF or image formats
Why choose Lucidchart: It's the right pick when the map is a collaboration artifact as much as an analysis tool. If you're running a VSM workshop with six people from different teams who all need to annotate simultaneously, Lucidchart handles that without friction. It won't do the automated lean analytics that eVSM provides, but for most PM use cases - current-state documentation, stakeholder alignment, and process presentation - that tradeoff is acceptable.
Lucidchart pricing: A free account is available with limited functionality. The Individual plan starts at $7 per user per month (billed monthly), and the Team plan is $9 per user per month. Enterprise pricing requires contacting sales.
G2 rating data was not verified at generation time for Lucidchart - check the Lucidchart G2 listing directly before shortlisting.
3. Atlassian
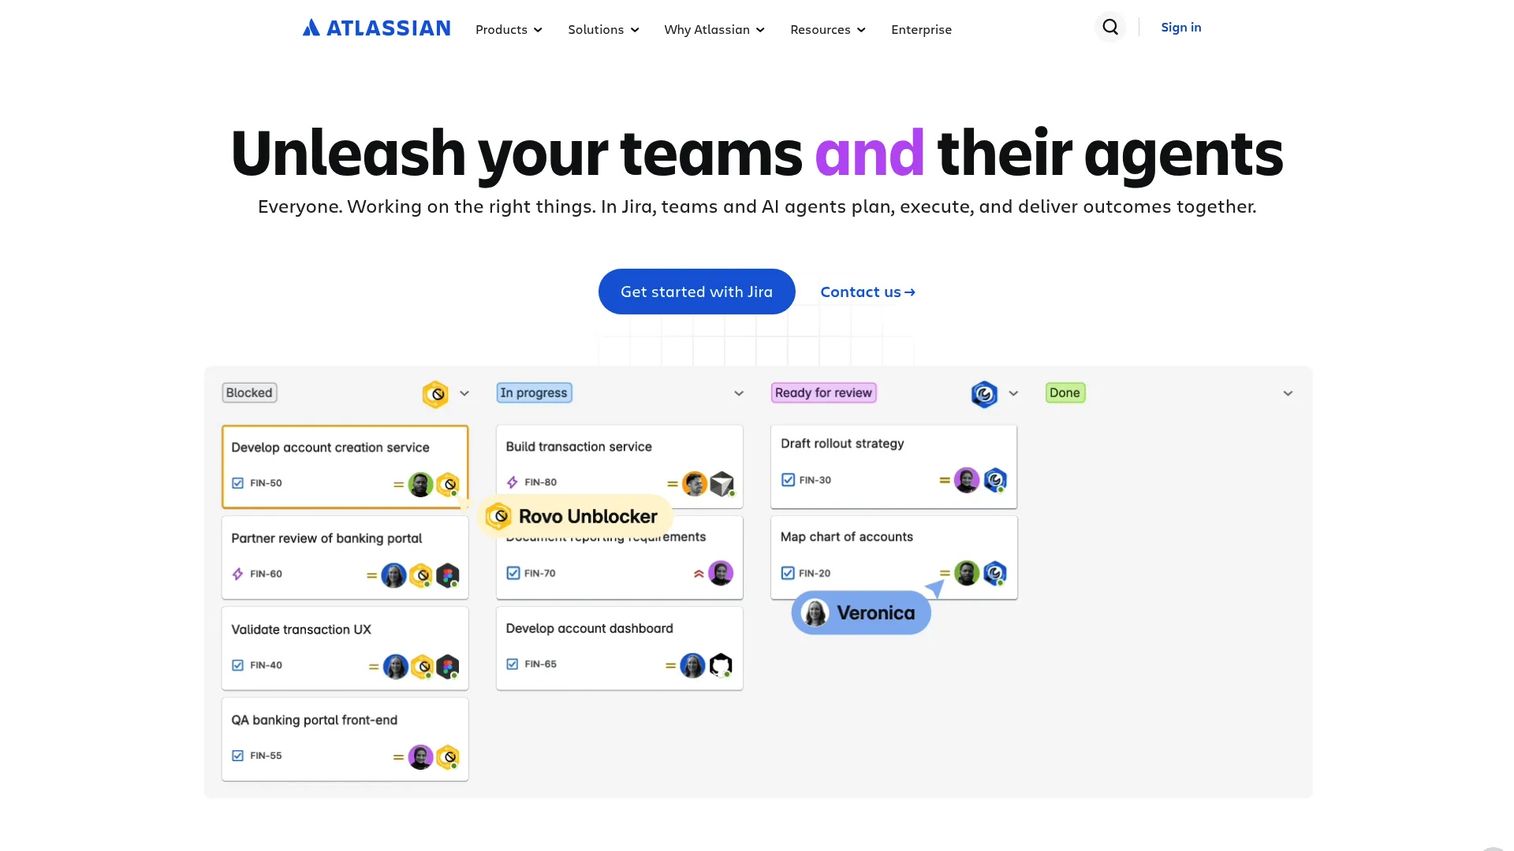
Atlassian isn't a VSM tool in the traditional lean sense, but for software delivery teams it's where most value stream data already lives. Jira tracks issues, epics, and sprints. Confluence holds documentation. Jira Service Management covers IT and support workflows. Together, they give PMs a connected view of software delivery flow without requiring a separate mapping application.
Best for: Software engineering and product teams that want to instrument and visualize delivery flow inside the tools they already use for planning and tracking.
Key features
- Jira workflow visualization: Board, backlog, timeline, and cumulative flow views
- Confluence for documenting current-state and future-state process maps
- Jira Service Management for end-to-end service and delivery flow
- Native integrations across the Atlassian suite and third-party tools
Why choose Atlassian: The 2023 Atlassian PulseMeter survey found that 40% of teams still use homegrown metrics for VSM, and only 15% report significant improvements. For teams already in Jira, Atlassian provides the instrumentation layer to move from homegrown tracking to structured flow measurement without a separate tool purchase. The tradeoff is that Jira isn't a VSM canvas - you won't produce a lean-style diagram, but you will get cycle time and throughput data.
Atlassian pricing: Jira Cloud offers a free plan for up to 10 users. The Standard plan is $7.91 per user per month (billed monthly), and the Premium plan is $14.54 per user per month. Enterprise plans require annual billing and direct contact with sales.
Atlassian holds a 4.4/5 rating on G2 across its product suite.
4. DORA
DORA is Google Cloud's research program for software delivery performance. It's not commercial VSM software - it's a free framework with a capabilities catalog, annual research reports, and a Quick Check diagnostic tool that benchmarks a team's delivery performance against industry data. For PMs running software value stream mapping initiatives, DORA provides the metrics model that makes VSM outcomes measurable.
Best for: Product and engineering leaders who need a research-backed framework for measuring and improving software delivery performance.
Key features
- DORA Core capabilities catalog covering technical, process, and cultural practices
- Quick Check diagnostic: Benchmarks deployment frequency, lead time for changes, change failure rate, and time to restore
- Annual State of DevOps research reports with longitudinal data
- Open access, no license required
Why choose DORA: The four DORA metrics (deployment frequency, lead time for changes, change failure rate, and time to restore service) map directly onto what a VSM exercise surfaces in a software delivery context. Use DORA to define what "improvement" means before you build your current-state map, and use it again to validate whether the future state actually changed the numbers. It's a framework, not a drawing tool - pair it with Jira, Miro, or Lucidchart for the visual mapping layer.
DORA pricing: All DORA resources, including the Quick Check diagnostic and research publications, are free. No commercial plans exist.
No G2 rating is available for DORA, as it is a research program rather than a commercial product.
5. MinimumCD
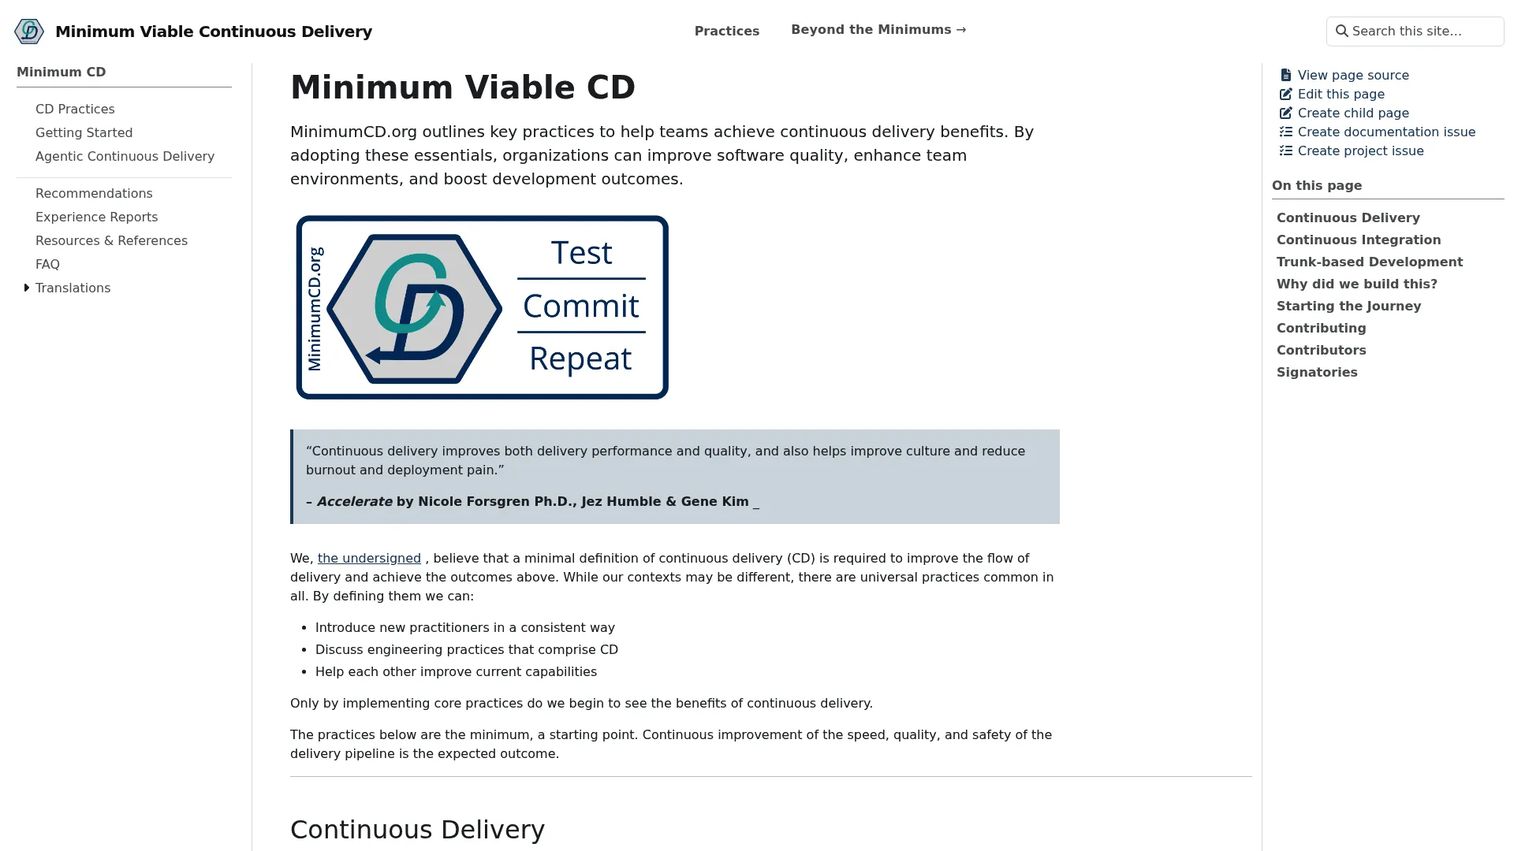
MinimumCD is a community-maintained definition of the minimum practices required for continuous delivery. Like DORA, it's not commercial software - it's a free, open reference that teams use to establish a shared baseline for their delivery process before mapping the current state of that process.
Best for: Teams that need a clear, consensus-based definition of continuous delivery practices to anchor a VSM exercise or delivery improvement program.
Key features
- Minimum viable continuous delivery practice checklist
- Continuous integration guidance, including trunk-based development requirements
- Open, community-maintained content with no vendor lock-in
- Reference point for evaluating whether a team's current delivery process meets CD minimums
Why choose MinimumCD: When a VSM exercise surfaces that the team's current-state delivery process doesn't meet basic continuous delivery criteria, MinimumCD gives the PM a neutral, community-backed reference to frame the gap. It's useful for alignment conversations with engineering leadership because it's not vendor marketing - it's a practitioner consensus document. Pair it with a mapping tool (Miro or Lucidchart) and flow metrics (DORA or Jira) for a complete improvement program.
MinimumCD pricing: Entirely free. The site is a community resource with no commercial plans.
No G2 rating applies to MinimumCD.
6. Miro
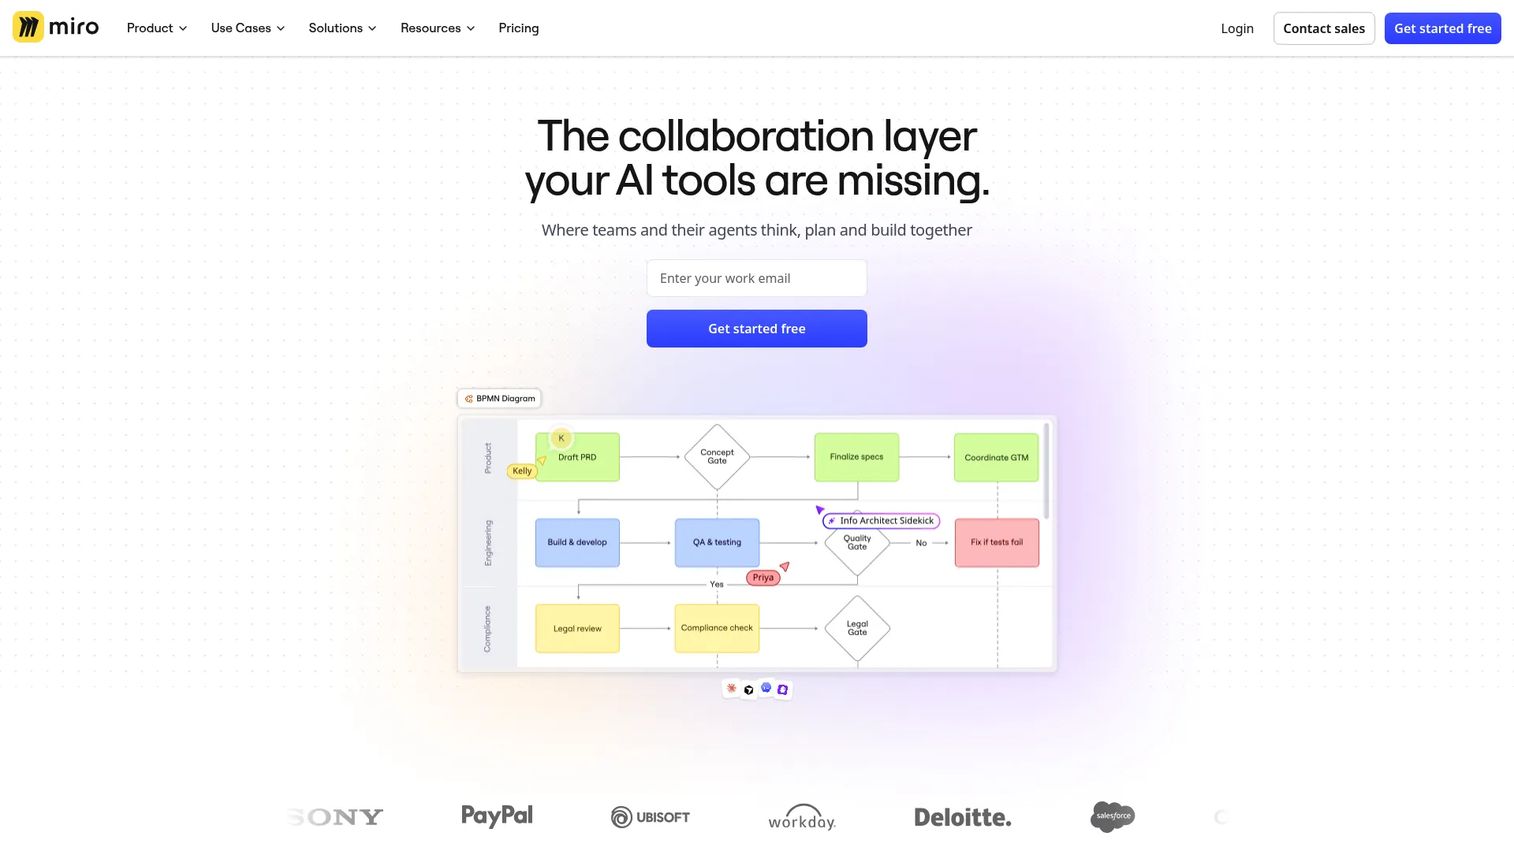
Miro is an AI-powered online whiteboard built for cross-functional collaboration. It's not VSM-specific, but its template library includes current-state and future-state VSM templates, and its real-time collaboration makes it well suited for facilitated mapping workshops. For PMs who need to get a room (or a Zoom) of people onto a shared canvas fast, Miro removes the setup friction.
Best for: Cross-functional teams running facilitated VSM workshops where real-time co-editing, sticky notes, and async contribution matter more than automated lean analytics.
Key features
- 7,000+ templates, including lean and value stream mapping starters
- Real-time collaboration with cursor tracking, commenting, and voting features
- 250+ integrations, including Jira, Confluence, Asana, and Slack
- AI-powered workspace for summarization, clustering, and content generation
Why choose Miro: Miro is where most PM-led VSM workshops start. It's accessible to non-technical stakeholders, requires no installation, and produces a map everyone can reference asynchronously after the session. The limitation is that it won't calculate cycle time or lead time automatically - you add those manually. Teams that graduate beyond workshop mapping to ongoing flow measurement typically move data into Jira or a specialist tool, but Miro remains the right surface for the alignment work.
Miro pricing: A free plan includes 3 editable boards. The Starter plan runs $8 per member per month (billed yearly). The Business plan is $20 per member per month (billed yearly). Enterprise pricing is custom for organizations with 30 or more members.
Miro holds a 4.6/5 rating on G2 based on verified reviews.
7. Microsoft Visio
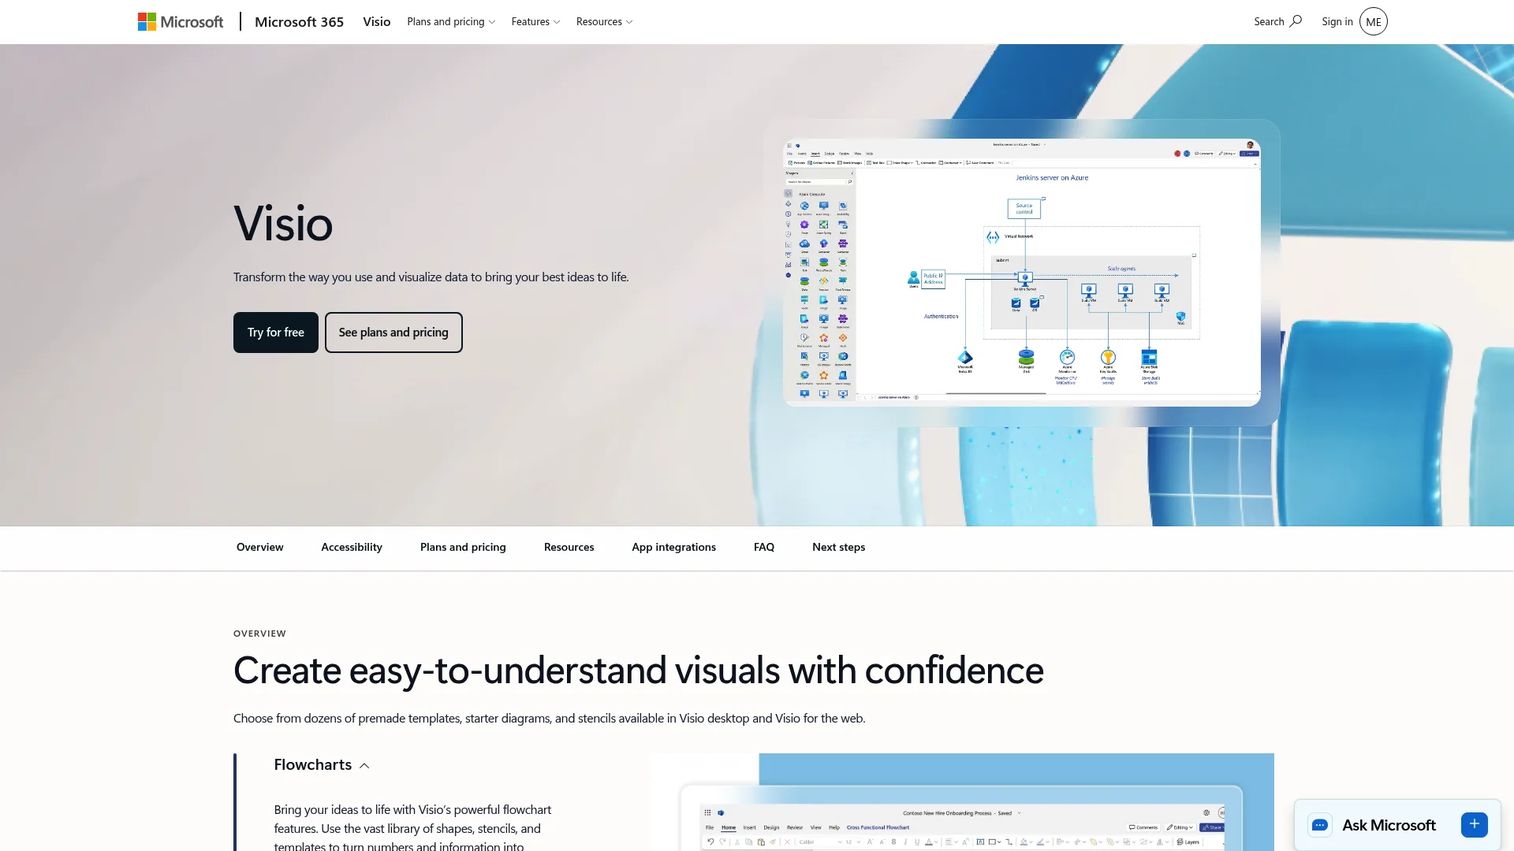
Microsoft Visio is Microsoft's diagramming and flowchart tool, available as a web app and as a desktop application in higher-tier plans. It includes standard VSM shapes and templates alongside process maps, network diagrams, and org charts. For teams already standardized on Microsoft 365, Visio integrates into SharePoint, Teams, and OneDrive without requiring a separate account or platform context switch.
Best for: Enterprise teams operating in Microsoft 365 environments that need formal process documentation and diagram sharing within the M365 ecosystem.
Key features
- VSM and flowchart shape libraries with Microsoft-native symbols
- Visio Plan 2 adds desktop app with advanced diagramming and offline support
- SharePoint and Teams integration for in-context diagram access
- Export to PDF, SVG, and image formats for stakeholder sharing
Why choose Microsoft Visio: If your organization is already paying for Microsoft 365 and the team uses Teams for collaboration, Visio Plan 1 adds formal diagramming capability at $5 per user per month without requiring a new vendor relationship. The collaboration experience isn't as fluid as Miro or Lucidchart for real-time workshop use, but for documented, version-controlled process maps that live alongside M365 content, it's the lowest-friction option in an enterprise Microsoft environment.
Microsoft Visio pricing: Visio is included in Microsoft 365 commercial plans at a basic level. Visio Plan 1 costs $5.00 per user per month (billed yearly) and covers the web and Teams apps. Visio Plan 2 is $15.00 per user per month (billed yearly) and adds the desktop application with advanced diagramming. Trials are available for both paid plans.
Microsoft Visio holds a 4.2/5 rating on G2 based on verified reviews.
Considerations
Before you commit to a VSM tool, run through these four criteria against your team's actual situation.
Does it match your primary use case: Diagramming or analytics?
Most tools on this list are diagramming tools with VSM templates (Lucidchart, Miro, Visio). One is a purpose-built VSM analytics platform (eVSM). Two are free frameworks with no drawing capability at all (DORA, MinimumCD). Know which problem you're solving: If you need automated cycle time calculations and improvement tracking, eVSM is the only purpose-built option here. If you need a shared visual canvas for alignment, the diagramming tools serve better.
How will the map be maintained as the product changes?
Maps decay fast. Delivery processes change with every sprint. Before selecting a tool, ask who owns the map after the workshop and how long a recapture takes. Simpler tools with fewer steps are easier to maintain. A 20-screen Miro board is harder to update than a three-step Jira workflow view. Factor in your team's release cadence - the faster you ship, the more important low-maintenance mapping becomes.
Does it integrate with your existing delivery stack?
For PMs, the most useful VSM data connects to where work actually happens - Jira tickets, Confluence docs, sprint data. Tools that integrate into that stack (Atlassian, Lucidchart, Miro) keep the map close to the work. Standalone tools require manual data entry to stay current. Check which integrations matter most for your workflow before signing up for a trial.
What's the total cost of cross-functional adoption?
A tool that only the PM uses doesn't surface cross-functional bottlenecks. Evaluate per-seat pricing against the number of people who need to contribute to the map - engineers, designers, QA leads, and operations. Free tiers (Miro, Atlassian, DORA) lower the adoption barrier significantly. Per-seat pricing at $8 to $20 per month across 10 contributors adds up to $80 to $200 per month before enterprise discounts.
Is the tool appropriate for your organization's security and compliance requirements?
Enterprise teams often face restrictions on where process documentation can live and who can access it. Microsoft Visio's M365 integration inherits existing governance controls. Miro and Lucidchart offer enterprise tiers with SSO and data residency options. Confirm that the tool meets your organization's data handling requirements before running a workshop with sensitive process data.
Conclusion
The right value stream mapping tool depends on two factors: Whether you need drawing capability, analytical capability, or both, and how much cross-functional adoption you need to make the map useful beyond a one-time workshop.
For formal lean programs with mixed-model flows and automated analysis, eVSM is the specialist choice. For collaborative workshop-first mapping, Miro gets teams onto a shared canvas fastest. For teams already in Jira, Atlassian provides flow instrumentation without a separate tool. Lucidchart sits in the middle: More structured than Miro, more collaborative than Visio, and usable across the full range of VSM use cases. DORA and MinimumCD are free resources worth using regardless of which drawing tool you pick - they define what good software delivery performance looks like so your VSM exercise has a measurable target.
Start with a current-state workshop, pick the tool that fits your team's collaboration style and stack, and use DORA metrics to define what success looks like before you rebuild the map.
Start your journey with Guideflow today!
FAQs
Value stream mapping software is a category of tools that helps teams document and analyze the end-to-end flow of work, from initial request to delivery, by mapping each step, wait time, and handoff. It originated in lean manufacturing and has been adopted widely in software delivery for identifying bottlenecks in product and engineering workflows. Some tools are purpose-built for VSM with automated analytics, while others are general diagramming platforms with VSM templates.
For most product and engineering teams, the highest-value features are a standard VSM symbol library, fields for cycle time and lead time at each step, real-time collaboration so multiple stakeholders can contribute, and export or sharing options for stakeholder reviews. Teams running formal improvement programs also benefit from current-state and future-state templates, and kaizen annotation support. Automated analytics (cycle time calculations, efficiency ratios) matter more for lean operations teams than for PM-led workshop use.
Yes, directly. Software delivery has a clear value stream: Feature request, backlog, development, review, testing, deployment, and monitoring. Each step has measurable cycle time and can accumulate wait time. The DORA research program frames software delivery performance around four metrics - deployment frequency, lead time for changes, change failure rate, and time to restore - which map cleanly onto what a VSM exercise surfaces. A 2023 Broadcom/Dimensional Research survey of 500 leaders found 60% expected to use VSM to deliver products that year.
PMs most often use VSM tools in three ways: To facilitate a current-state workshop that produces shared agreement on where delays live, to create a documented baseline before a delivery improvement initiative, and to present process tradeoffs to engineering leadership or stakeholders. The map itself is less important than the conversation it forces. PMs who instrument flow metrics in Jira and connect them to a visual VSM canvas in Miro or Lucidchart get both the alignment artifact and the ongoing measurement layer.
A workflow diagram shows the sequence of steps in a process. A value stream map adds the quantitative layer: Cycle time, wait time, inventory (work in queue), and percent complete and accurate at each step. The goal of a workflow diagram is documentation; the goal of a value stream map is identifying waste and prioritizing improvement. In practice, many teams start with a workflow diagram and add VSM metrics to it, which is a reasonable approach when the team is new to lean methods.
Ownership depends on the scope of the value stream being mapped. For software delivery, a PM or engineering manager typically facilitates the mapping exercise with contributions from engineering, design, QA, and operations. For cross-functional or organization-wide value streams, a dedicated lean or DevOps practice lead often owns the process. The key is that no single team owns the whole value stream - the map only reflects reality when everyone who touches the flow contributes to it.
Check four things before committing. First, does the tool match your primary need: Visual collaboration, automated analytics, or delivery instrumentation? Second, what is the per-seat cost across all the people who need to contribute - not just the PM who runs the workshop? Third, does it integrate with the tools where your delivery data already lives, such as Jira or Confluence? Fourth, how much effort does it take to update the map when the process changes? A tool that takes 30 minutes to recapture after a sprint retrospective will stay current; one that requires a full workshop to update will go stale.
In a SaaS context, VSM software is most commonly used to map the software delivery pipeline from idea to production, to surface where engineering handoffs create queue time, and to align product and engineering on improvement priorities. Teams also use it to document onboarding flows, support escalation paths, and customer journey stages where internal delays affect time-to-value. The output is usually a current-state map used in retrospectives or quarterly planning to justify prioritization decisions.