

It's Thursday. Your forecast call is tomorrow. And you're rebuilding the same pipeline view you built last week, this time in a spreadsheet, because the CRM report doesn't match what your manager pulled from the BI tool.
That gap is the whole problem. Your numbers live in five places, and none of them agree.
Most reps blame the data. Bad CRM hygiene, they say. Missing fields. But the real issue is that pipeline, quota, rep performance, and forecast health rarely sit in one view you can trust on demand. You spend the hour before the forecast call reconstructing what happened instead of deciding what to do next.
The dashboard adoption curve tells you this is now standard practice, not a nice-to-have. Enterprise dashboard adoption climbed from 52% in 2020 to 67% in 2023, according to Gitnux (2026). The global dashboard software market sits at US$7.88B in 2026 and is projected to reach US$13.41B by 2030, per The Business Research Company (2026). The teams that win forecast calls stopped arguing about numbers and picked one source of truth.
What's inside
This guide is for account executives, sales managers, RevOps, and founders who need one clear view of pipeline and forecast instead of five conflicting ones.
We selected seven tools and ranked them by how well they serve revenue teams, not just data teams. Each pick was evaluated on:
- CRM and data source integrations so your numbers come from the system of record
- Refresh speed for real-time or near-real-time views before forecast calls
- Forecast usefulness so the dashboard drives decisions, not just charts
- Sharing and visibility across the team, from browser to Slack to TV
- Ease of adoption because reps will not fight a tool to log a deal
TL;DR
- Best for CRM-native revenue teams: Salesloft, if your forecasting and coaching already live inside the sales engagement layer.
- Best for TV-style, shareable dashboards: Geckoboard, for live KPIs on a screen the whole floor can see.
- Best for a fuller analytics layer: Zoho Analytics, when you want AI-assisted insights across many data sources.
- Best for BI-heavy teams: Tableau or Power BI, when you have a data team and want custom analytics.
- Best for governed, warehouse-centric reporting: Looker, when analytics are shared across departments with one modeling layer.
- Best for small teams that want speed over depth: SimplyDepo, for straightforward operational reporting without a data specialist.
What sales dashboard software is
Sales dashboard software is a tool that pulls sales data from your CRM and connected systems into a single, visual view of pipeline, quota, rep performance, and forecast health that updates automatically.
That definition sounds simple. The distinction that matters is what the software is not.
A CRM report answers a fixed question inside the CRM. A BI tool models data across the whole business. A forecasting tool projects future revenue from current pipeline. Sales dashboard software sits in the middle: it aggregates sources, visualizes KPIs, and refreshes on a schedule so the whole team reads the same numbers.
Here is what separates real sales dashboard software from a static report:
- CRM connectors that pull from Salesforce, HubSpot, and your other systems of record
- Custom KPI widgets for pipeline coverage, win rate, cycle length, and quota attainment
- Real-time or scheduled refresh so the view is current when you need it
- Forecast views that turn pipeline into a projection you can defend
- Alerts and sharing so deal changes reach the right person fast
- Team and rep performance reporting for coaching and accountability
The strongest sales analytics software does one more thing: it makes the dashboard useful in a forecast call, not just pretty on a wall. That means the view answers "what changed, what's at risk, and what do I do next" without a manual rebuild. A sales performance dashboard that only shows history is a report. One that surfaces deal risk and next steps is a decision tool.
Cloud deployment is now the default. Mordor Intelligence (2026) reports that 72.6% of the sales software market is already cloud-deployed, which is why most modern KPI dashboard tools connect to your stack without an on-premise install.
When to use sales dashboard software
Track quota and pipeline health
You need a dashboard the moment weekly pipeline reviews turn into data reconciliation sessions. When three people show up with three different pipeline numbers, the review stops being about deals and starts being about whose spreadsheet is right. A shared sales performance dashboard ends that argument. It gives the team one pipeline coverage number, one win rate, and one forecast to work from before the call starts.
Replace spreadsheet reporting
Manual reporting works until it doesn't. The break point is usually the same: a rep spends two hours every Friday exporting CRM data into a sheet, and by Monday the numbers are stale. Worse, nobody fully trusts them because the formulas drifted three quarters ago. Sales reporting software removes the export step. The dashboard reads from the CRM directly, so the numbers are current and the logic is visible to everyone.
Share performance views across the team
Visibility drives accountability. When a rep can see where they rank on the team performance dashboard, and a manager can see which deals slipped, coaching gets specific instead of general. A shared view also makes forecast calls faster because everyone walks in already looking at the same real-time sales dashboard. No screen-sharing scramble, no "let me pull that up."
Comparison table
Here is the shortlist at a glance. Pricing and ratings reflect verified, current values where each vendor publishes them. Where a vendor routes pricing through sales, the table notes that rather than guessing.
| # | Product | Best for | Key differentiator | Pricing | G2 rating |
|---|---|---|---|---|---|
| 1 | Zoho Analytics | Fuller analytics layer with AI insights | 500+ data connectors and Ask Zia AI | Free tier, paid plans quoted | 4.2/5 |
| 2 | Geckoboard | TV-style, shareable KPI dashboards | Live dashboards on screens, Slack, and TV | From $79/month billed annually | 4.3/5 |
| 3 | Salesloft | CRM-native revenue teams | Forecasting inside the sales engagement layer | Custom pricing | 4.5/5 |
| 4 | SimplyDepo | Small field and retail-style teams | Operational reporting and ordering in one system | Free trial, plans quoted | 4.7/5 |
| 5 | Tableau | BI-heavy teams with data resources | Visual analytics and governed self-service | From $15/user/month | 4.4/5 |
| 6 | Power BI | Microsoft-native organizations | Native fit with the Microsoft stack | Free tier, Pro from $14/user/month | 4.5/5 |
| 7 | Looker | Governed, warehouse-centric reporting | Semantic modeling layer with LookML | Custom pricing | 4.4/5 |
1. Zoho Analytics
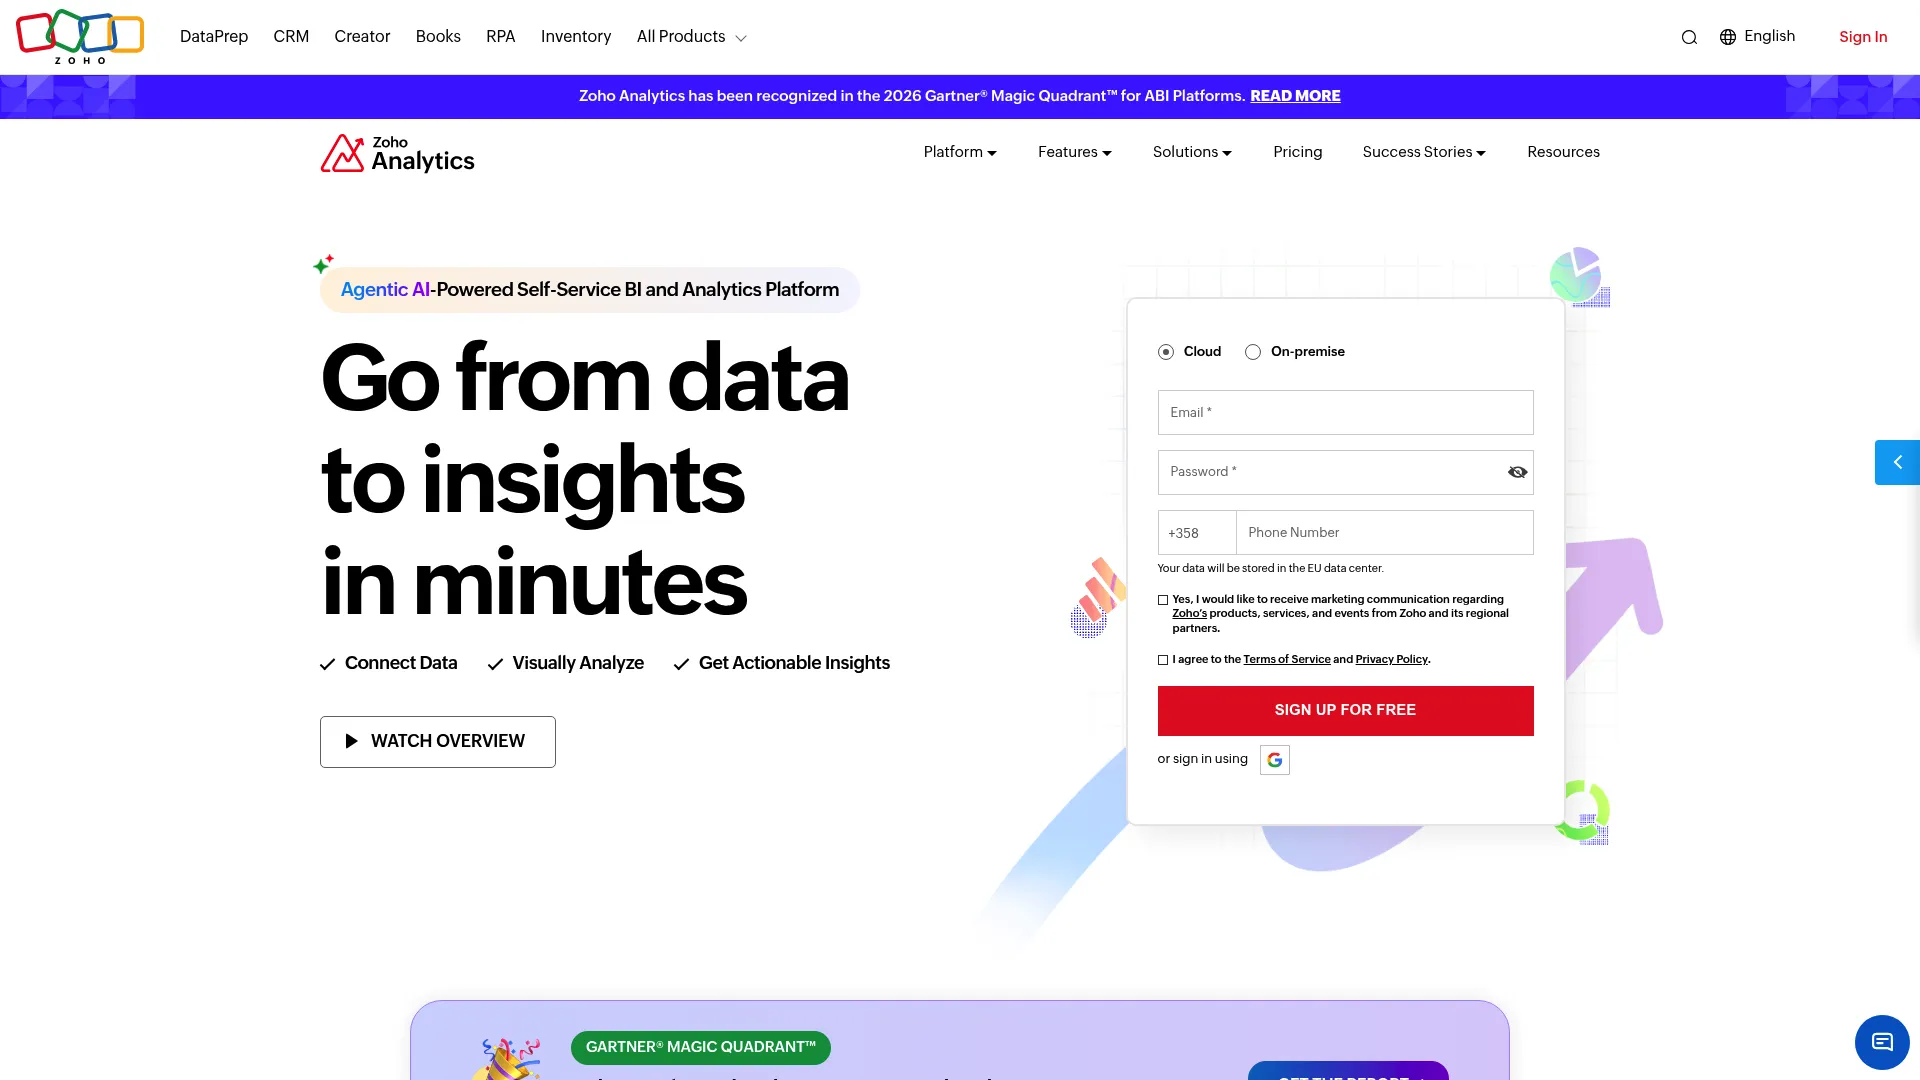
Zoho Analytics is an AI-powered self-service BI and analytics platform that sits a layer above simple CRM reporting. It pulls sales data from a wide range of sources, blends it, and turns it into dashboards you can build without a data team. For revenue teams that already use Zoho or want broad connectors, it gives you a fuller sales analytics dashboard than most native CRM reports.
The draw here is breadth. You get pipeline reporting, forecast views, and rep performance analysis in one place, plus an AI assistant that answers plain-language questions about your data.
Best for: Teams that want a Zoho-native BI tool with broad connectors and self-service analytics without hiring a specialist.
Key strengths
- Connect and blend data from 500+ sources
- Prepare data with pipelines and 250+ transforms
- Visualize data with 50+ visualizations and Ask Zia
- Dashboard templates for sales performance analysis
- AI-assisted insights for non-technical users
Why choose Zoho Analytics: It fits teams that have outgrown CRM reports but do not want the weight of a full enterprise BI rollout. The trade-off is that it works best when you commit to it as your analytics layer rather than a quick dashboard bolt-on.
Zoho Analytics pricing: There is an Always Free plan. Paid tiers are Basic, Standard, Premium, and Enterprise, billed monthly or yearly, with pricing quoted on the pricing page. A free tier is available to start.
2. Geckoboard
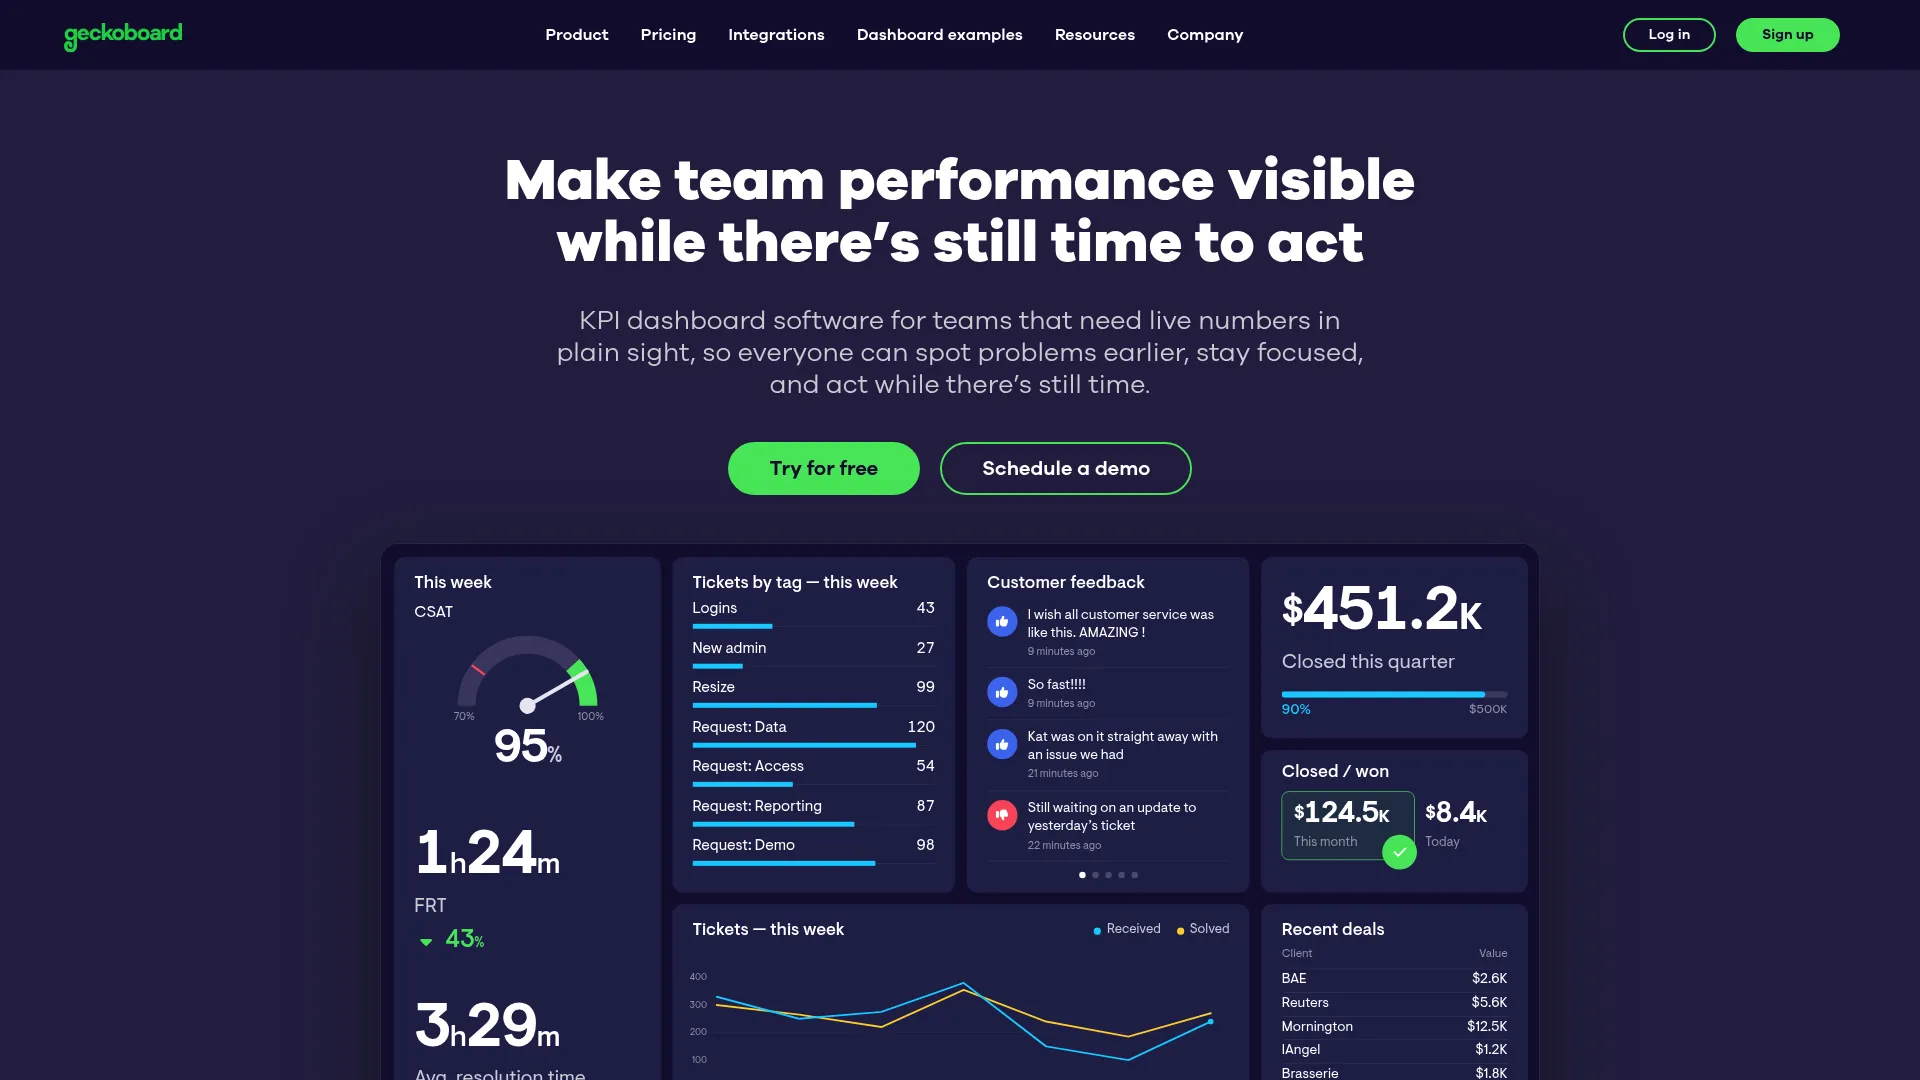
Geckoboard is a real-time dashboard platform built for teams that want live metrics on a screen, not a report buried in a folder. It connects to your sales tools and puts KPIs on a TV, in Slack, or on a shared link so the whole floor sees the same numbers. If you want fast visibility without a data specialist, this is the lightweight pick.
The strength is simplicity and sharing. You build a clean sales dashboard, push it to a screen, and it stays live. No login scramble before standup, no stale export.
Best for: Teams that need live KPI dashboards on screens and shared across the organization for daily accountability.
Key strengths
- Real-time dashboards that update automatically
- 90+ integrations with common sales tools
- Sharing via TV, Slack, email, mobile, and live links
- Clean visual design for at-a-glance reading
- Fast setup without a data team
Why choose Geckoboard: It is the right call when day-to-day visibility matters more than deep analysis. The trade-off is depth: it is a monitoring tool, so teams needing complex modeling will pair it with a heavier analytics platform.
Geckoboard pricing: Essentials starts at $79/month billed annually. Performance is $319/month billed annually. Enterprise is custom pricing. A 14-day free trial is available.
3. Salesloft
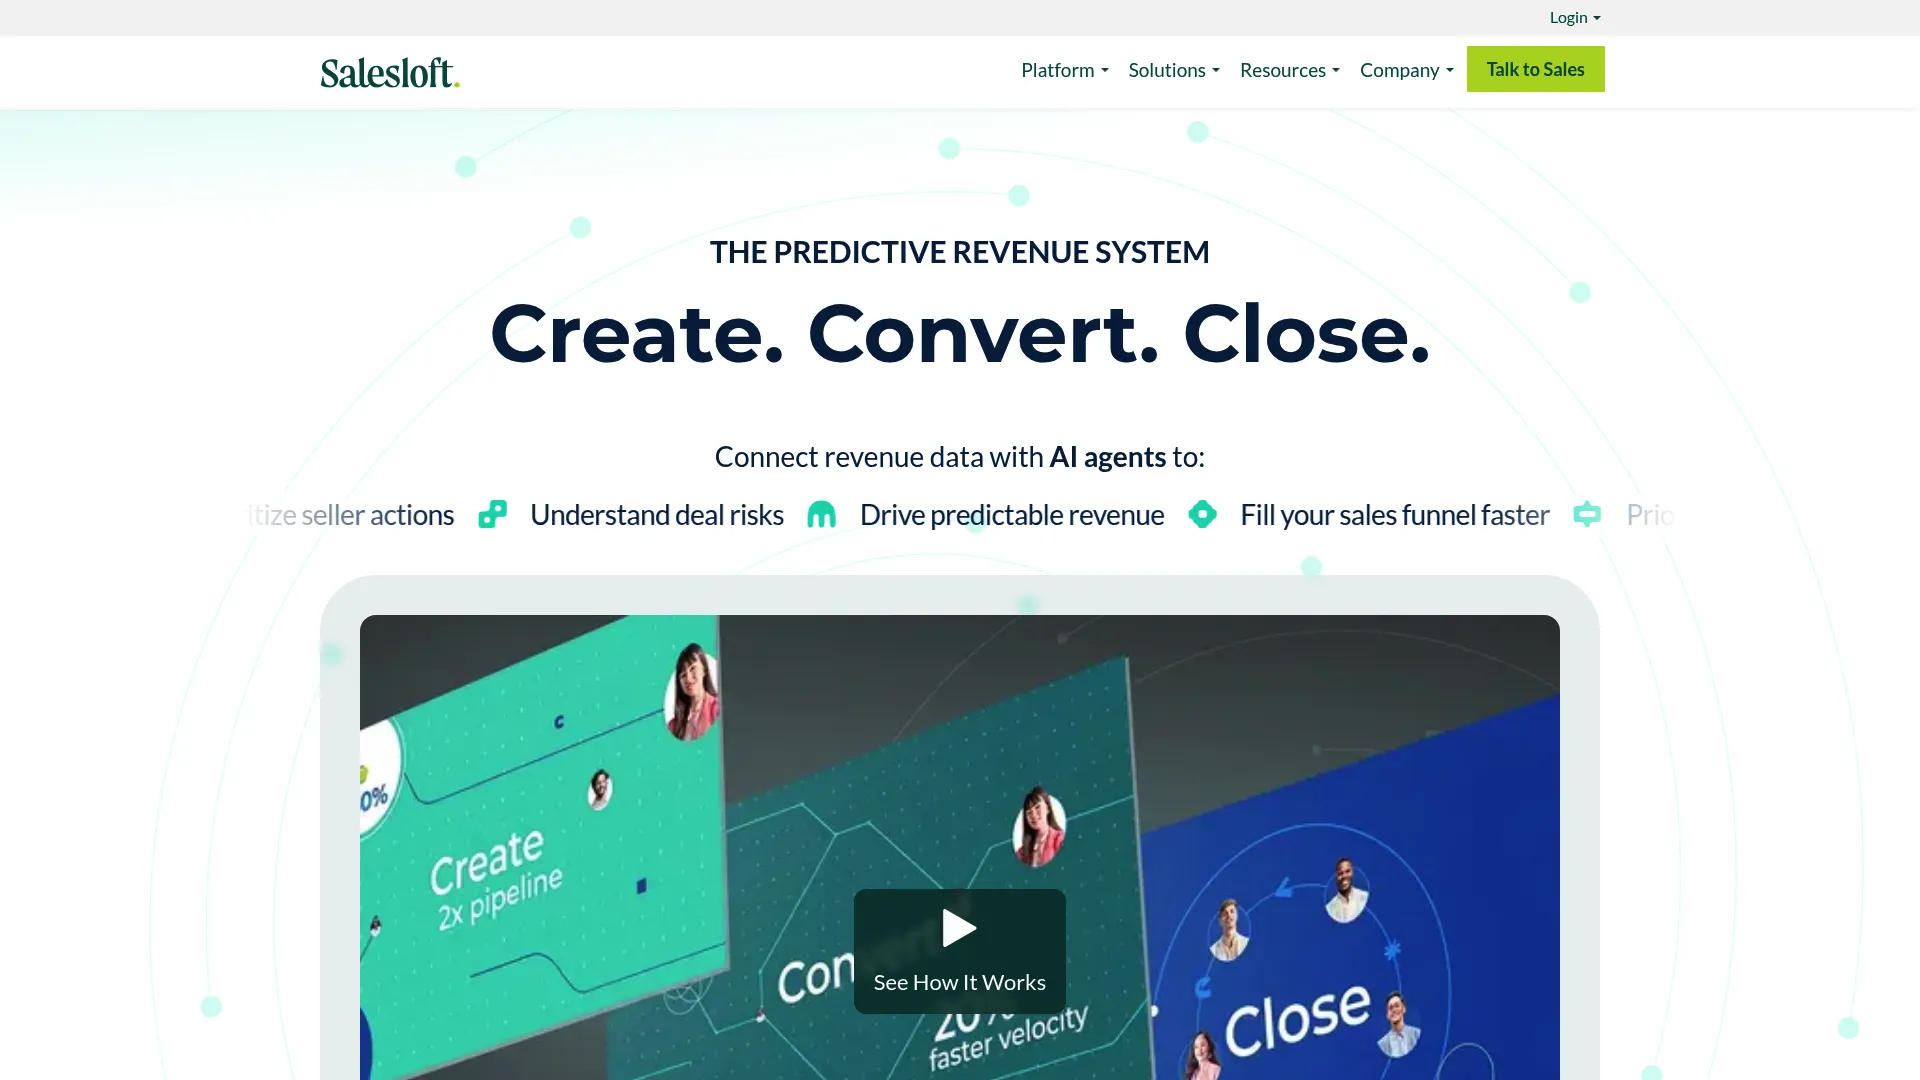
Salesloft is a revenue orchestration platform that folds forecasting, pipeline management, and conversation intelligence into the same place your reps already run outbound. For AEs and managers, that means the sales manager dashboard sits next to the workflow, so forecast views and deal risk are not a separate tool you open once a week.
This is the pick for teams that want coaching and forecast visibility inside their sales engagement layer rather than in a standalone BI tool. Deal risk, funnel conversion, and rep activity all read from the same system.
Best for: B2B revenue teams that want one platform for outbound execution, coaching, and forecasting.
Key strengths
- AI-prioritized seller workflow (Rhythm)
- Conversation intelligence with transcription, summaries, and scorecards
- Forecasting and deal/pipeline management
- Funnel visibility and deal risk signals
- Coaching views for managers
Why choose Salesloft: It is strongest when your team already lives in the platform and wants forecasting tied to real activity signals. The trade-off is scope: it is a revenue platform, not a general BI tool, so cross-department reporting is not its job.
Salesloft pricing: Salesloft uses custom pricing and routes prospects to a demo or quote rather than publishing public figures.
4. SimplyDepo
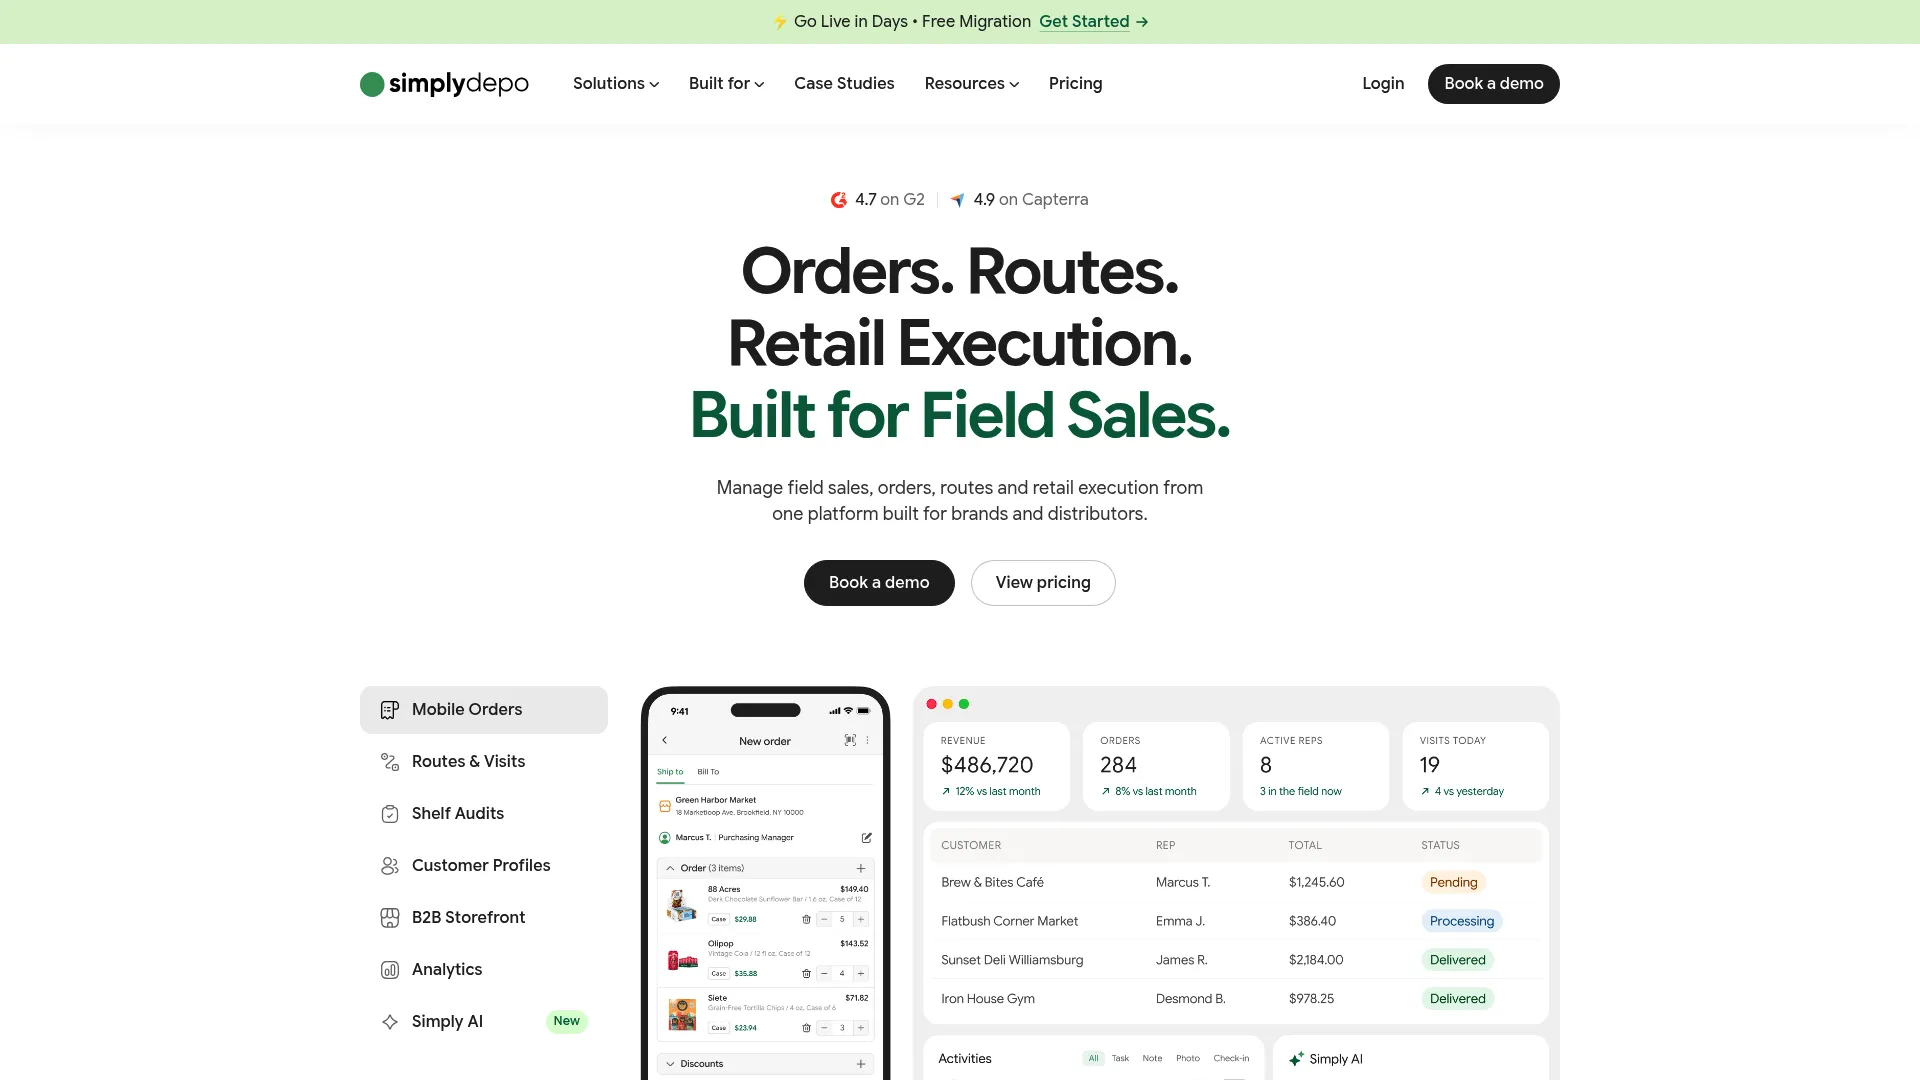
SimplyDepo is a B2B wholesale and retail execution platform with dashboarding aimed at smaller sales and field teams. It combines CRM, order management, and reporting so operational KPIs and sales activity live in one system. For teams that need a practical sales dashboard without heavy analytics complexity, it keeps setup light.
The appeal is speed and fit. If your team runs field sales or retail-style ordering, the reporting tracks the metrics that actually move the business, orders, visits, and routes, rather than abstract BI charts.
Best for: CPG brands and distributors needing field sales, ordering, and retail execution reporting in one system.
Key strengths
- Customer management (CRM)
- Order management with drafts, invoicing, and returns
- Route optimization and visit scheduling
- Automated operational reporting
- Quick setup without a data specialist
Why choose SimplyDepo: It fits teams that want a simple, operational dashboard tied to real selling activity, not a general-purpose analytics platform. The trade-off is focus: it is built for wholesale and field execution, so it suits that motion best.
SimplyDepo pricing: SimplyDepo offers a 30-day free trial and describes a Core Plan plus optional add-ons, with plan pricing handled through sales. A free trial is available to start.
5. Tableau
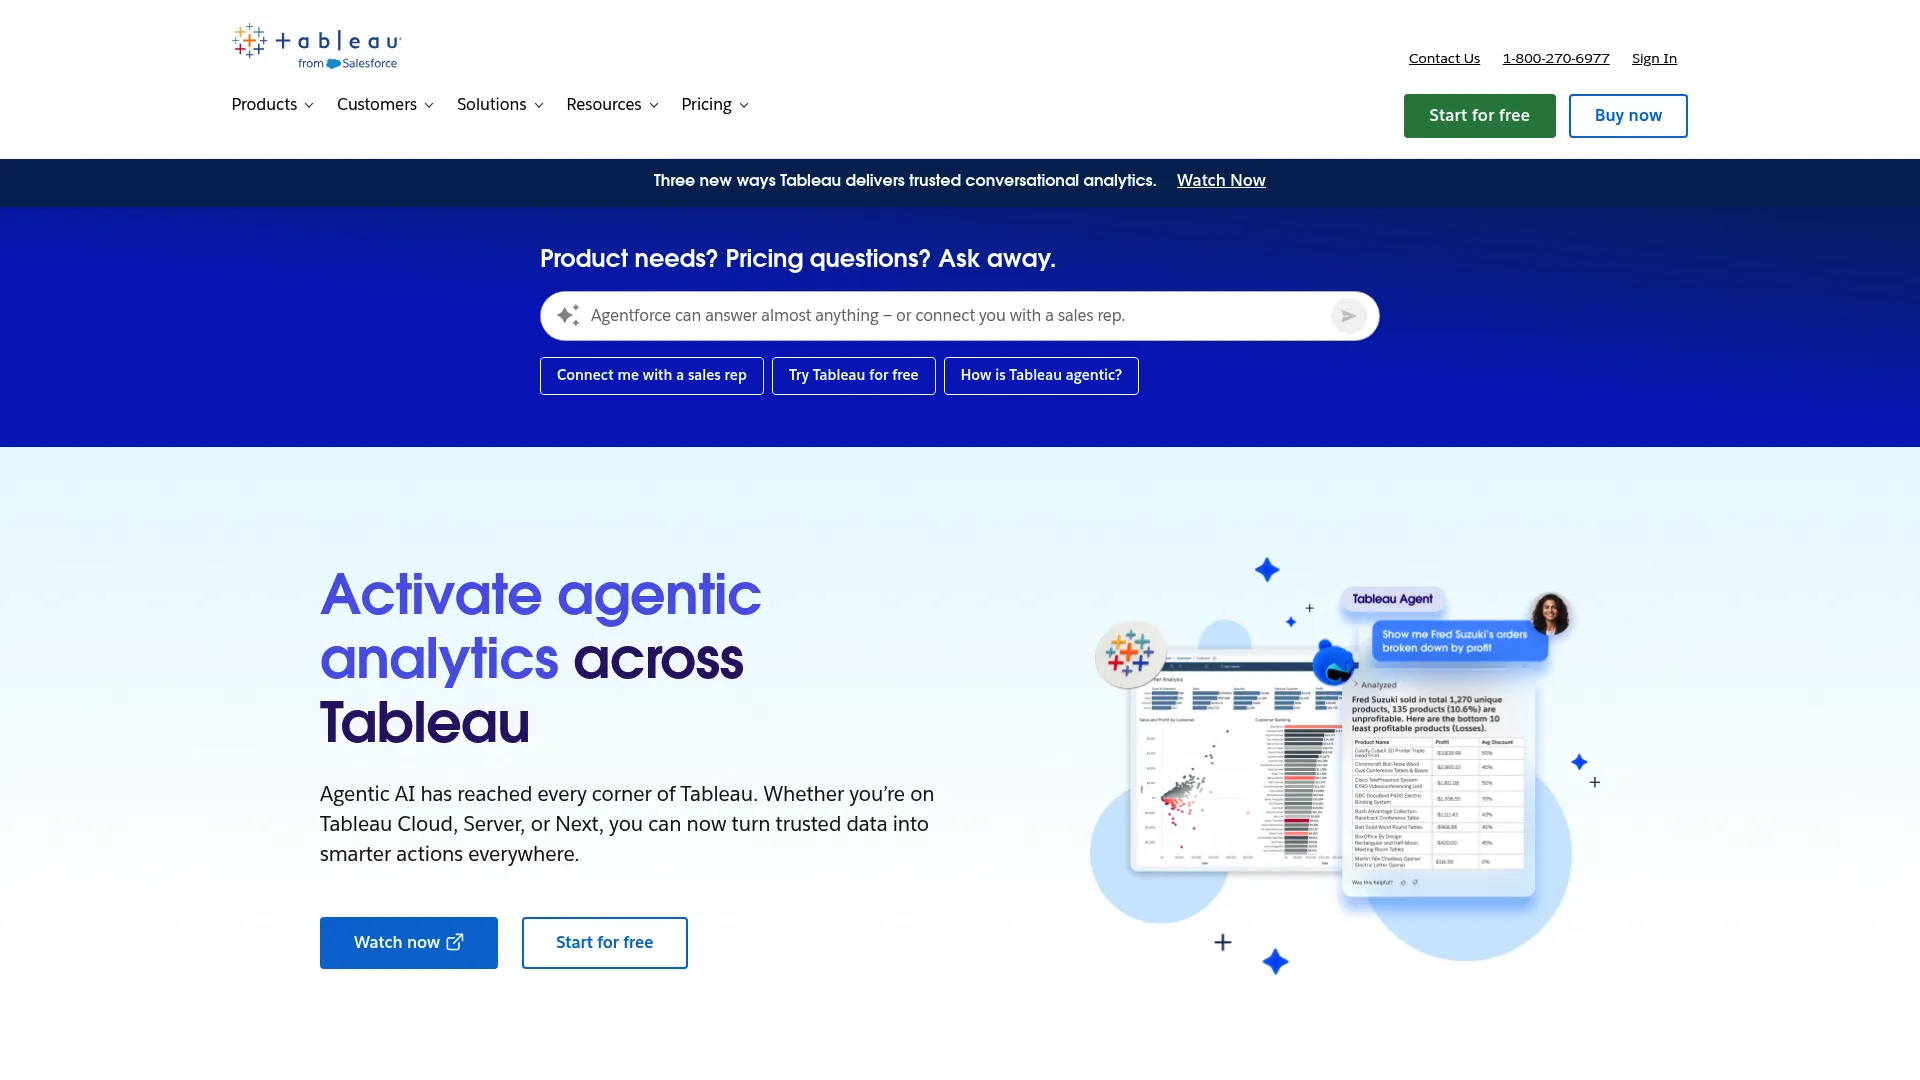
Tableau is an AI-powered analytics platform for visualizing, analyzing, and sharing trusted data. It is the pick when a sales team has data resources and wants custom analytics beyond prebuilt sales reporting. Tableau handles deep analysis and governed self-service, so you can build almost any sales analytics dashboard you can define.
The strength is flexibility. If your questions go past what a native CRM report or lightweight dashboard can answer, Tableau gives you the visualization depth to model them. The trade-off is implementation effort, so it rewards teams with someone to own the build.
Best for: Teams that need visual analytics, governed BI, and scalable self-service dashboards.
Key strengths
- Cloud, Server, and Next product options
- Data connections, prep, and modeling
- Dashboards, metrics, and agentic analytics
- Deep visualization for custom analysis
- Governed self-service for larger teams
Why choose Tableau: It is the right call when prebuilt sales reporting cannot answer your questions and you have the resource to build custom views. The trade-off is that it rewards teams ready to invest in setup.
Tableau pricing: Tableau Standard starts at $15 USD/user/month billed annually. Tableau Enterprise is $35 USD/user/month billed annually. Tableau Next is $40 USD/user/month billed annually. Cloud+ and the Tableau+ Bundle require contacting Sales. A Tableau Desktop Free Edition is available.
6. Power BI
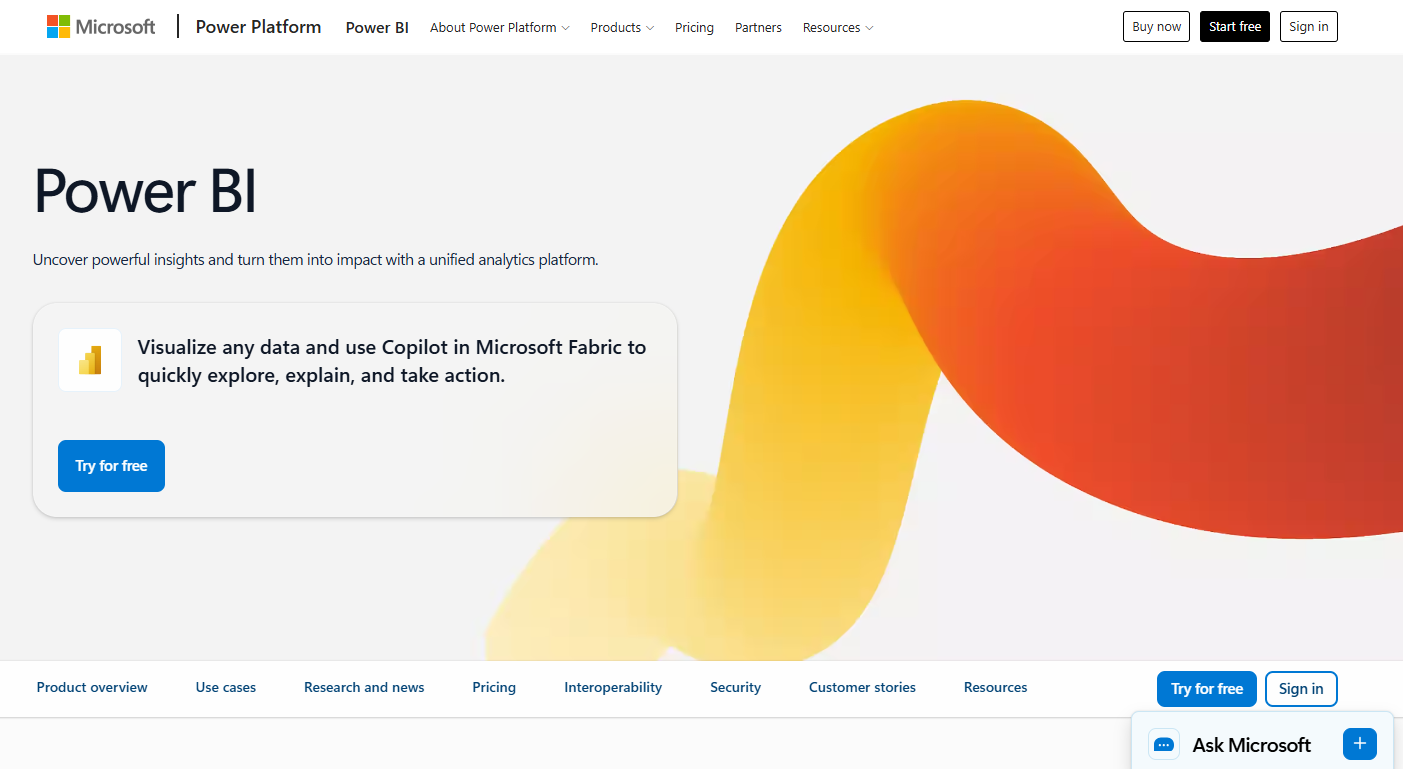
Power BI is Microsoft's business analytics platform for interactive reports, dashboards, and AI-assisted insights. If your organization already runs on Microsoft, it fits the stack cleanly, from Excel to Teams to your data sources. That native fit is the main reason teams pick it as their sales reporting software.
The strength is flexibility with governance at scale. You get self-service reporting for analysts plus the controls a larger organization needs, and Copilot adds plain-language exploration on top.
Best for: Teams that need Microsoft-native BI for self-service reporting and sharing across the organization.
Key strengths
- Interactive reports and visual analytics
- Publish and share reports
- Copilot-powered exploration, summaries, and report creation
- Native fit with Excel, Teams, and the Microsoft stack
- Governance controls for scaling teams
Why choose Power BI: It suits organizations that want a scalable analytics layer without leaving the Microsoft ecosystem. The trade-off is that its value compounds when you are already invested in Microsoft tools.
Power BI pricing: There is a free account. Power BI Pro is USD$14.00 per user/month, paid yearly. Power BI Premium Per User is USD$24.00 per user/month, paid yearly. Power BI Embedded pricing is variable and handled through sales.
7. Looker
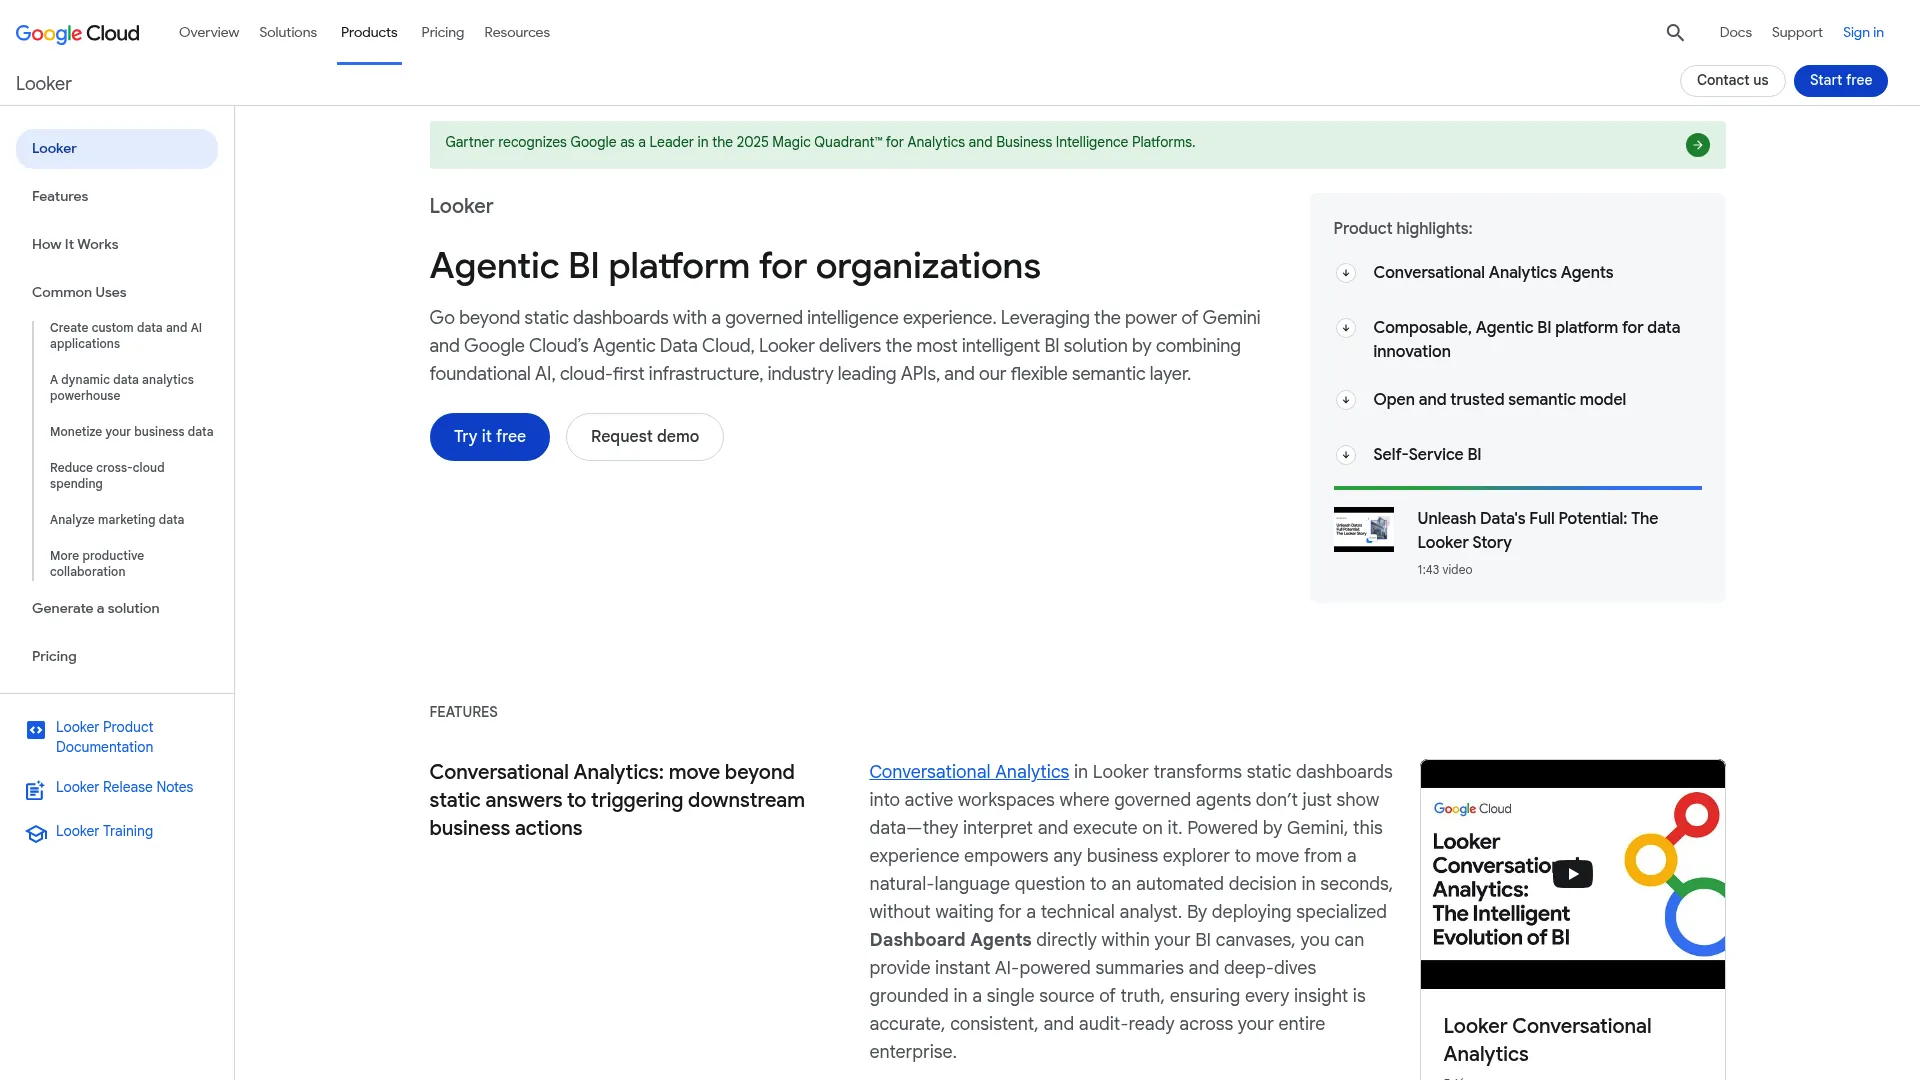
Looker is Google Cloud's BI platform for governed analytics, semantic modeling, and embedded data applications. It is the fit when a team has stronger data maturity and needs centralized reporting logic shared across departments. The LookML semantic layer defines metrics once, so sales, finance, and ops all read the same definition of a "closed-won deal."
The strength is consistency. When multiple teams query the same warehouse, Looker keeps the logic centralized, so your sales analytics platform does not drift from finance's version of the numbers.
Best for: Teams needing governed BI with a semantic layer and embedded analytics across departments.
Key strengths
- Conversational Analytics powered by Gemini
- Universal semantic layer / LookML modeling
- Embedded analytics and APIs
- Centralized metric definitions across teams
- Warehouse-centric governed reporting
Why choose Looker: It is the better fit when analytics are shared across departments and metric consistency matters more than quick standalone setup. The trade-off is that it rewards teams with data maturity and a warehouse in place.
Looker pricing: Looker offers Standard, Enterprise, and Embed editions on annual commitments, with pricing handled through sales. Each platform includes 10 standard users and 2 developer users, with one-, two-, and three-year terms available.
Considerations
Data sources and integration depth
Start with the systems your dashboard must pull from. If your pipeline lives in Salesforce or HubSpot, confirm the connector is native and current, not a manual export. A dashboard is only as trustworthy as its weakest data source, so check that every system you forecast from is covered before you buy.
Refresh speed and alerts
Ask how often the data refreshes and whether you can set alerts on deal changes. For a forecast call, a view that updated last night is different from one that updated an hour ago. Real-time or near-real-time refresh matters most when late-stage deals move fast and you need to know before your manager does.
Ease of adoption
Reps will not fight a tool. If the dashboard needs a data analyst to change a view, the team will drift back to spreadsheets. Judge how much training the tool realistically demands and whether a manager can build a new view without filing a ticket.
Sharing and visibility
Decide where the dashboard needs to live. On a TV for the floor, in Slack for async updates, in the browser for forecast calls, or embedded in the CRM. The right answer depends on how your team already works, so match the sharing model to the workflow rather than the other way around.
Budget and hidden costs
Watch for per-seat pricing that scales aggressively, advanced refresh tiers, and implementation overhead. The sticker price is rarely the full cost. Add up seats, add-ons, and the time it takes to get the first useful dashboard live before you compare tools on price alone.
Conclusion
The right sales dashboard software depends on how your team works today, not on which tool has the longest feature list.
If your forecasting and coaching already live in your sales engagement layer, Salesloft keeps everything in one place. If you want live KPIs on a screen the whole floor can see, Geckoboard is the fastest path to shared visibility. For a fuller analytics layer without a data team, Zoho Analytics gives you AI-assisted insights across many sources. When you have data resources and want custom analytics, Tableau or Power BI give you the depth, with Power BI winning on Microsoft-native fit. For governed reporting shared across departments, Looker centralizes the logic. And for small field or retail teams that want speed over depth, SimplyDepo keeps reporting operational and simple.
Pick based on your bottleneck. If forecast calls are the pain, prioritize forecast views and refresh speed. If reconciliation is the pain, prioritize CRM integration depth. Then run a trial with your real pipeline data before you commit.
Start your journey with Guideflow today!
FAQs
Sales dashboard software pulls data from your CRM and connected systems into a single visual view of pipeline, quota, rep performance, and forecast health. It updates automatically so the whole team reads the same numbers. The goal is one source of truth instead of five conflicting spreadsheets.
At minimum, it should show pipeline coverage, win rate, sales cycle length, quota attainment, and a forecast view. The best dashboards also surface deal risk and next steps, not just history. If a view cannot help you decide what to do before a forecast call, it is a report, not a decision tool.
A CRM report answers a fixed question inside the CRM, using only CRM data. Sales dashboard software aggregates multiple sources, visualizes KPIs across them, and refreshes on a schedule for shared viewing. In short, CRM reports are single-source and static; dashboards are multi-source and live.
If your team already runs in a sales engagement platform, Salesloft ties forecasting to real activity signals in one place. For teams that want a dedicated analytics layer, Zoho Analytics, Tableau, and Power BI all support forecast views. Prioritize refresh speed and how well the forecast reflects current pipeline.
Usually not at first. A small team is often better served by a lightweight real-time dashboard like Geckoboard or an operational tool like SimplyDepo. Move to full BI such as Tableau, Power BI, or Looker when your questions outgrow prebuilt reporting and you have someone to own the build.
For weekly pipeline reviews, a daily refresh is usually enough. For fast-moving late-stage deals and live forecast calls, near-real-time refresh matters because a view from last night can miss a deal that just changed. Match the refresh cadence to how fast your deals move.
Pipeline coverage, win rate, sales cycle length, average deal size, quota attainment, and forecast accuracy carry the most weight for revenue teams. Rep-level performance and stage conversion help with coaching. Keep the dashboard focused on metrics that drive a decision, not every number you can pull.
Start with your bottleneck. If forecast calls hurt, prioritize forecast views and refresh speed; if reconciliation hurts, prioritize CRM integration depth. Then weigh ease of adoption, since reps abandon tools that need an analyst to change a view. Run a trial with your real pipeline data before committing.