A query that ran in 200 milliseconds last quarter now takes eight seconds. Nothing in the code changed. The data grew, the execution plan went stale, and now a dashboard times out during a customer demo.
You know the drill. You open the query, stare at it, guess at an index, and rerun. Twenty minutes later you are still guessing.
That guessing is expensive. For presales and engineering teams, hours spent chasing a slow query are hours not spent on technical validation, benchmark runs, or the next deal. The global query performance optimization market was valued at $1.8 billion in 2024 and is forecast to reach $5.6 billion by 2033 at a 13.2% CAGR, according to MarketIntelo (2024). That growth tracks a simple reality: databases keep getting bigger, and slow SQL keeps costing money.
A good sql query optimization tool removes the guessing. It reads the execution plan, shows you where time actually goes, and points at the fix, whether that is an index, a rewrite, or a statistics update. The right sql optimizer turns a two-hour hunt into a ten-minute diagnosis.
This guide breaks down seven database optimization tools worth knowing in 2026, sorted by where they fit in a real tuning workflow.
What's inside
This guide is for engineers, DBAs, and presales teams who need to find slow SQL, read query plans, and validate that a fix actually worked. We chose tools based on four criteria that matter in a real tuning workflow:
- Database support: which engines each tool covers, from SQL Server to MySQL and PostgreSQL
- Execution plan analysis: how well it exposes costly operators and join choices
- Query rewriting and indexing: whether it suggests rewrites or index changes, manually or with AI
- Workload monitoring: whether it catches regressions and tracks performance over time
Each entry includes what the tool does best, key features, and pricing where a public price exists.
TL;DR
- Best for SQL Server teams: SQL Server ships native execution plans, Query Store, and tuning tooling with no extra purchase.
- Best for AI-assisted optimization: EverSQL rewrites queries and suggests indexes as an AI-first first pass.
- Best for MySQL: MySQL's own EXPLAIN, performance schema, and tooling handle plan and index inspection natively.
- Best for index recommendations: Database Engine Tuning Advisor analyzes a captured workload and recommends physical design changes.
- Best for reading plans deeply: Plan Explorer visualizes SQL Server execution plans and surfaces the costliest operators, free.
- Best for continuous monitoring: SQL Monitor tracks performance over time and alerts on regressions before they hit users.
What is query optimization software
Query optimization software is a category of database tooling that helps you find slow SQL queries, inspect their execution plans, rewrite the SQL, recommend indexes, and monitor workload performance over time.
The category spans a few overlapping jobs. Some tools are built into the database engine itself. Others are standalone analyzers or AI services that plug into your existing stack. A query optimizer sql engine, in the technical sense, is the component inside the database that decides how to run a query. The software in this guide helps you understand and influence what that optimizer does.
Core capabilities you will find across these tools:
- Execution plan analysis: read the query plan the engine chose, and see which operators cost the most
- Index suggestions: identify missing or redundant indexes based on the queries you actually run
- Rewrite assistance: flag inefficient SQL and suggest a faster equivalent, sometimes with AI
- Workload monitoring: capture what ran, how often, and how long it took, so you tune the right queries
- Database compatibility: support for SQL Server, MySQL, PostgreSQL, or a mix
The best sql performance optimization tools combine at least two of these. A monitor tells you what is slow. A plan analyzer tells you why. An indexing advisor or rewrite engine tells you what to change.
When to use query optimization software
Find why a query slowed down
A query that was fast last month and slow today usually has a plan problem. Statistics drift, data volume grows, and the query optimizer picks a worse execution plan. Query optimization software pulls the current plan, compares it against workload context, and shows you the operator eating your runtime. That turns "it feels slow" into "the hash join spills to disk on this predicate."
Rewrite SQL before it hits production
Some queries are slow because of how they were written, not how they were indexed. Correlated subqueries, functions on join columns, and SELECT-star patterns all defeat the optimizer. A rewrite workflow, whether manual or AI-assisted, catches these before deployment. You test the rewrite, confirm the plan improved, and ship a query that scales.
Tune indexes and validate the impact
Adding an index is a bet. The payoff is faster reads, and the cost is slower writes and more storage. Query optimization tools let you model the change, apply it, and compare before-and-after execution plans and timings. Indexing without that before-and-after check is how you end up with forty unused indexes slowing every insert.
Comparison table
Here is how the seven tools compare on fit, differentiator, price, and rating. Tools are sorted by relevance to a general query optimization workflow, not alphabetically.
| # | Product | Best for | Key differentiator | Pricing | G2 rating |
|---|---|---|---|---|---|
| 1 | SQL Server | SQL Server teams tuning natively | Built-in execution plans, Query Store, and tuning tooling | Free Developer and Express; Standard from $989 | 4.4/5 |
| 2 | EverSQL | AI-assisted query rewriting | Automatic SQL rewrite and indexing suggestions | Free entry point | Not listed |
| 3 | MySQL | MySQL optimization workflows | Native EXPLAIN, performance schema, and index tooling | Free Community; paid editions by quote | 4.4/5 |
| 4 | Database Engine Tuning Advisor | Index recommendations on SQL Server | Workload-based index and partition recommendations | Included with SQL Server | Not listed |
| 5 | SQL Profiler | Capturing what actually ran | Trace capture and replay for diagnosis | Included with SQL Server | 4.4/5 |
| 6 | Plan Explorer | Reading execution plans deeply | Free visual plan analysis with operator costing | 100% free | Not listed |
| 7 | SQL Monitor | Continuous monitoring and alerting | Real-time multi-platform monitoring and diagnostics | Standard $97 per server/month, billed annually | 4.5/5 |
Best query optimization software for 2026
1. SQL Server
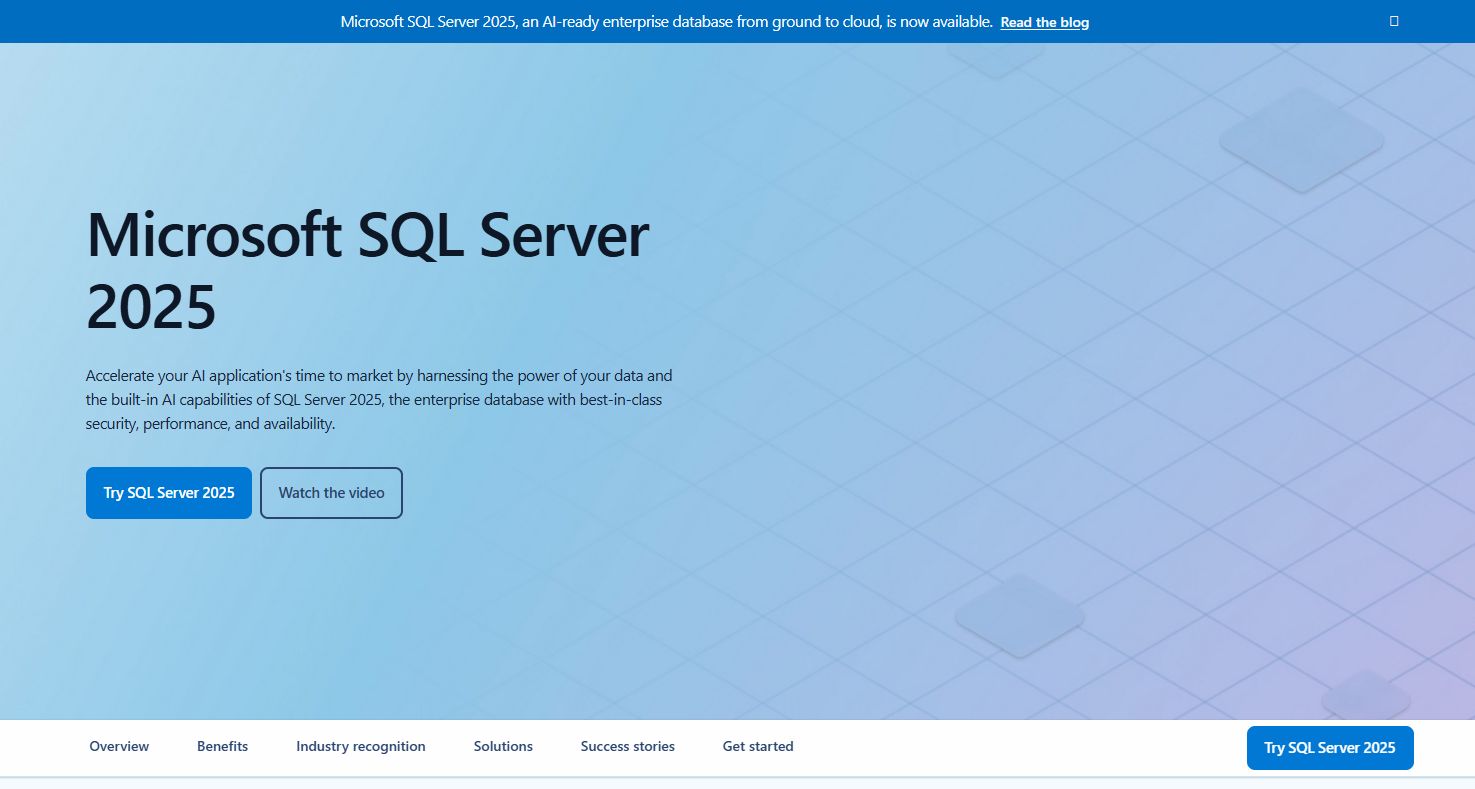
SQL Server is Microsoft's enterprise relational database platform, and it is also the native home for Microsoft SQL Server optimization work. Most of what you need to tune a query ships in the box. You get graphical and text execution plans, Query Store for tracking plan history and regressions, and built-in performance tooling that surfaces expensive queries without a third-party purchase.
For teams already running SQL Server, this is the starting point. You capture a query plan directly in SQL Server Management Studio, spot the costly operator, and act. Query Store adds a time dimension: it records which plans ran when, so you can force a known-good plan after a regression. That is sql server optimization without leaving the platform.
Best for: Teams running Microsoft SQL Server that want to tune queries with native, built-in tooling.
Key features
- Graphical and text execution plan viewing
- Query Store for plan history and regression tracking
- Built-in AI capabilities in the 2025 release
- Developer-friendly features: JSON, REST, regex, event streaming
- Security and performance controls at the engine level
Why choose SQL Server: If your workload already lives here, the optimization tooling costs nothing extra and integrates with everything downstream. It is the default first stop for any SQL Server tuning task.
SQL Server pricing: Developer and Express editions are free. Standard starts at $989 per server on open no-level pricing, or $3,945 per two-core pack. Enterprise is $15,123 per two-core pack.
2. EverSQL
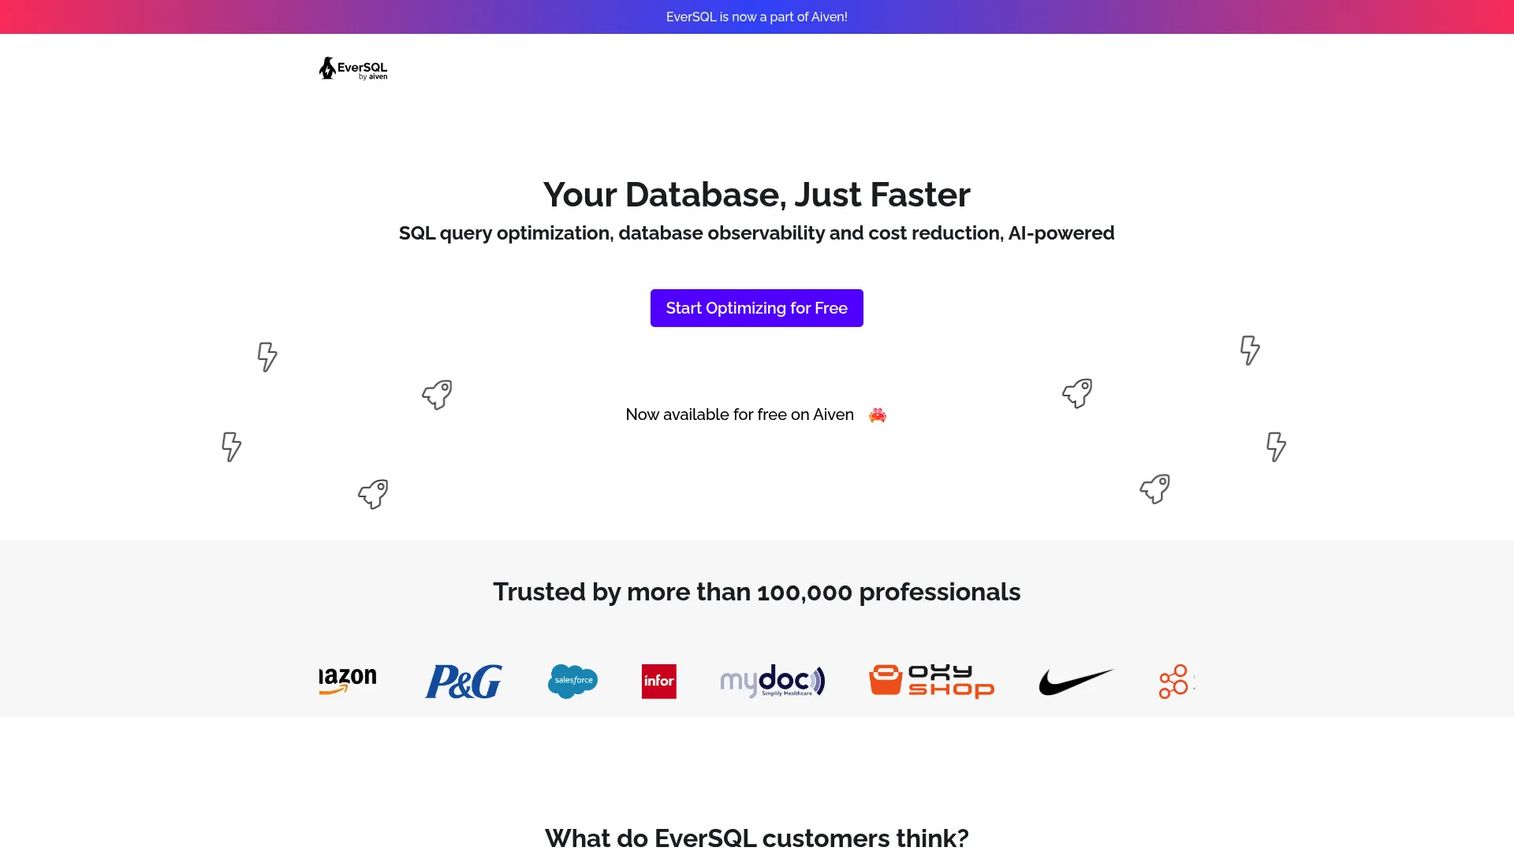
EverSQL is an AI SQL optimizer built for PostgreSQL and MySQL. Paste a slow query, and it rewrites the SQL and suggests indexes automatically. That AI-first, first-pass workflow makes it a fast way to get a candidate fix before you dig into the plan yourself. It also runs ongoing performance insights through a sensor and flags cost-reduction opportunities, such as redundant indexes you can drop.
The value here is speed to a hypothesis. Instead of reading the plan cold, you get an AI-suggested rewrite and index set as a starting point. You still validate the output. AI suggestions are a first draft, not a final answer, so confirm the rewritten query returns identical results and check the new plan before shipping.
Best for: Teams on PostgreSQL or MySQL who want an AI-assisted first pass at query rewriting and indexing.
Key features
- Automatic SQL query rewriting
- AI-generated indexing suggestions
- Ongoing performance insights via a sensor
- Cost-reduction recommendations, including redundant index removal
- PostgreSQL and MySQL focus
Why choose EverSQL: It compresses the diagnosis-to-candidate-fix loop for teams that would rather start from an AI suggestion than a raw execution plan. Validate every rewrite before it reaches production.
EverSQL pricing: A free optimization entry point is available. EverSQL capabilities are now offered through Aiven, and new EverSQL sign-ups are no longer being taken directly.
3. MySQL
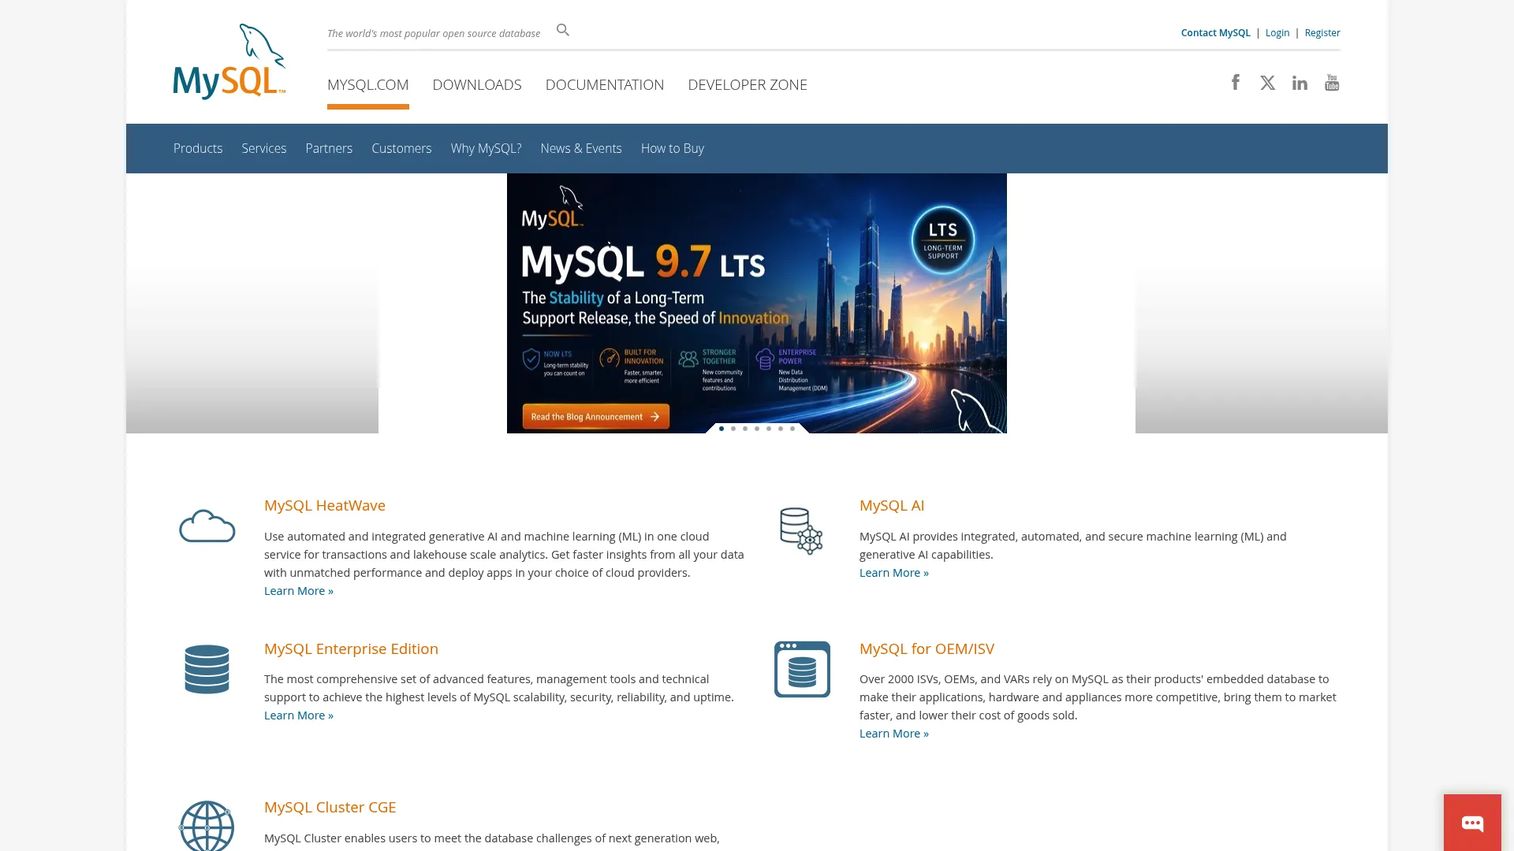
MySQL is Oracle's open-source relational database, and its own tooling is the natural optimization path for MySQL workloads. The EXPLAIN and EXPLAIN ANALYZE commands expose the query plan, showing join order, index usage, and row estimates. The performance schema and slow query log tell you which statements actually consume time, so you tune the queries that matter rather than the ones that feel slow.
MySQL teams care about the same three things every optimization workflow needs: query plans, indexes, and workload inspection. EXPLAIN handles the plan. Index hints and composite index design handle the physical layout. The slow query log and performance schema handle the workload review. Together they cover a full tuning cycle inside the database itself.
Best for: Teams running MySQL that want to inspect plans, tune indexes, and review workload with native tooling.
Key features
- EXPLAIN and EXPLAIN ANALYZE for query plans
- Performance schema for workload inspection
- Slow query log for bottleneck discovery
- MySQL Enterprise Backup, Scalability, and Authentication in commercial editions
- Wide ecosystem of compatible third-party analyzers
Why choose MySQL: For any MySQL-backed application, the native optimization path is free, well-documented, and directly tied to the engine that runs your queries. Commercial editions add enterprise features on top.
MySQL pricing: The Community edition is free. Commercial editions, Standard, Enterprise, and Cluster CGE, are sold as annual per-server subscriptions, with pricing available from Oracle sales.
4. Database Engine Tuning Advisor
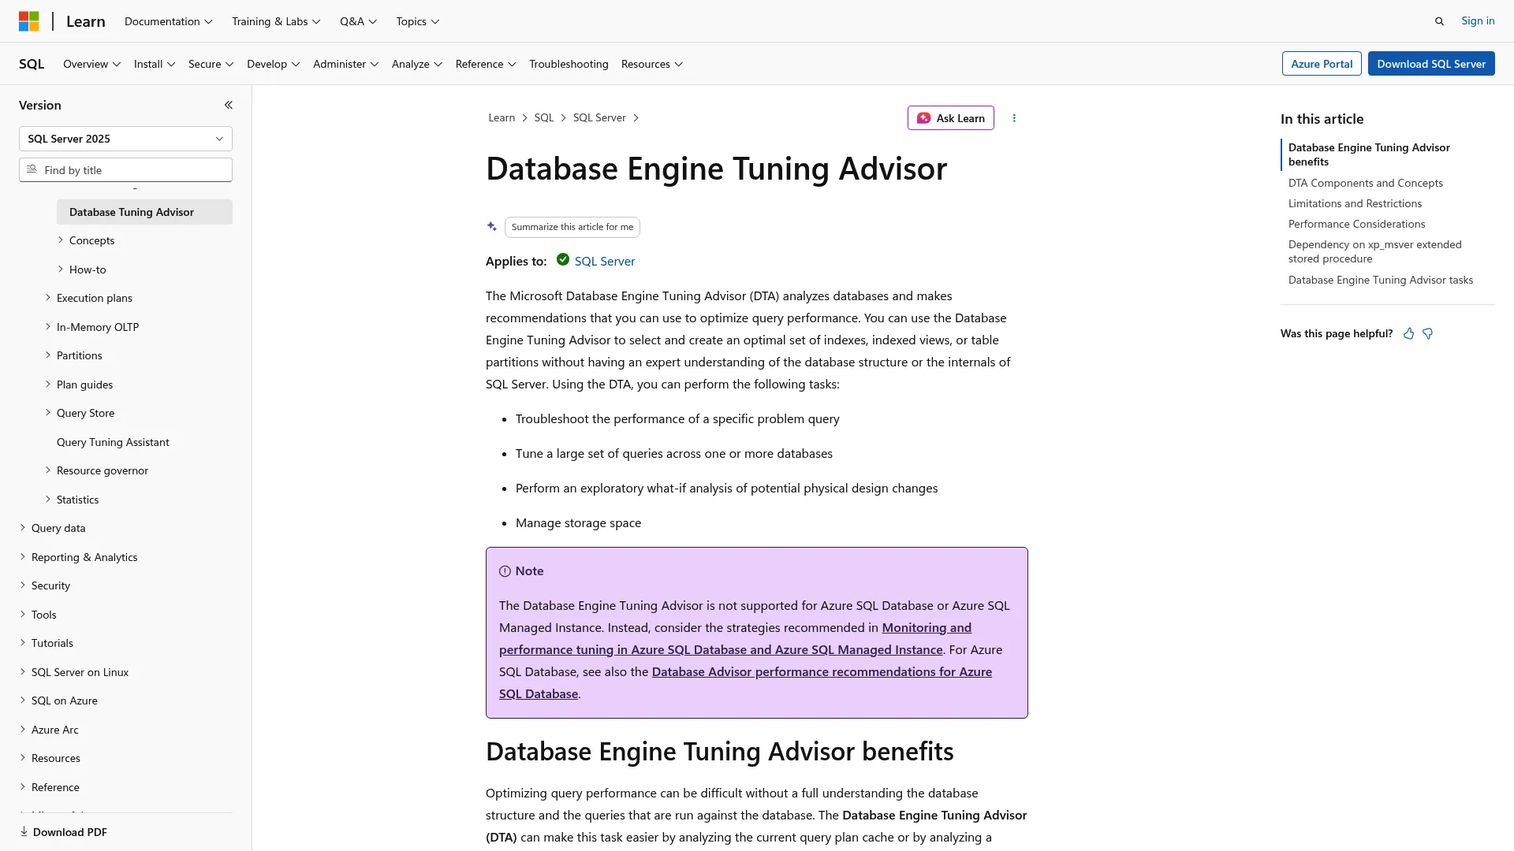
Database Engine Tuning Advisor, or DTA, is Microsoft's workload-driven tuning tool for SQL Server. You feed it a workload, from Query Store, the plan cache, a trace file, or a trace table, and it analyzes the queries and their plans to recommend indexes, indexed views, and partitions. It runs from a GUI or the command-line dta utility, and it includes what-if analysis so you can test a hypothetical design before applying it.
DTA is strongest when you have a representative workload and want a fast, structured set of physical-design recommendations. It shines at "here are the queries my app runs, what indexes should I have." It works best as one input alongside plan reading and monitoring, since a workload-based recommendation is only as good as the workload you capture.
Best for: SQL Server DBAs who want workload-based index and partition recommendations.
Key features
- Analyzes workloads and query plans for physical design changes
- Recommends indexes, indexed views, and partitions
- Supports GUI, command-line dta utility, Query Store, plan cache, and trace files
- What-if analysis for hypothetical designs
- Workload reports and tuning recommendations
Why choose Database Engine Tuning Advisor: It turns a captured workload into a concrete index plan faster than manual analysis. Pair it with execution plan reading so you understand why each recommendation helps.
Database Engine Tuning Advisor pricing: DTA ships as part of SQL Server, so it carries no separate license cost beyond your SQL Server edition.
5. SQL Profiler
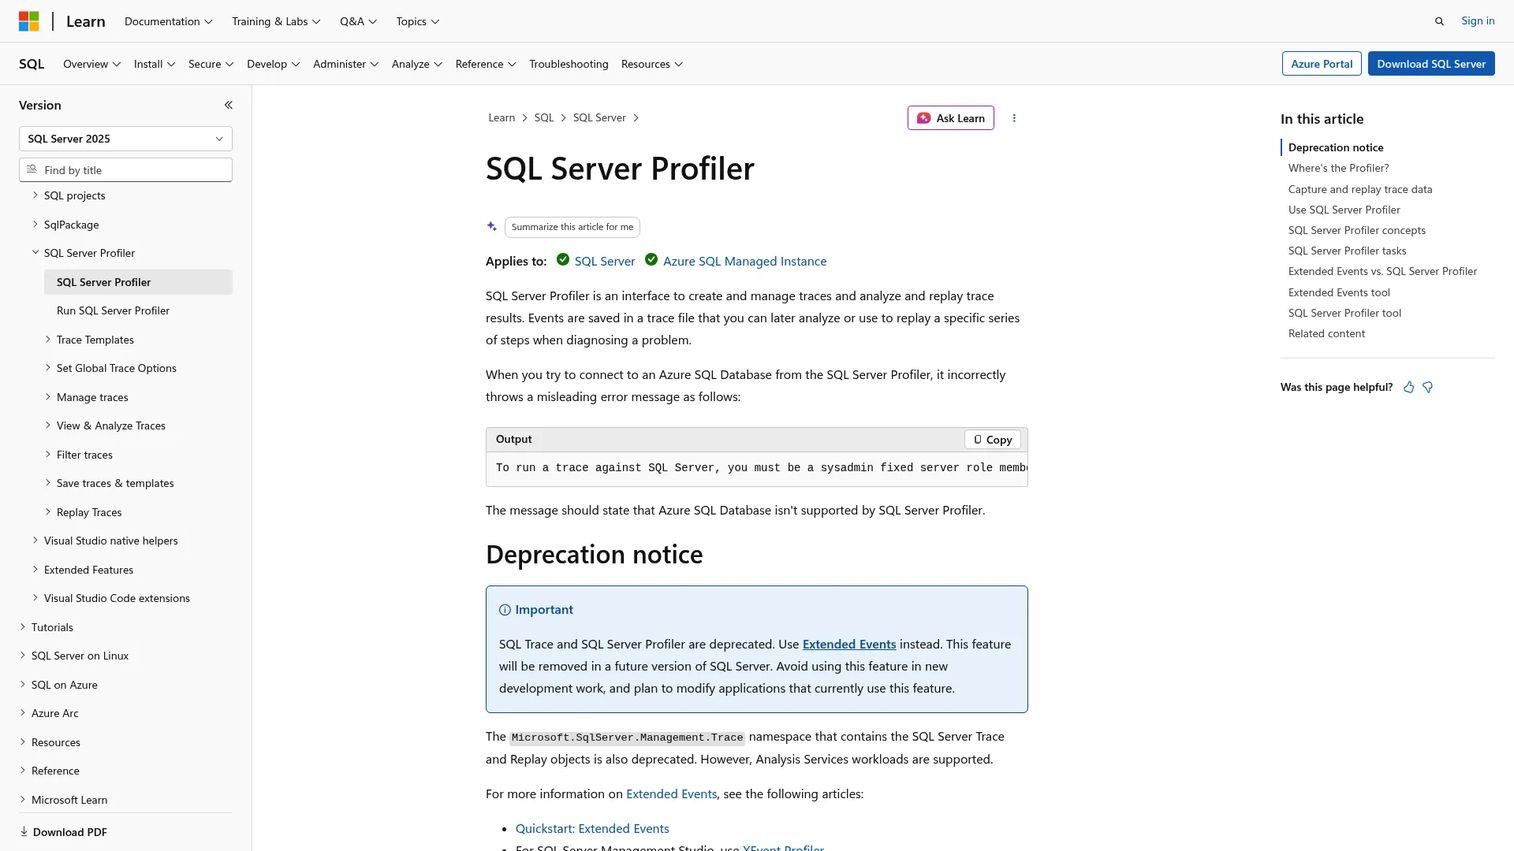
SQL Profiler is Microsoft's tracing GUI for SQL Server and Analysis Services. Its job in an optimization workflow is diagnostic: it captures what actually ran against the engine. You start a trace, filter to the events and databases you care about, and watch the real statements, durations, and resource costs as they happen. That workload capture is the raw material every tuning decision depends on.
Profiler is a diagnostic input rather than a fixer. It shows you the slow statements and how often they run, and you take that trace into DTA for index recommendations or into a plan analyzer to read the execution plan. Note that SQL Profiler is deprecated in current SQL Server, with Extended Events as the forward path, but many teams still rely on it for quick trace capture and replay.
Best for: Teams doing legacy SQL Server or Analysis Services troubleshooting and trace review.
Key features
- Graphical UI for SQL Trace monitoring
- Trace capture and replay
- Event and database filtering
- Templates for common trace scenarios
- Auditing support
Why choose SQL Profiler: When you need to see exactly what ran and how long it took, a live trace answers fast. Pair it with DTA or a plan tool to turn the trace into a fix.
SQL Profiler pricing: SQL Profiler is included with SQL Server, so there is no separate price beyond your SQL Server edition.
6. Plan Explorer
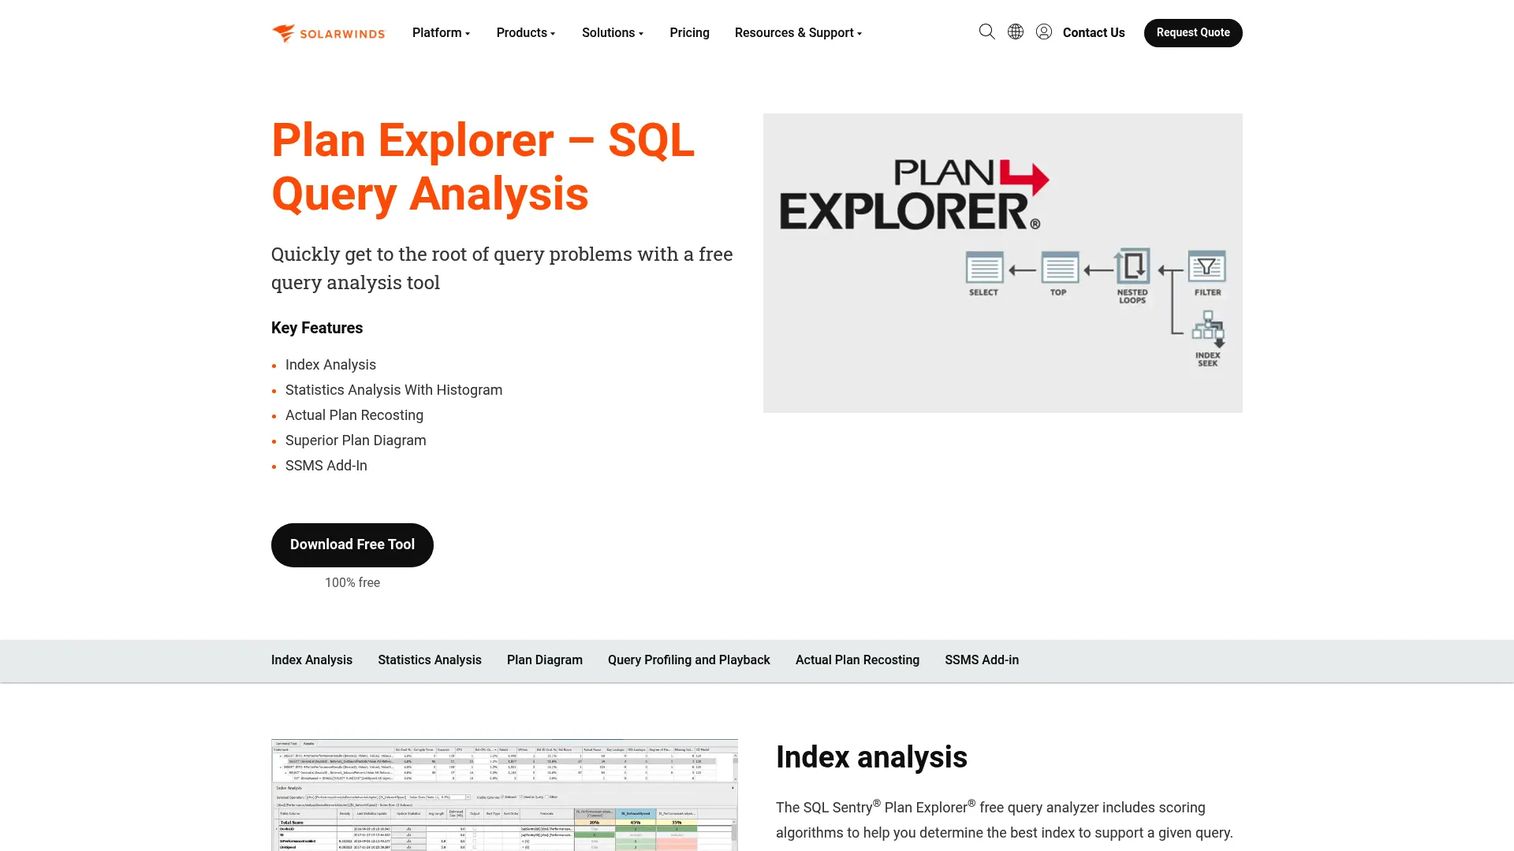
Plan Explorer from SolarWinds is a free SQL Server execution plan analysis tool. It takes the plan you would otherwise squint at in Management Studio and turns it into a readable visual, highlighting the costliest operators, expensive joins, and where estimates diverge from actual rows. That makes it the tool of choice when the question is "why did the optimizer choose this plan, and where is the time going."
Where Profiler tells you what ran and DTA tells you what indexes to add, Plan Explorer tells you why a specific plan is slow. It performs index analysis, statistics analysis with histograms, and actual plan recosting, so you can see how a plan would change under different assumptions. For deep plan reading, it goes further than the built-in plan viewer, and it costs nothing.
Best for: DBAs and developers who need to read SQL Server execution plans in depth.
Key features
- Visual execution plan analysis
- Costly operator and join highlighting
- Index analysis
- Statistics analysis with histogram
- Actual plan recosting
Why choose Plan Explorer: It gives you the deepest free view into a SQL Server execution plan, surfacing the operator costs and estimate gaps that the built-in viewer buries. Use it when reading the plan is the whole job.
Plan Explorer pricing: Plan Explorer is 100% free, with no paid tiers listed on the product page.
7. SQL Monitor
SQL Monitor from Redgate is a database performance analyzer for SQL Server and hybrid environments. Where the other tools help you fix a query you already know is slow, SQL Monitor tells you a query went slow in the first place. It watches performance in real time across multiple platforms, alerts on regressions, and keeps historical trends so you can triage a slowdown against what changed.
For teams that own database performance over time, this is the safety net. It surfaces the query that regressed after a deploy, correlates it with the deployment that caused it, and gives you the historical baseline to prove the fix worked. That continuous view is what separates ongoing performance management from one-off tuning.
Best for: Teams that need centralized, continuous monitoring across SQL Server and hybrid database environments.
Key features
- Real-time multi-platform performance monitoring
- Alerting and diagnostics
- Deployment tracking
- Query impact analysis
- Historical performance trends
Why choose SQL Monitor: It catches regressions before your users do and gives you the historical context to triage them fast. It pairs naturally with plan and index tools that handle the actual fix.
SQL Monitor pricing: Standard is $97 per server per month, billed annually. Enterprise is quote-based.
Considerations
Before you commit to a sql query optimization tool, run through this checklist against your actual stack.
Database compatibility
Match the tool to the engine you run. SQL Server teams get the most from native tooling plus Plan Explorer or SQL Monitor. MySQL and PostgreSQL teams should look at EverSQL and native tooling. A tool that does not speak your database is a tool you will not use.
Execution plan depth
Decide how deep you need to read plans. The built-in plan viewers cover most cases, but a dedicated analyzer surfaces operator costs and estimate gaps that the basics hide. If plan reading is a daily task, depth matters more than breadth.
Rewrite and index recommendations
Some tools suggest fixes; others only diagnose. If you want a candidate rewrite or index set handed to you, prioritize AI-assisted or workload-driven advisors. Always validate the recommendation against real query results before shipping it.
Monitoring and alerting
Ask whether you need continuous coverage or point-in-time analysis. Monitoring tools catch regressions you would otherwise find from an angry Slack message. If you own performance over time, alerting is not optional.
Adoption and workflow fit
The best tool is the one your team actually opens. Check that it fits how you already work, whether that is inside Management Studio, a browser, or your CI pipeline. A tool that adds process overhead gets abandoned, no matter how good the analysis is.
Conclusion
The right pick depends on the bottleneck in front of you. If you run Microsoft SQL Server, start with the native tooling and Query Store, then add Plan Explorer for deep plan reading and Database Engine Tuning Advisor for workload-based index recommendations. SQL Profiler captures what actually ran when you need the raw trace.
On MySQL or PostgreSQL, lean on the native EXPLAIN and performance schema, and reach for EverSQL when you want an AI-assisted first pass at a rewrite. When your job is watching performance over time rather than fixing one query, SQL Monitor gives you the alerting and history to catch regressions early.
Match the tool to the job. Reading a plan, rewriting SQL, tuning an index, and monitoring a workload are four different tasks, and no single tool is best at all four. The next step is simple: name your current bottleneck, then pick the tool built for that exact job. Start with the query that is slow right now, and work backward to the tool that explains it.
FAQs
It helps you find slow SQL queries, read their execution plans, rewrite the SQL, recommend indexes, and monitor workload performance. In practice it turns a slow query into a diagnosis, showing where time goes and what to change, whether that is an index, a rewrite, or a statistics update.
For most SQL Server teams, the native tooling is the starting point: execution plans, Query Store, and Database Engine Tuning Advisor all ship with the platform. For deeper plan reading, Plan Explorer is a free add-on. For continuous monitoring, SQL Monitor tracks regressions over time.
AI is useful as a fast first pass. Tools like EverSQL generate a candidate rewrite and index set quickly, which saves time over reading a cold execution plan. Treat the output as a draft: always confirm the rewritten query returns identical results and check the new plan before you ship it.
The terms are often used interchangeably. A query plan, sometimes called an estimated plan, is what the optimizer expects to do. An execution plan, or actual plan, is what the engine actually did, including real row counts and runtime. The actual plan is more reliable for diagnosing a slow query because it shows what happened, not what was predicted.
Yes. Workload-driven tools like Database Engine Tuning Advisor analyze the queries you run and recommend indexes, indexed views, and partitions. AI tools like EverSQL suggest indexes from a submitted query. Always model the change and compare before-and-after plans, since every index speeds reads but slows writes.
Often, yes. Automated tools catch common patterns, but a human who understands the data and the business logic still writes the best rewrites for complex cases. Use a sql validator or sql syntax checker to confirm the rewritten query is correct, then compare the execution plan to prove it is faster.
For SQL Server, SQL Profiler captures what actually ran, and SQL Monitor surfaces regressions continuously with historical trends. On MySQL, the slow query log and performance schema do the same job natively. A query verifier or plan analyzer then tells you why the query you found is slow.
Yes. MySQL ships EXPLAIN, EXPLAIN ANALYZE, and the performance schema for native plan and workload analysis. PostgreSQL has its own EXPLAIN and statistics tooling. EverSQL adds an AI-assisted rewrite and indexing layer on top of both, so cross-engine teams get a consistent optimization workflow.