You open the Visio file to trace a connection. It was last edited fourteen months ago. Half the switches on it were decommissioned, three new access points never made it in, and the one path you actually care about routes through a device nobody documented. So you start pinging, SSHing, and reconstructing the topology by hand while the incident clock keeps running.
That gap between what your diagram says and what your network actually is quietly taxes every troubleshooting session, every audit, and every capacity decision. Static diagrams age the moment you save them. Networks do not sit still. Devices get added, VLANs get reconfigured, links fail over, and cloud subnets spin up faster than anyone can draw them.
Network mapping software closes that gap by discovering devices, tracing how they connect, and keeping the picture current as the environment changes. The category matters more every year. The global network mapping software market is projected to grow from USD 14.47 billion in 2025 to USD 42.8 billion by 2034, according to The Insight Partners (2025), driven by hybrid infrastructure, automation, and the sheer pace of change in modern networks.
This guide is a buyer's comparison, not a vendor pitch. If you are a network admin, an infrastructure lead, or a product-minded technical buyer weighing automated discovery against free tools and enterprise platforms, the goal is to help you match a tool to your environment's real maintenance burden. The same discipline applies whether you are mapping a data center or evaluating any technical tooling stack, the way teams do when comparing ab testing tools or ai governance tools for adjacent internal systems.
What's inside
This guide compares seven network mapping tools built for automated discovery, topology visibility, low-maintenance updates, reporting, and exports. The list spans structured topology mappers, live dependency mapping, monitoring platforms with map views, discovery-first scanners, and open-source options.
Each tool was assessed against criteria that decide whether a map stays useful:
- Discovery depth: how well it finds new, changed, and unmanaged devices
- Visualization quality: Layer 2 and Layer 3 clarity, filters, and segmentation
- Update cadence: scheduled scans and how close to live the map stays
- Reporting and exports: Visio, PDF, PNG, and audit-ready output
- Integrations and scalability: monitoring, CMDB, alerting, and growth headroom
TL;DR
- Best for structured topology mapping: SolarWinds Network Topology Mapper, for automated discovery, Layer 2 and Layer 3 diagrams, scheduled rescans, and Visio exports.
- Best for live dependency mapping: Faddom, for agentless, real-time application dependency maps across hybrid and cloud environments.
- Best for monitoring plus map views: Paessler PRTG Network Monitor, when you want sensor-based visibility and live status alongside topology.
- Best for infrastructure inventory: Device42, when mapping needs to tie into CMDB, DCIM, and IPAM data.
- Best free and open-source pick: Nmap, for discovery, scanning, and building custom mapping workflows on any budget.
- Best for small IT teams: Spiceworks Network Mapper, for lightweight discovery and basic maps without a purchase order.
What is network mapping software?
Network mapping software is a tool that automatically discovers the devices on a network, identifies how they connect, and produces a visual topology that updates as the environment changes.
It helps to separate three terms that get used interchangeably. A network map is the discovered, often live representation of devices and their connections. A network diagram is a drawn illustration of a network, which may be manual and static. Network topology is the underlying arrangement of nodes and links that both describe. A good network topology mapper produces a map that reflects real topology instead of a hand-drawn approximation.
Mapping also splits by view. A physical network map shows hardware and cabling: switches, routers, ports, and the physical paths between them. A logical network map shows how traffic and addressing flow: subnets, VLANs, and routing relationships regardless of physical layout. Most teams need both.
Those views map to OSI layers. Layer 2 topology covers switching, MAC addresses, and VLAN adjacencies, the "who is plugged into what" picture. Layer 3 topology covers IP routing, subnets, and how segments reach each other. Incident response usually needs Layer 2 to isolate a fault domain and Layer 3 to trace a path across segments.
Core capabilities to expect from network discovery and mapping tools:
- Device discovery: SNMP, CDP/LLDP, ICMP, WMI, and traffic-based methods to find managed and unmanaged devices
- Topology visualization: Layer 2 and Layer 3 views with filtering and grouping
- Scheduled scans: recurring discovery so the map reflects change automatically
- Reporting and exports: Visio, PDF, PNG, and CSV output for audits and sharing
- Alerts and status: up/down and change awareness where the tool supports it
- Integrations: monitoring, CMDB, IPAM, and ticketing connections
When to use network mapping software
Improve visibility before outages spiral
A current map surfaces what changed and what should not be there. When a rogue switch appears or a link fails over to an unexpected path, an automated network mapping tool flags it against the last known topology. That turns troubleshooting from archaeology into confirmation. Instead of rebuilding the diagram mid-incident, you compare live to expected and go straight to the fault domain. Fewer blind spots means shorter mean time to resolution and fewer surprises during change windows.
Build a shared source of truth for infrastructure
Visio files and spreadsheet inventories break the moment someone forgets to update them, and someone always forgets. A real-time network map treats documentation as a byproduct of discovery rather than a manual chore. The map updates when the network does, so the whole team, ops, security, and new hires, works from the same accurate picture. This matters most when institutional knowledge lives in one person's head and that person is on PTO during an incident.
Support compliance and audit readiness
PCI DSS, SOX, HIPAA, and similar frameworks expect you to know your network and prove it. Current diagrams support scoping, segmentation evidence, and change traceability. Auditors ask what connects to the cardholder data environment; a live map answers with proof instead of a stale drawing. Accurate topology, exportable reports, and a documented update cadence turn compliance from a scramble into a routine export.
Comparison table
The table below compares the seven tools on intent, differentiation, pricing, and rating so you can shortlist two or three before reading the full sections.
| # | Product | Intent | Key differentiation | Pricing | G2 rating |
|---|---|---|---|---|---|
| 1 | SolarWinds Network Topology Mapper | Structured topology mapping | Automated Layer 2/Layer 3 discovery with scheduled rescans and Visio export | Starts at $1,977; 14-day free trial | Not listed |
| 2 | Faddom | Live dependency mapping | Agentless, traffic-based real-time application dependency maps | Free Community tier; Standard from $20,000/yr | 4.5/5 |
| 3 | Paessler PRTG Network Monitor | Monitoring with map views | Sensor-based monitoring plus customizable maps and alerts | From $200/mo billed annually; free up to 100 sensors | 4.7/5 |
| 4 | Device42 | Infrastructure inventory and mapping | Discovery tied to CMDB, DCIM, ITAM, and IPAM | Annual subscription by device count | 4.7/5 |
| 5 | Intermapper | Visual monitoring and mapping | Live status maps with real-time alerts and history | Not publicly listed | 4.3/5 |
| 6 | Nmap | Discovery and scanning foundation | Open-source host discovery, port scanning, and scripting | Free and open source | Not listed |
| 7 | Spiceworks Network Mapper | Lightweight mapping for small teams | Free device discovery and basic map creation | Contact vendor | Not listed |
The 7 best network mapping software tools for 2026
1. SolarWinds Network Topology Mapper
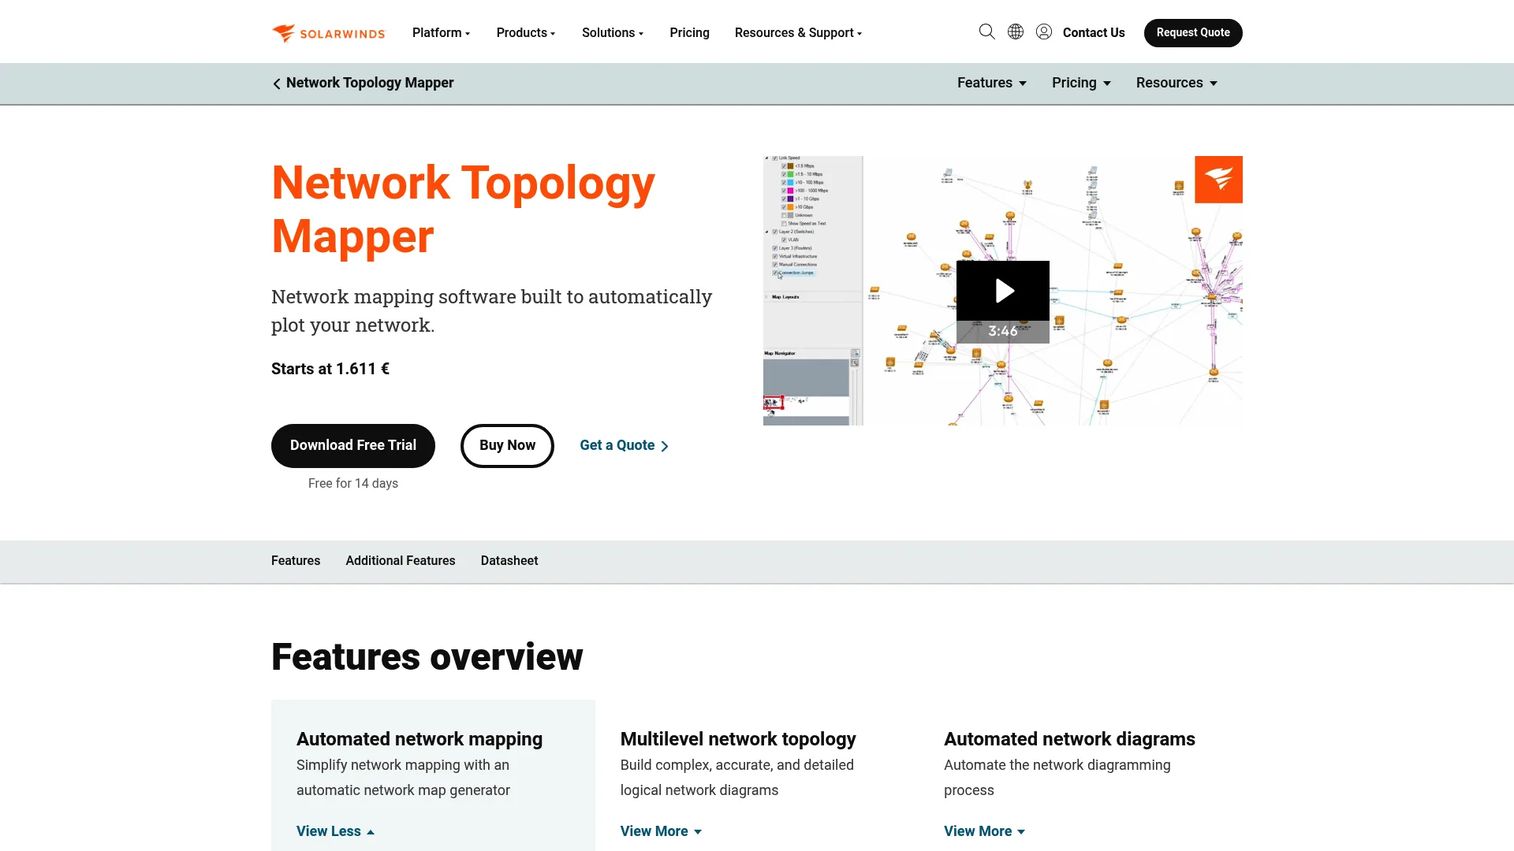
SolarWinds Network Topology Mapper is network mapping software that automatically discovers devices and builds topology diagrams from what it finds. It leans into structured, repeatable mapping: run discovery, get a Layer 2 and Layer 3 view, schedule rescans, and keep the diagram current without redrawing it by hand. For teams that treat the map as living documentation rather than a one-off drawing, it fits cleanly.
Best for: IT teams that need automated network topology mapping and diagram maintenance without manual redraws.
Key strengths
- Automatic network discovery: Finds devices across the environment using multiple protocols so the map reflects what is actually connected.
- Layer 2 and Layer 3 topology mapping: Produces both switching and routing views, which matters when you isolate a fault domain then trace a path across segments.
- Scheduled rescans and map updates: Recurring scans keep the diagram aligned with change instead of letting it drift.
Why choose SolarWinds Network Topology Mapper: If your pain is stale diagrams and audit scrambles, its scheduled discovery and export options turn documentation into a repeatable output. It suits teams that want structured maps and predictable update cadence over a lightweight, ad hoc tool. The export path to Visio and other formats also helps when auditors or leadership want a snapshot outside the tool.
Pricing: SolarWinds lists Network Topology Mapper starting at $1,977, with a free 14-day trial to evaluate discovery and mapping against your environment before committing. Pricing is a one-time style license entry point rather than a per-seat subscription, which appeals to teams that want predictable cost.
2. Faddom
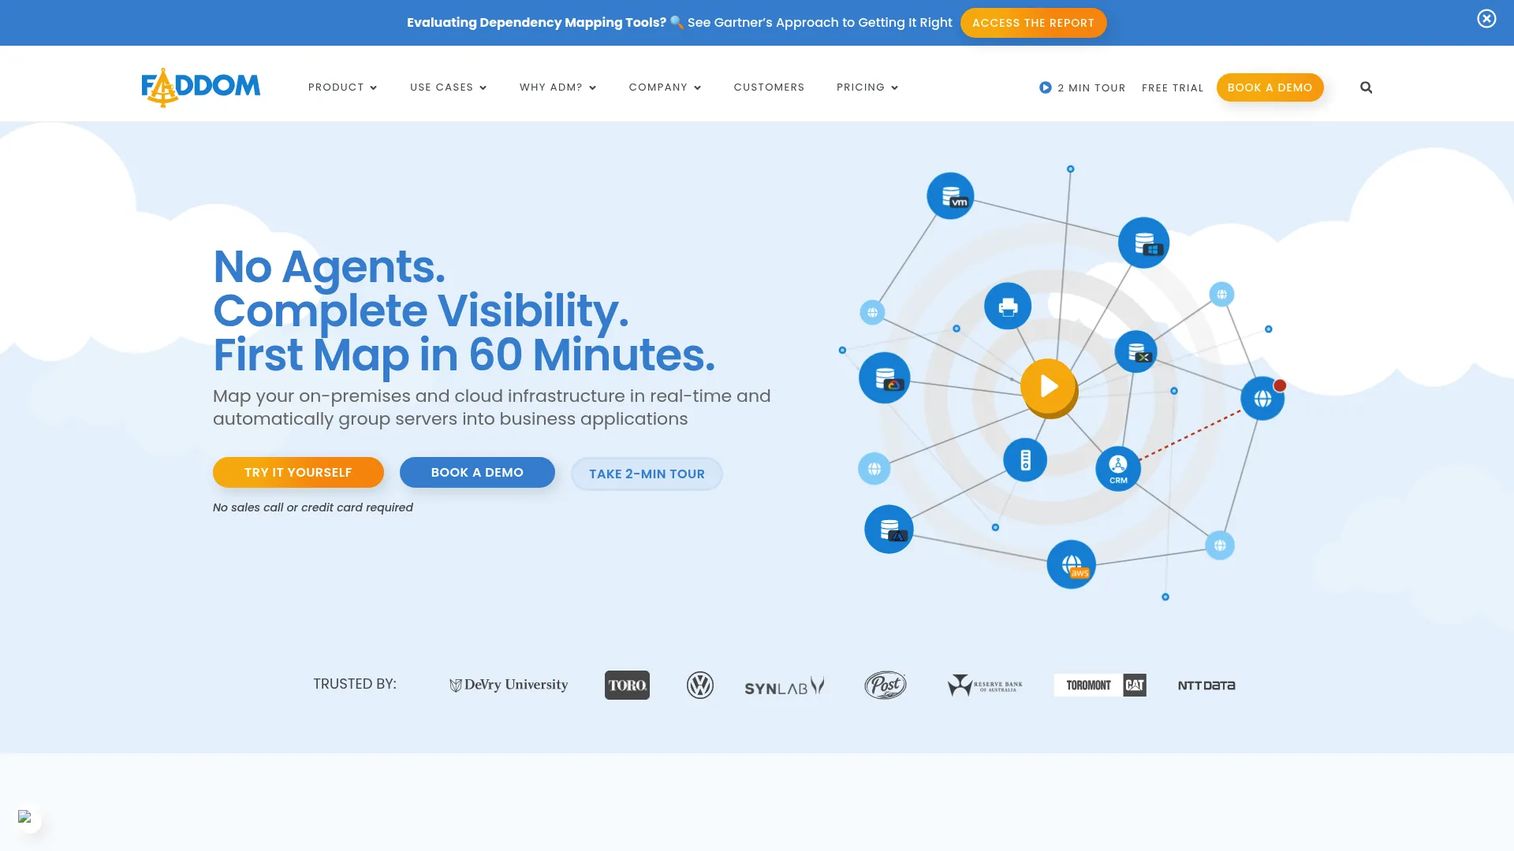
Faddom is an agentless application dependency mapping and infrastructure visibility platform. Instead of installing agents on every host, it reads traffic passively to build a real-time picture of how servers, applications, and services depend on each other. That makes it a strong fit for teams that care less about switch-port cabling and more about which application talks to which database across on-prem and cloud.
Best for: IT teams needing fast, agentless dependency mapping across hybrid environments.
Key strengths
- Agentless, passive traffic-based discovery: Maps the environment without deploying agents, which shortens time to first map and lowers deployment friction.
- Real-time application dependency mapping: Keeps a live view of service relationships, useful for migration planning and blast-radius analysis.
- Hybrid, on-prem, and cloud visibility: Covers mixed environments and integrates with surrounding infrastructure tooling.
Why choose Faddom: When your questions are "what breaks if I move this server" or "what depends on this legacy app," dependency mapping answers them better than a port-level topology map. Faddom suits migration, capacity planning, and hybrid visibility work where relationships matter more than physical layout. Its agentless model gets teams to a usable map quickly.
Pricing: Faddom offers a free Community tier for up to 50 servers, which is generous for testing or small footprints. Standard starts at $20,000 per year for up to 300 servers, Pro starts at $36,000 per year for larger deployments, and Enterprise is custom for thousands of servers. It holds a 4.5/5 rating on G2.
3. Paessler PRTG Network Monitor
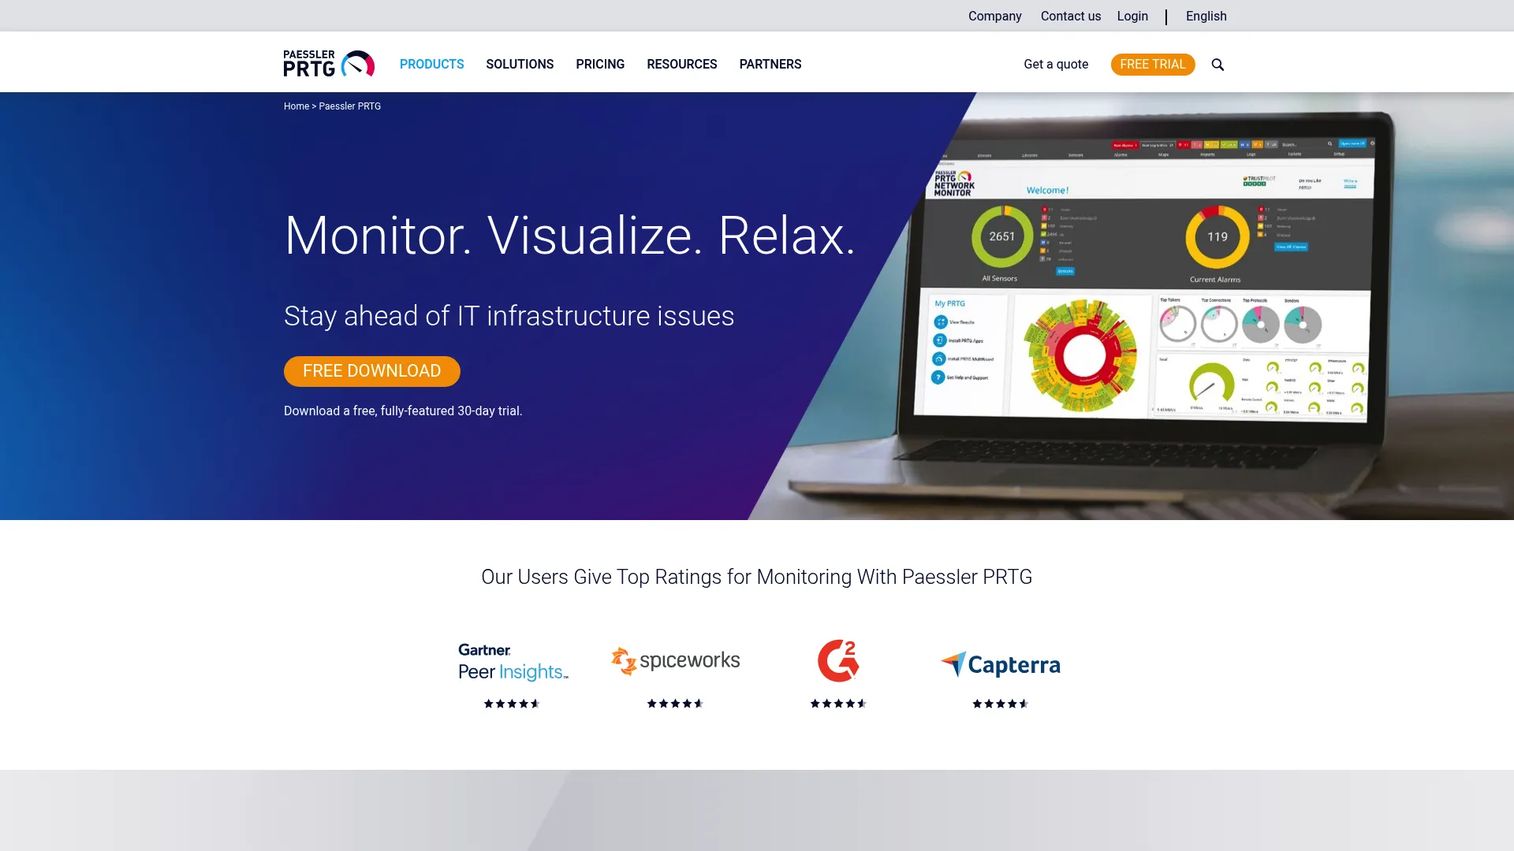
Paessler PRTG Network Monitor is on-premises monitoring software for IT, OT, and IoT infrastructures that blends sensor-based monitoring with customizable maps. Buyers often reach for it when they want live status and alerting alongside topology insight in one place. It is not a map-first tool in the way a dedicated topology mapper is, but its map views paired with real-time sensor data make it valuable for teams that treat visibility and monitoring as one job.
Best for: Small to mid-sized teams needing sensor-based infrastructure monitoring on Windows servers.
Key strengths
- Automatic network discovery: Builds an inventory of devices and sensors so monitoring and mapping start from the same discovered base.
- Customizable dashboards and maps: Lets you assemble map views that combine topology with live sensor readouts.
- Alerts, notifications, and reporting: Surfaces up/down and threshold events so a change on the map ties to an actionable alert.
Why choose Paessler PRTG Network Monitor: If you want one tool that watches health and shows layout, PRTG covers both. It fits teams that value real-time status and troubleshooting support over a purely diagram-centric mapper. The sensor model scales from a small shop to mid-sized environments as monitoring needs grow.
Pricing: PRTG uses sensor-based licensing. Paid tiers start at PRTG 500 for $200 per month paid annually, and scale up through PRTG 1000, 2500, 5000, and 10000 at higher monthly rates. There is a freeware edition up to 100 sensors and a free 30-day trial. It holds a 4.7/5 rating on G2.
4. Device42
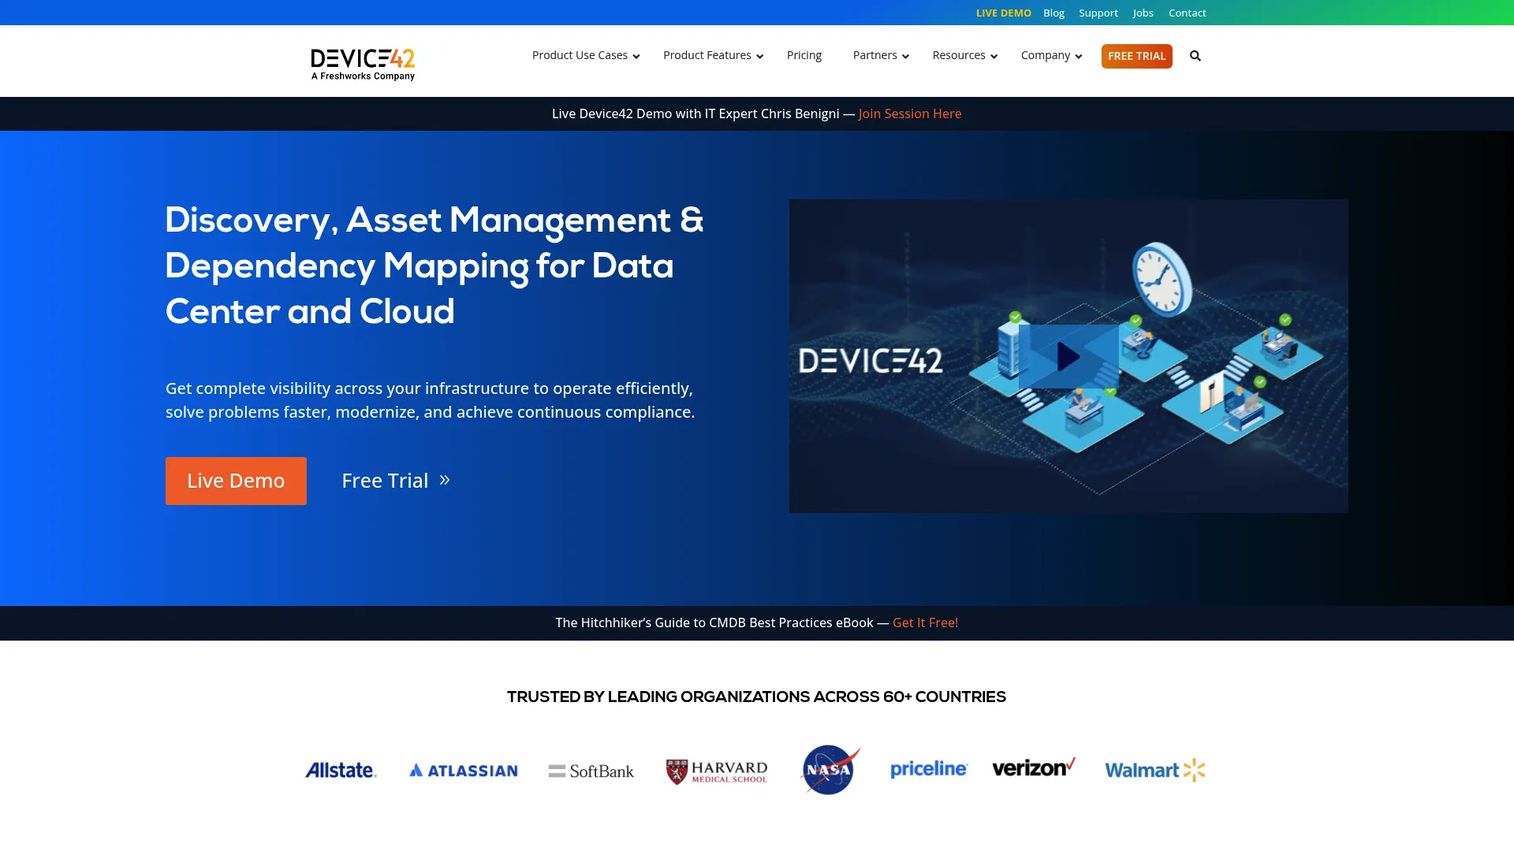
Device42 is IT discovery and asset management software that combines dependency mapping with CMDB, DCIM, ITAM, and IPAM in one platform. It is the pick when network mapping needs to plug into a broader inventory picture rather than stand alone. Agentless discovery feeds a system of record that tracks devices, dependencies, IP space, and data center assets together, which is why larger and more process-driven IT teams gravitate to it.
Best for: IT teams needing hybrid infrastructure visibility, discovery, and asset or dependency management in one system.
Key strengths
- Agentless infrastructure and device discovery: Finds and catalogs devices across hybrid environments without agent sprawl.
- Application dependency mapping: Ties discovered devices to the services and applications running on them.
- DCIM and IPAM: Manages data center assets and IP address space alongside the map, so mapping and inventory stay in sync.
Why choose Device42: When mapping is one input into asset management, compliance, and capacity planning, a combined platform beats stitching separate tools together. Device42 suits teams that want topology awareness anchored to a CMDB and IPAM rather than a standalone diagram. That integration is its main draw for enterprise environments.
Pricing: Device42 uses an annual subscription model based on device count. Public numeric pricing is not shown on the pricing page, so you request a quote sized to your environment. It holds a 4.7/5 rating on G2.
5. Intermapper
Intermapper is network monitoring software focused on mapping and monitoring IP-enabled devices with clear visual status. Its appeal is fast visual clarity: color-coded live maps that let an operations team see at a glance what is up, degraded, or down. For teams that want a map they can put on a wall display and read instantly during an incident, that immediacy is the selling point.
Best for: IT teams that need visual network monitoring and alerting with an easy-to-read live map.
Key strengths
- Network mapping: Produces visual maps of IP-enabled devices and their connections.
- Real-time alerts: Notifies on status changes so the map doubles as an early-warning surface.
- Historical data and reporting: Keeps history so you can review trends and support post-incident reviews.
Why choose Intermapper: If your operations team lives on a NOC display and needs to read status in seconds, Intermapper's visual-first approach fits. It suits teams that prioritize at-a-glance clarity and live status over deep asset inventory. The combination of mapping, alerting, and history covers the day-to-day monitoring loop.
Pricing: Public pricing for Intermapper was not verifiable from a first-party page during research, so contact Progress for a current quote sized to your device count. It holds a 4.3/5 rating on G2.
6. Nmap
Nmap is the free, open-source discovery and security auditing tool that many mapping workflows quietly depend on. It is more scanner than polished map-first platform, and that is the point. Nmap excels at finding hosts, scanning ports, fingerprinting operating systems, and running scripted checks. Teams use it as the discovery engine feeding maps, inventories, and audits, often paired with visualization front-ends that render its output.
Best for: Security teams and administrators needing network discovery, port scanning, and audit automation.
Key strengths
- Host discovery and port scanning: Finds live hosts and open services fast, the foundation of any accurate map.
- OS detection: Fingerprints devices to enrich inventory and topology data.
- Nmap Scripting Engine (NSE): Automates checks and custom discovery logic, which lets teams build repeatable mapping and audit workflows.
Why choose Nmap: If you have the technical chops and want maximum control at zero license cost, Nmap is the workhorse. It fits security-minded teams and admins who prefer scripting and composition over a packaged UI. Expect to pair it with a visualization layer if you want polished diagrams, since Nmap's strength is discovery and data, not rendered maps.
Pricing: Standard Nmap is free and open source. The only public prices are OEM redistribution licenses for embedding Nmap in commercial products, starting at $59,980 perpetual, which does not apply to normal internal use. For discovery and mapping inside your own network, it costs nothing.
7. Spiceworks Network Mapper

Spiceworks Network Mapper is a lightweight mapping tool aimed at smaller IT teams that need to discover devices and visualize connections without a heavy platform. Its appeal is accessibility: get a basic map, see device details, and check bandwidth usage without a procurement cycle. For a small shop that just needs to know what is on the network and how it connects, it clears that bar.
Best for: IT teams needing basic network discovery and mapping without enterprise overhead.
Key strengths
- Customizable network map creation: Builds maps of discovered devices that you can arrange to match your environment.
- Bandwidth usage visibility: Shows utilization so you spot saturation alongside topology.
- Device details access: Surfaces per-device information to support quick troubleshooting.
Why choose Spiceworks Network Mapper: When budget is tight and the network is modest, Spiceworks gives you discovery and a usable map with minimal setup. It fits smaller teams comfortable trading advanced automation for accessibility. Teams that later need scheduled deep discovery, Layer 2/Layer 3 depth, or audit-grade exports often graduate to a heavier tool as they scale.
Pricing: Public pricing was not verifiable from the vendor's own site during research; Capterra lists it as contact vendor for pricing. Historically positioned as a free or low-cost option for small teams, so confirm current availability and terms directly before you plan around it.
Considerations before you buy
Match the tool to your environment's maintenance reality, not to a feature list. Here is what to pressure-test before you commit.
Discovery depth
Ask how the tool finds new and changed devices, and which protocols it uses: SNMP, CDP/LLDP, WMI, ICMP, or traffic-based methods. Check whether scheduled scans are supported and how it handles unmanaged or unsupported devices. A tool that only finds what it already knows about will leave the same blind spots you have today. Test it against a segment with known oddities before you trust it network-wide.
Visualization quality
A pretty map that nobody can read during an incident is decoration. Look for clear Layer 2 and Layer 3 views, filtering, grouping, and segmentation so you can drill into one VLAN or trace one path without noise. The test is simple: can a new engineer isolate a fault domain from the map alone in under a minute? If not, the visualization is not doing its job.
Reporting and exports
Visio, PDF, PNG, and CSV exports still matter, because audits, leadership, and change reviews often need documentation outside the tool. Confirm the tool produces current, exportable diagrams rather than trapping topology behind its own UI. Freshness matters as much as format: an exported map is only useful if it reflects the last scan, not last quarter.
Integrations and workflows
CRM is irrelevant here, but monitoring, CMDB, IPAM, alerting, and ticketing are not. Check where alerts land and whether the tool feeds or reads your system of record. Integration with ticketing and automation turns a change on the map into an actionable workflow instead of a notification nobody sees.
Security and compliance
For regulated environments, verify access controls, role-based permissions, and auditability. Confirm the tool keeps documentation fresh enough to support PCI, SOX, or HIPAA evidence and that it can scope segmentation. Ask how it stores discovered data and who can see it, because a map of your network is sensitive by definition.
Conclusion
The right pick comes down to how your environment changes and how much manual upkeep you can stomach. For structured topology mapping with scheduled rescans and clean Visio exports, SolarWinds Network Topology Mapper is the straightforward choice. For live application dependency mapping across hybrid and cloud, Faddom leads. If you want monitoring and map views in one tool, Paessler PRTG Network Monitor covers both, and Intermapper wins when at-a-glance NOC clarity is the priority.
For mapping tied to a broader system of record, Device42 anchors topology to CMDB, DCIM, and IPAM. If you have the technical depth and want zero license cost, Nmap is the discovery engine to build around, and Spiceworks Network Mapper serves small teams that just need a basic map fast.
Your next step: shortlist two tools that match your update cadence and compliance needs, then run each against one real segment of your network. The tool that produces an accurate, current map with the least manual effort is the one that will still be useful a year from now.
FAQs
A network map is usually the discovered, often live representation of devices and their real connections, generated by software that scans the environment. A network diagram is a drawn illustration that may be manual and static, created in a tool like Visio. Maps reflect current reality from discovery; diagrams reflect whatever someone last drew.
Visio is excellent for deliberate, hand-crafted diagrams, but it does not discover devices or update itself. If your Visio files drift out of date between edits, automated network mapping keeps the underlying topology current and often exports back to Visio. Many teams use both: automated discovery for accuracy, Visio for polished, annotated documentation.
No, though they overlap. Mapping focuses on discovering devices and visualizing how they connect. Monitoring focuses on health, performance, and alerting over time. Some tools do both, like sensor-based platforms with map views, but a dedicated topology mapper prioritizes accurate discovery and diagrams over real-time performance metrics.
For Layer 2, look for CDP/LLDP support, MAC address tables, and VLAN awareness so you can see switch-port adjacencies. For Layer 3, look for accurate IP subnet and routing discovery so you can trace paths across segments. Clear filtering between the two views is what lets you isolate a fault domain and then follow a route without visual clutter.
Often yes, for smaller environments. Free network mapping software like Nmap or lightweight options can handle discovery and basic maps well. The tradeoffs usually appear at scale: scheduled deep discovery, audit-grade exports, role-based access, and Layer 2/Layer 3 depth are where paid platforms pull ahead. Start free, and upgrade when maintenance burden or compliance demands more.
As often as your network changes. Static environments might rescan weekly, while dynamic ones with frequent changes benefit from daily or continuous discovery. The point of automated mapping is to remove the manual update cadence entirely, so set scheduled scans that match your rate of change and let the map stay current on its own.
Verify that the tool produces current, exportable diagrams, tracks changes over time, and supports role-based access controls. For PCI, SOX, or HIPAA, auditors want proof of what connects to sensitive systems and evidence of segmentation. Confirm the tool can scope those boundaries, export documentation on demand, and show a defensible update cadence rather than a stale snapshot.
It can be, especially as a discovery engine. Tools like Nmap are powerful, scriptable, and cost nothing to run internally, and many enterprises use them inside larger workflows. The consideration for enterprise is packaging: you often pair open-source discovery with a visualization and reporting layer, plus governance around who runs scans and where the data lives.