

It's Monday morning. The pipeline meeting starts in 30 minutes. Your paid media platform shows one ROAS. Your CRM shows a different number for the same campaign. Finance wants CAC and payback period. The spreadsheet still needs three manual exports before anyone can even look at it.
This is not a data problem. It's a reporting infrastructure problem. And according to NielsenIQ's CMO Outlook (2024), only 21% of marketing leaders say they receive actionable insights in real time. The remaining 79% are still stuck in the spreadsheet loop - pulling, cleaning, and reconciling numbers that should already be in one place.
The right marketing dashboard software replaces that loop with a system. The wrong one adds another login nobody checks.
What's inside
This guide is for growth marketers, marketing ops teams, and digital agencies evaluating marketing dashboard tools in 2026. Tools were selected across five criteria:
- Marketing relevance: Does it connect to the channels marketers actually use?
- Integration depth: How many native connectors, and are the critical ones included?
- Dashboard quality: Can non-technical users build and maintain reports?
- Pricing clarity: Are plans transparent enough to calculate real cost?
- Team fit: Does it suit the team's size and reporting maturity?
Coverage spans agency reporting platforms, free dashboard builders, BI tools, data pipeline tools, and AI-assisted analytics.
TL;DR
- Best overall for agency reporting: Whatagraph offers white-label dashboards, 60+ marketing integrations, and AI-powered reporting for client-facing teams
- Best free option: Looker Studio (now Data Studio) stays free for Google-native reporting
- Best for lightweight KPI tracking: Databox starts free and scales to team dashboards with goal tracking
- Best for email-first client reports: Metrics Watch sends automated reports straight to the inbox
- Best for data pipeline work: Supermetrics or Funnel.io when the problem is inconsistent source data, not the dashboard layer
- Best for enterprise BI: Microsoft Power BI, Tableau, or ThoughtSpot when marketing data needs to sit inside a governed company-wide environment
What is marketing dashboard software?
Marketing dashboard software is a tool that collects campaign, website, CRM, ecommerce, and channel performance data into visual reports marketers use to monitor results and make budget decisions.
The category sounds straightforward, but four different types of tools use the same label:
- Marketing reporting platforms (Whatagraph, DashThis, Metrics Watch): Built specifically for marketing workflows. Fast to set up, agency-friendly, and focused on campaign and channel reporting.
- BI platforms (Microsoft Power BI, Tableau, Domo, ThoughtSpot, Zoho Analytics): Broader analytical tools that handle marketing data alongside finance, operations, and sales. More powerful, more setup required.
- Data pipeline and connector tools (Supermetrics, Funnel.io): Not dashboards themselves, but the plumbing that moves marketing data into wherever dashboards live. Essential when source data is inconsistent.
- KPI dashboard builders (Databox, Klipfolio, Geckoboard, Cyfe): Flexible, often template-driven tools for building shared performance views without full BI overhead.
Key capabilities to look for
- Data connectors for ad platforms, CRM, analytics, ecommerce, and email marketing
- Dashboard templates for channel reporting, funnel performance, and executive scorecards
- Metric blending across multiple sources in a single view
- Scheduled report delivery by email or Slack
- Alerts for pacing issues, anomalies, or performance drops
- White-label and client portal options for agencies
- Governance controls: Metric definitions, permission levels, and source freshness tracking
- AI summaries or natural-language queries, where available
The difference between a marketing dashboard tool and a full BI platform matters most when you're scoping setup time, maintenance, and total cost. A plug-and-play marketing tool gets a team reporting in hours. An enterprise BI rollout can take weeks and require analyst support.
When to use marketing dashboard software
Consolidate cross-channel reporting
When your paid search, paid social, SEO, email, and CRM numbers live in separate platform-native reports, you spend more time reconciling data than acting on it. A marketing analytics dashboard pulls those sources into one view so discrepancies surface before the leadership meeting, not during it. The reporting job here is consistency, not depth.
Automate recurring stakeholder reports
Weekly performance updates, client reports, and board-level scorecards all require the same manual export cycle every time. Automated marketing reports replace that cycle with scheduled delivery. The right tool connects to your sources once, then sends a formatted, branded report on schedule without anyone touching a spreadsheet.
Prove campaign impact on revenue
CAC, ROAS, MQL to SQL conversion, and pipeline generated are the numbers finance and leadership actually care about. Cross-channel analytics that blend ad spend with CRM pipeline data let you defend budget decisions with attribution your CFO will trust, rather than a disconnected set of channel-level metrics.
Marketing dashboard software comparison
Use this table as a shortlist reference. Pricing and G2 ratings were verified in November 2026 from each vendor's live pricing page and G2 listing.
| # | Product | Best for | Key differentiator | Pricing | G2 rating |
|---|---|---|---|---|---|
| 1 | Whatagraph | Agency and client reporting | 60+ integrations, white-label, and AI reporting | From €699/mo (annual) | 4.5/5 |
| 2 | Supermetrics | Data connector workflows | Moves marketing data to BI tools and warehouses | From €39/mo (annual) | 4.4/5 |
| 3 | Databox | KPI scorecards and team dashboards | Free tier plus agentic analytics | Free; paid from $71/mo | 4.4/5 |
| 4 | Looker Studio | Free Google-native dashboards | Free dashboard builder with broad connector library | Free | 4.4/5 |
| 5 | DashThis | Automated agency reports | Templates and scheduled delivery with low learning curve | From $44/mo (annual) | 4.7/5 |
| 6 | Funnel.io | Marketing data hub | 600+ connectors and data harmonization | From $300/mo (annual) | 4.5/5 |
| 7 | Domo | Enterprise operational dashboards | BI plus app-like workflows for large orgs | Custom credit-based pricing | 4.3/5 |
| 8 | Microsoft Power BI | Microsoft-stack teams | Enterprise BI with Copilot and strong modeling | Free account; Pro from $14/user/mo | 4.5/5 |
| 9 | Tableau | Advanced data visualization | Flexible analytics and visual exploration | From $15/user/mo (annual) | 4.4/5 |
| 10 | Klipfolio | Custom KPI dashboards | Metric-focused builder with 130+ integrations | From $120/mo (annual) | 4.5/5 |
| 11 | Zoho Analytics | Zoho ecosystem and SMB teams | Affordable BI with 500+ connectors and AI assistant | Free; paid from $24/mo (annual) | 4.2/5 |
| 12 | Geckoboard | Live KPI wallboards | TV dashboards with real-time data and alerts | From $79/mo (annual) | 4.3/5 |
| 13 | Cyfe | Small teams needing broad coverage | 100+ integrations and prebuilt widget library | From $29/mo | 4.3/5 |
| 14 | Metrics Watch | Email-first client reporting | Automated reports delivered directly to inboxes | From $49/mo | 4.0/5 |
| 15 | ThoughtSpot | AI-assisted analytics | Natural-language search on governed datasets | Essentials from $25/user/mo (annual) | 4.4/5 |
Best 15 marketing dashboard software tools for 2026
1. Whatagraph
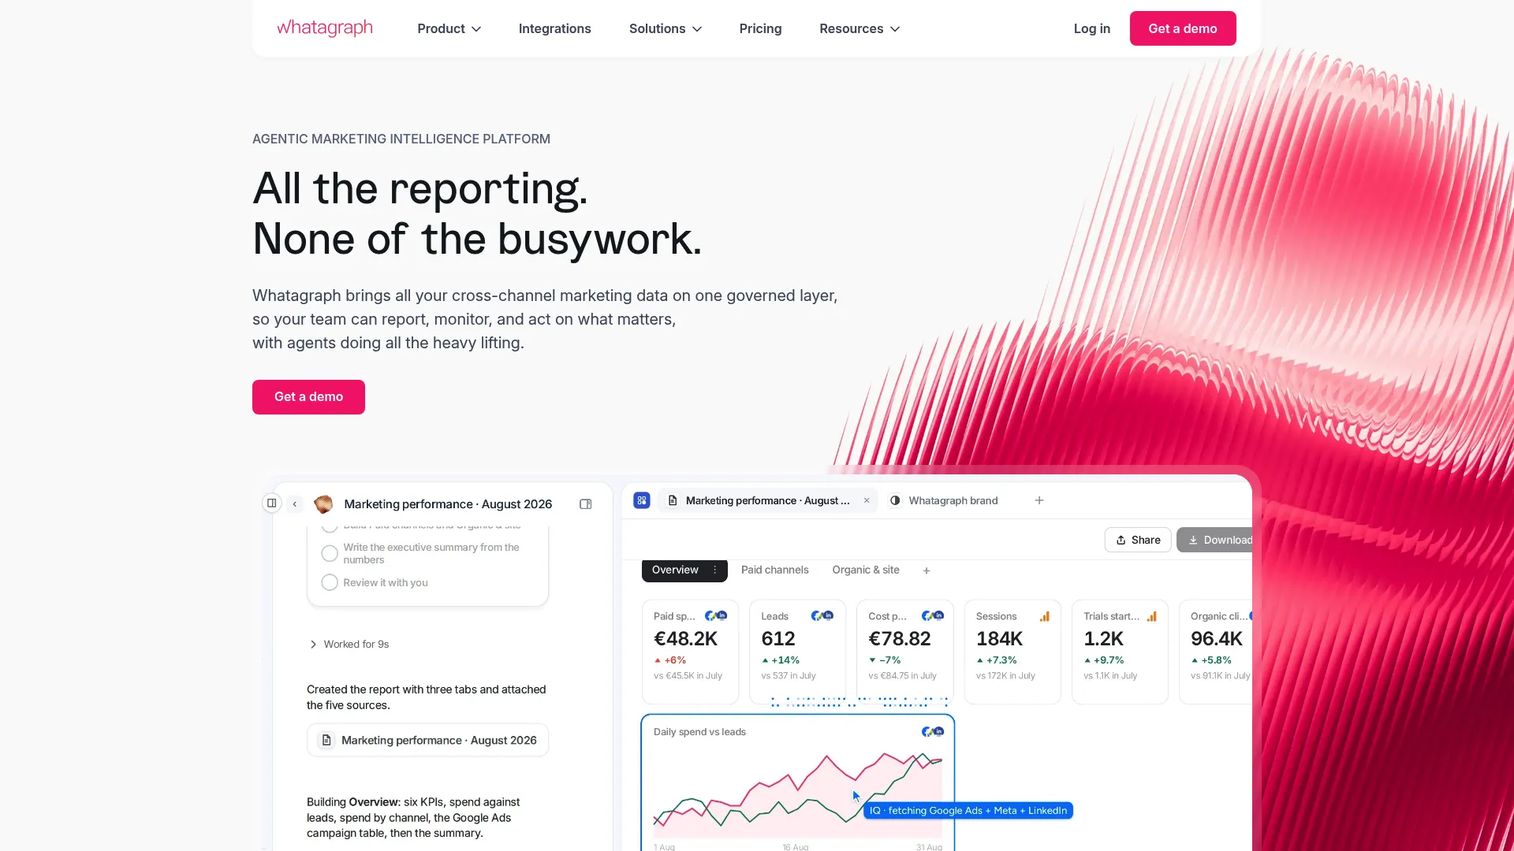
Whatagraph is an agentic marketing intelligence platform built for agencies and enterprise marketing teams that need governed, automated cross-channel reporting. It connects 60+ native marketing data sources, standardizes metrics across platforms, and generates client-ready dashboards without manual cleanup. AI-powered features handle report creation, insights, and chat-based analysis. The platform also exports data to BigQuery and Looker Studio for teams that want both a reporting layer and warehouse access.
Best for: Agencies managing multiple client accounts and enterprise marketing teams that need polished, automated campaign reporting.
Key features
- 60+ native marketing integrations
- No-code data transformations and cross-platform metric blends
- AI-powered report creation, chat, and IQ Agents
- White-label reports, automated email delivery, and password-protected links
- Performance overviews, goals, and anomaly alerts
Why choose Whatagraph: The combination of deep marketing integrations with AI-assisted reporting and white-label output makes it the strongest option when client-facing polish and reporting speed both matter.
Whatagraph pricing: Plans start at €699 per month billed annually (Max tier). The Prime tier is custom and adds features including a custom report domain, public API access, and enterprise SLA. A free trial is not prominently listed; contact Whatagraph directly for trial access.
G2 rating: 4.5/5
2. Supermetrics
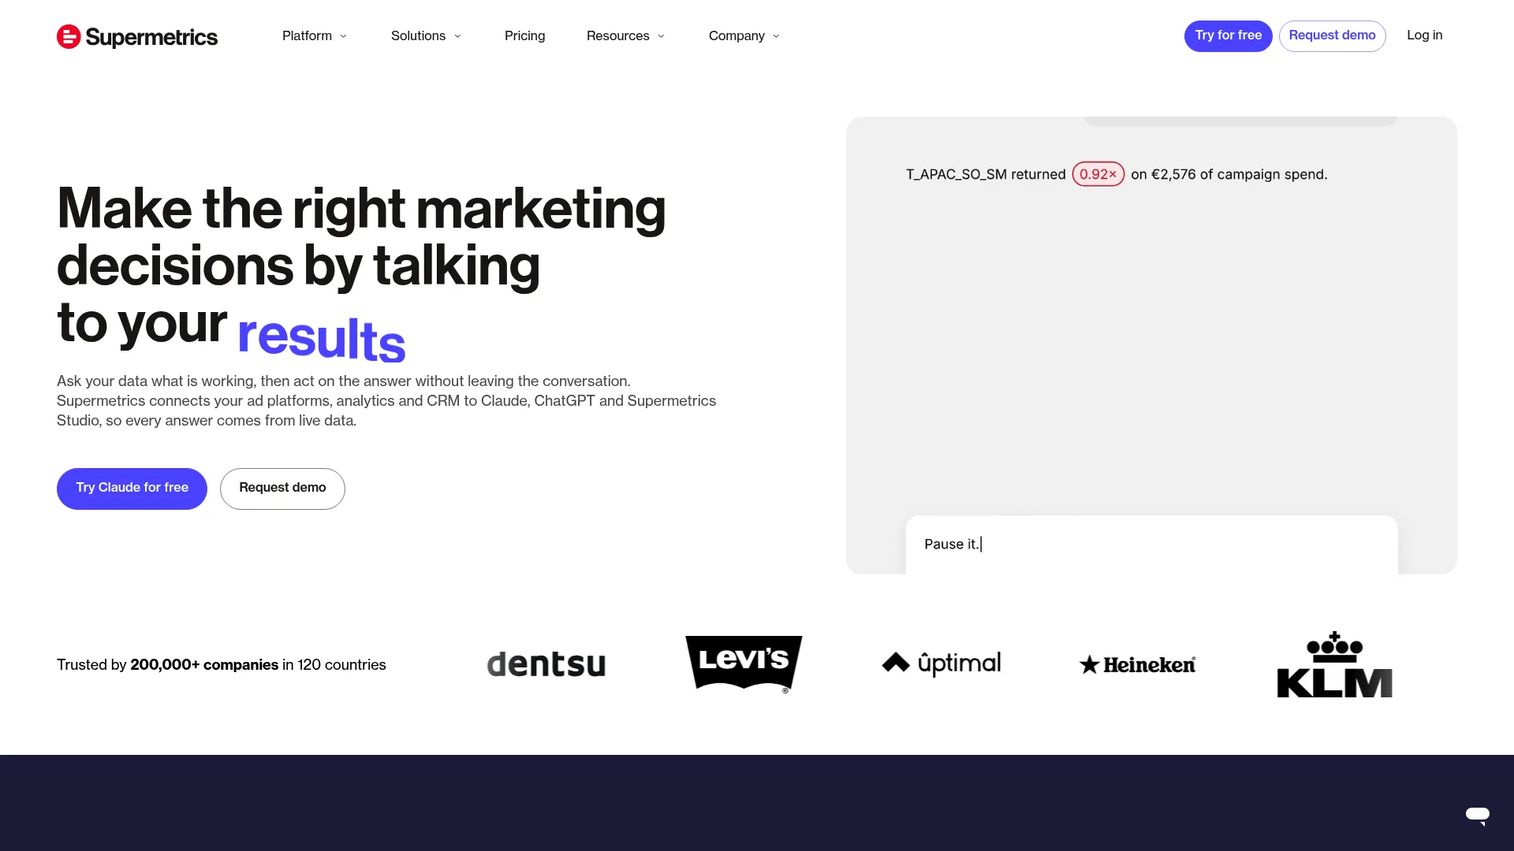
Supermetrics is a marketing intelligence platform that moves data from ad platforms, analytics tools, and CRMs into destinations like Google Sheets, Looker Studio, Excel, Power BI, Snowflake, and BigQuery. It is not a dashboard tool itself. The value is in getting reliable, clean marketing data into whichever reporting layer your team already uses. AI-powered features include analysis through Supermetrics Studio and campaign management via AI chat integrations.
Best for: Marketing operations and analytics teams whose reporting bottleneck is inconsistent or scattered source data rather than a missing dashboard.
Key features
- Marketing data connectors to spreadsheets, BI tools, and warehouses
- Supermetrics Studio for AI-powered dashboard creation
- Scheduled data refreshes and automated pipeline management
- Data warehouse support (Snowflake, BigQuery)
- Custom data import and platform API
Why choose Supermetrics: Choose it when your team already has a preferred reporting destination and needs reliable data pipelines into it. It's the data plumbing layer, not the final report.
Supermetrics pricing: Starter runs €39 per month billed annually (or €52 monthly) and includes one core destination and two data sources. Growth runs €159 per month billed annually (or €199 monthly) and includes seven data sources. Enterprise pricing requires a quote. Pricing is in EUR.
G2 rating: 4.4/5
3. Databox
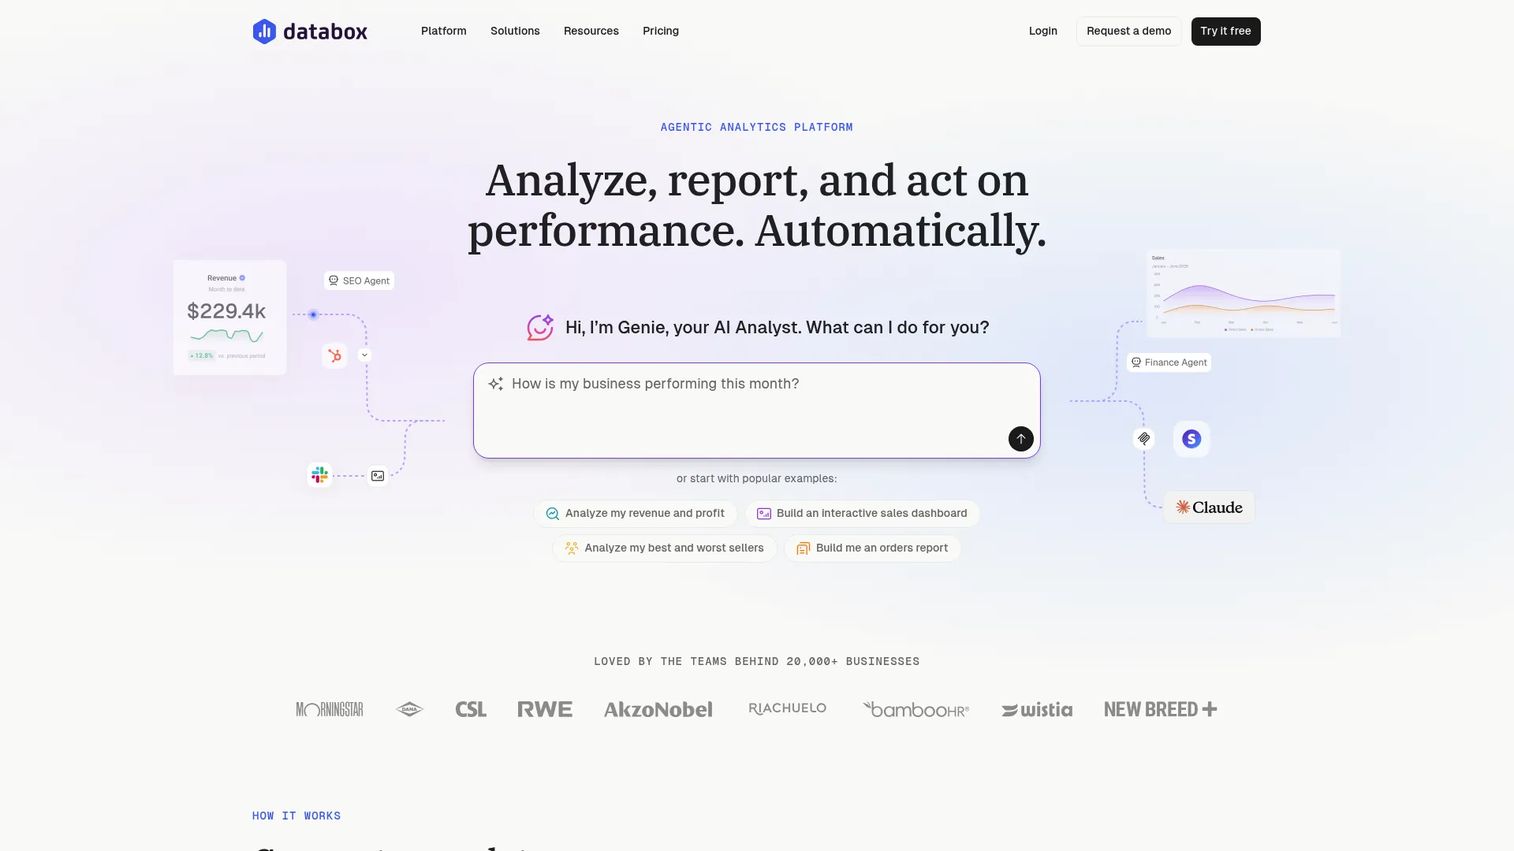
Databox describes itself as an agentic analytics platform that combines business data, metric definitions, dashboards, and automated workflows. It connects 130+ data sources including HubSpot, Salesforce, and GA4, and includes an AI Analyst called Genie for automated performance analysis. Goal tracking, anomaly detection, and mobile dashboard access make it practical for teams that need daily KPI visibility without building custom reports from scratch.
Best for: Teams that need quick-start KPI visibility and goal tracking without the overhead of a full BI implementation.
Key features
- 130+ data integrations including HubSpot, Salesforce, GA4, and Stripe
- Custom and pre-built metrics with a semantic layer
- Dashboards, goals, and anomaly detection
- AI Analyst (Genie), routines, and agentic workflows
- Mobile dashboard access
Why choose Databox: The free tier removes the barrier for small teams, and the agentic workflows add automation that most lightweight KPI tools lack. It fits teams that want to grow into more sophisticated reporting without switching platforms.
Databox pricing: Free plan available with 1 user, 3 data sources, and 50 AI credits per month. Analyst tier starts at $71 per month billed annually. Team Core runs $199 per month (annual) for 3 users and 10 data sources. Agency plans start at $79 per month billed annually plus account packs.
G2 rating: 4.4/5
4. Looker Studio

Looker Studio (now rebranded as Data Studio as of April 2026) is Google's free dashboard and reporting tool. It connects to Google Ads, GA4, Search Console, Google Sheets, BigQuery, YouTube, and a wide range of community connectors. The drag-and-drop editor supports charts, tables, pivot tables, geo maps, and date-range controls. Reports are shareable via link and can be scheduled for email delivery.
Best for: Startups and lean marketing teams already running their stack through Google products who need a free, flexible reporting layer.
Key features
- Free dashboard builder with drag-and-drop editor
- Native Google connectors (Ads, GA4, Search Console, Sheets, BigQuery)
- Community connector ecosystem for third-party sources
- Real-time collaboration and shareable reports
- Scheduled email delivery and dashboard embedding
Why choose Looker Studio: The price is zero for the core product, the Google integrations work without setup friction, and report sharing is fast. For teams outside the Google stack or those needing strict governance, the experience requires more maintenance discipline.
Looker Studio pricing: The core product (Data Studio) is free. Some third-party community connectors carry separate fees.
G2 rating: 4.4/5
5. DashThis
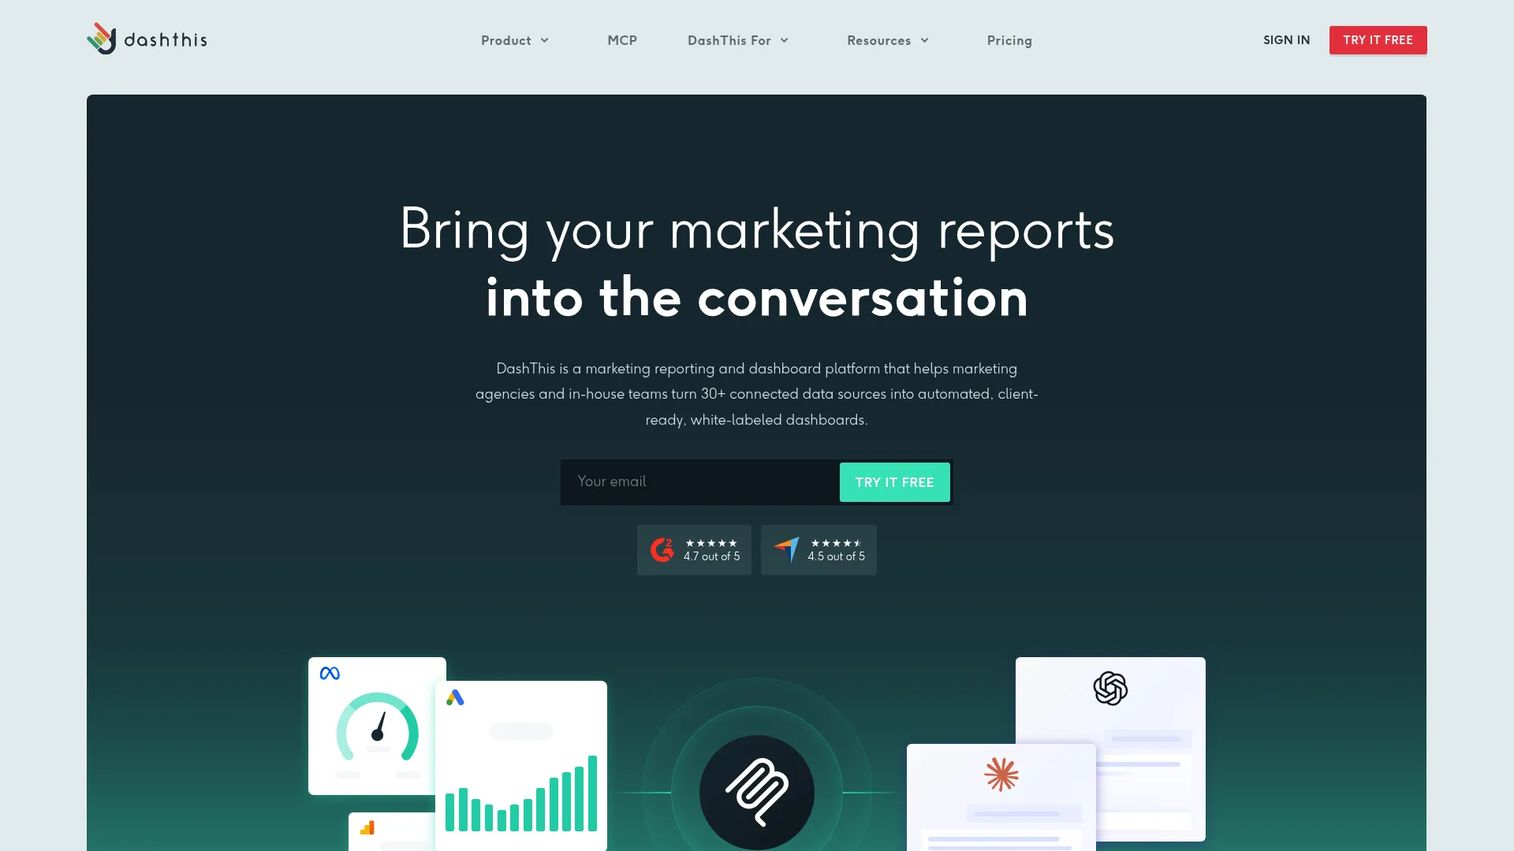
DashThis is marketing reporting software that automates the process of turning multi-platform data into client-ready dashboards. It includes 30+ marketing integrations, pre-built report templates, calculated widgets, and AI Insights for automated analysis. White-label branding, custom domains, and scheduled PDF delivery make it a practical choice for agencies that run recurring reports across many accounts.
Best for: Agencies and marketing consultants that need recurring client reports built quickly with minimal technical setup.
Key features
- 30+ marketing integrations and CSV import
- AI Insights: Preset analysis and dashboard chat mode
- Dashboard templates and drag-and-drop editing
- White-label branding, custom domains, and PDF export
- Scheduled email delivery for automated report delivery
Why choose DashThis: It prioritizes speed from data connection to shareable report over deep custom modeling. If you run the same reporting workflow for multiple clients each month, DashThis reduces that cycle more than a general-purpose BI tool would.
DashThis pricing: Individual plan starts at $44 per month billed annually ($54 monthly). Professional runs $139 per month annually. Business runs $279 per month annually. Standard runs $429 per month annually. All plans include unlimited users and integrations. A 14-day free trial with 10 dashboards is available.
G2 rating: 4.7/5
6. Funnel.io
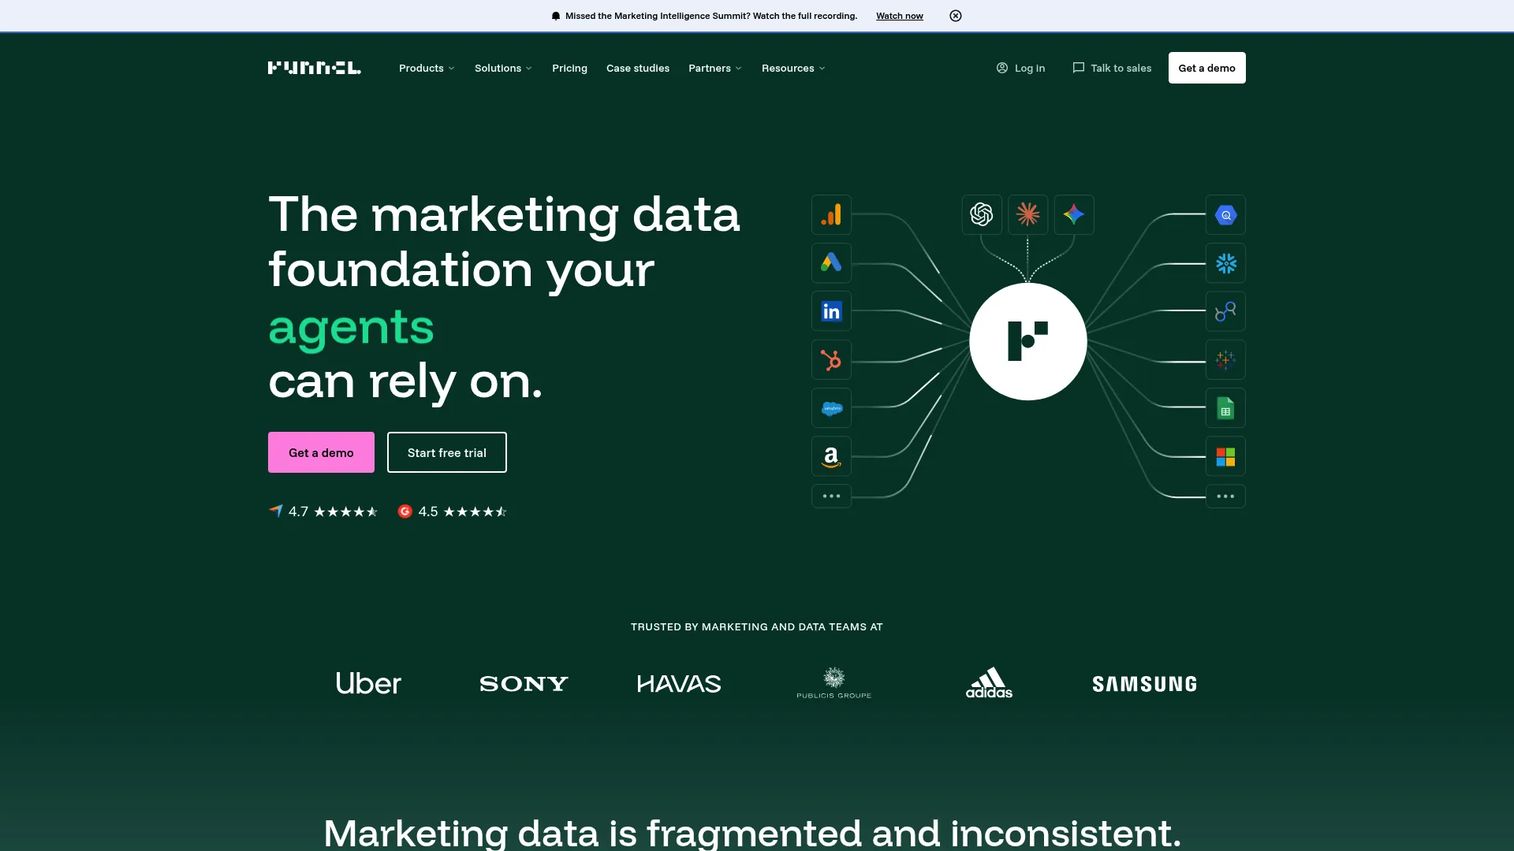
Funnel.io is a marketing data platform focused on centralizing, harmonizing, and exporting marketing data before it reaches dashboards. With 600+ connectors and built-in data transformation capabilities, it handles the normalization work that breaks most cross-channel reporting: Currency conversion, inconsistent naming conventions, and cost data discrepancies across platforms. Funnel AI and MCP integrations support downstream analysis. The platform also includes marketing mix modeling and attribution measurement features.
Best for: Marketing teams with many paid media sources whose reporting problems stem from inconsistent input data rather than a missing visualization layer.
Key features
- 600+ marketing data connectors
- Data harmonization and currency conversion
- Destination exports to dashboards and warehouses
- Funnel AI and MCP integrations
- Marketing mix modeling and multi-touch attribution
Why choose Funnel.io: When ROAS numbers don't match across platforms because naming conventions, currency handling, or attribution windows differ, Funnel.io fixes the data before it reaches any report. It works best paired with a downstream BI or dashboard tool.
Funnel.io pricing: Starter plan starts from $300 per month billed annually. Business plan starts from $600 per month billed annually. Enterprise pricing is custom. A 14-day free trial is available.
G2 rating: 4.5/5
7. Domo
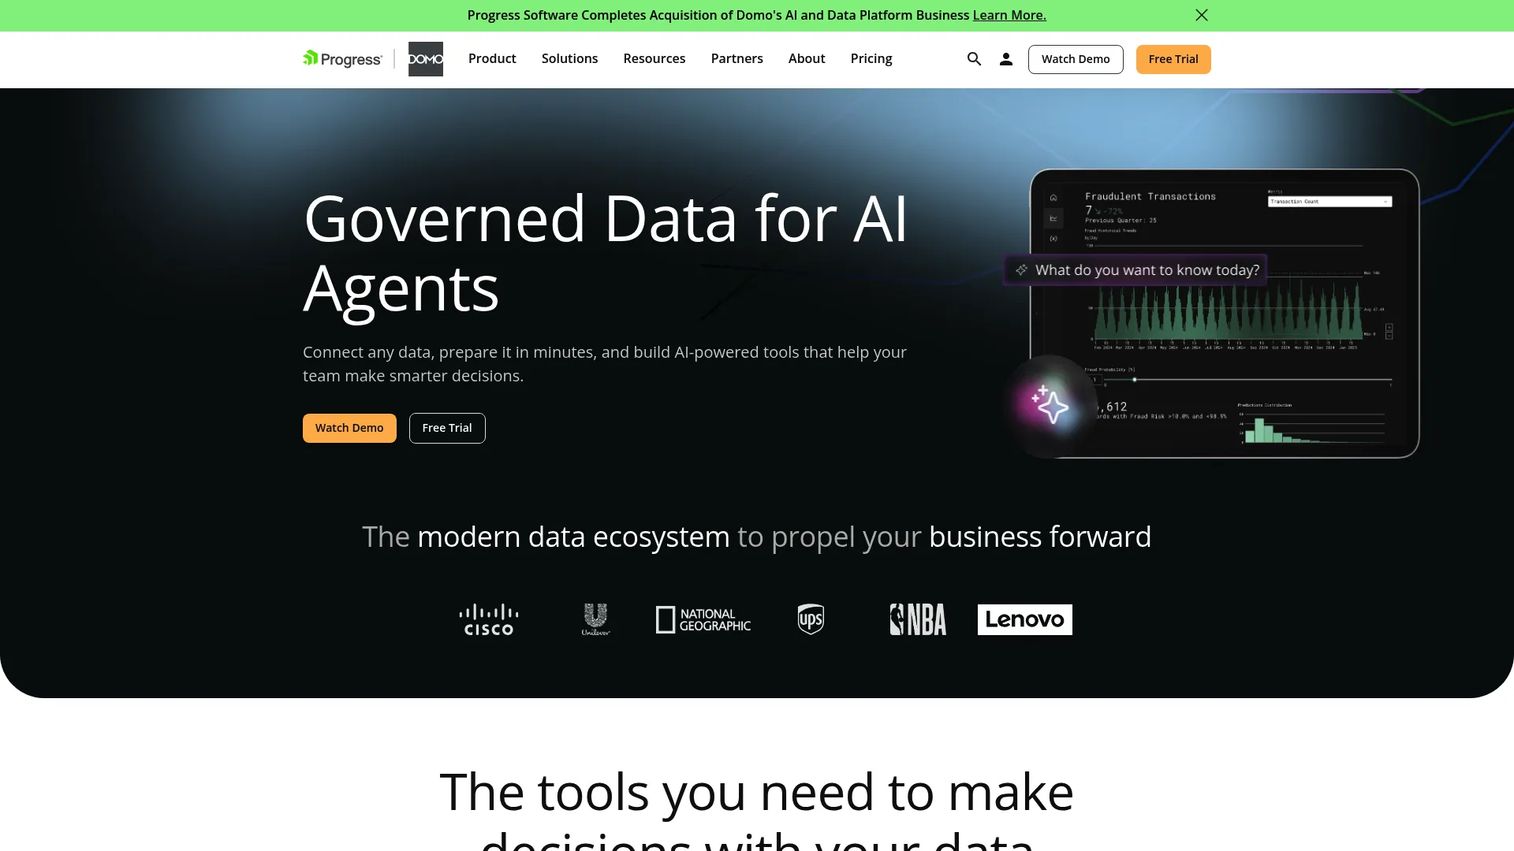
Domo is a cloud BI platform that combines data integration, interactive dashboards, embedded analytics, low-code app creation, and AI agents in one environment. It connects 1,000+ data sources via pre-built connectors and supports Magic ETL and SQL DataFlows for data transformation. Enterprise governance, security controls, and SSO make it appropriate for organizations where marketing reporting cannot sit separately from finance and operations data.
Best for: Mid-market and enterprise organizations that need marketing dashboards connected to company-wide data, governance requirements, and cross-functional workflows.
Key features
- 1,000+ pre-built data connectors
- Interactive dashboards, visualizations, and scheduled reports
- Embedded analytics and low-code app creation
- Domo AI, machine learning, and AI agents
- Enterprise governance, permissions, SSO, and encryption
Why choose Domo: Strong when marketing data needs to coexist with operational, sales, and financial data in a governed environment. The app-building layer also makes it useful for custom workflows beyond standard reporting.
Domo pricing: Domo uses consumption-based credit pricing; no standard per-seat price is published. A 30-day free trial with full platform access and unlimited users is available. Contact sales for a custom quote.
G2 rating: 4.3/5
8. Microsoft Power BI
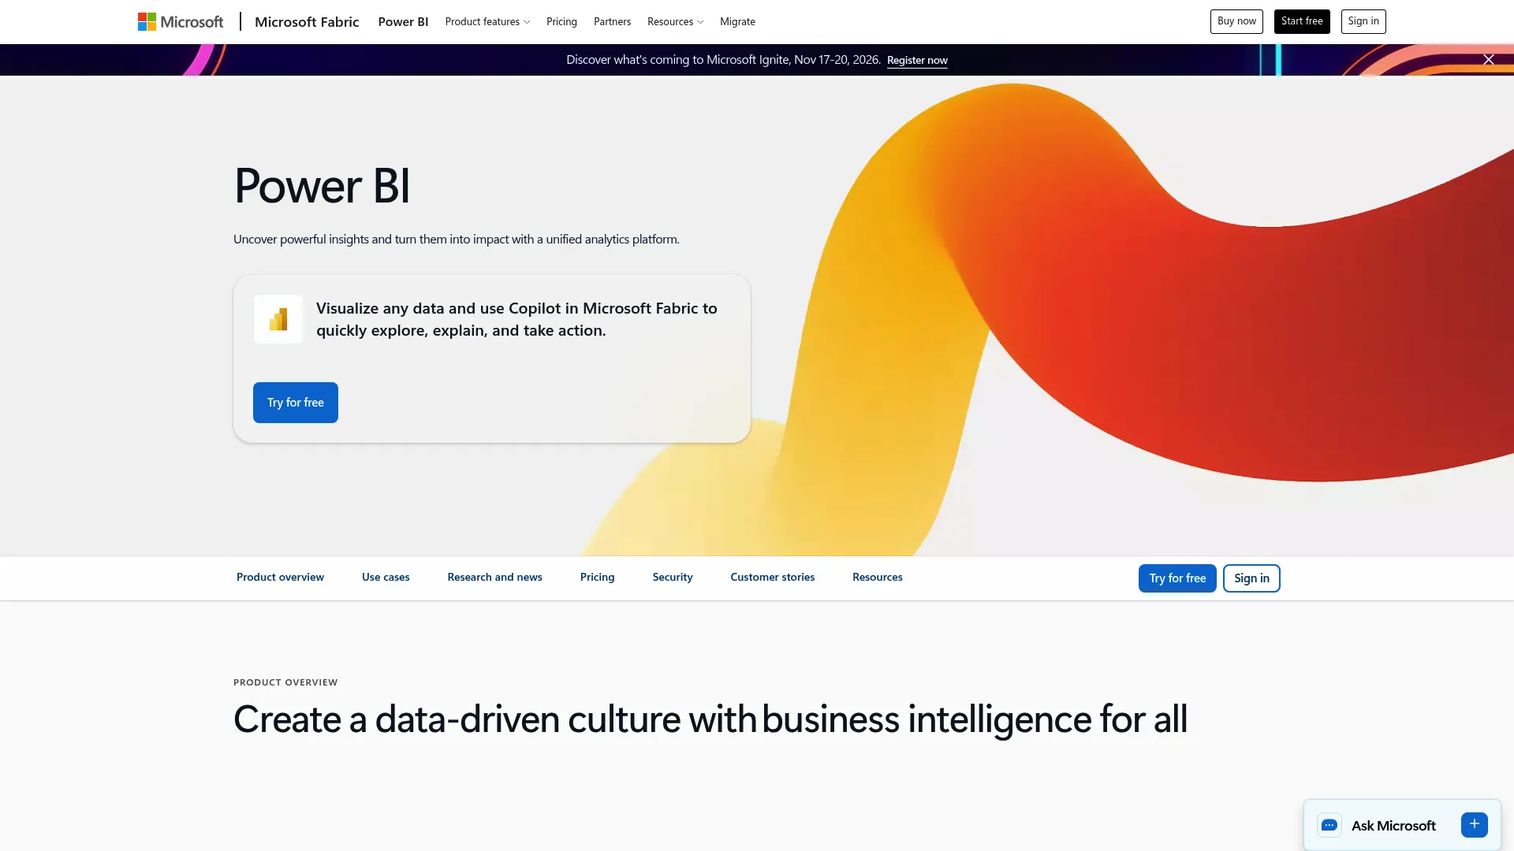
Microsoft Power BI is a unified business intelligence and analytics platform for building interactive dashboards and AI-assisted reports. It integrates tightly with Microsoft 365, Azure, Excel, Teams, and SQL Server, making it the natural reporting layer for organizations already running that infrastructure. Power Query handles data transformation. Copilot-powered natural-language analysis and report generation reduce the analyst dependency for routine reporting questions.
Best for: Enterprise and mid-market teams with Microsoft-heavy infrastructure and an analytics or BI function to support setup and governance.
Key features
- Interactive data visualization and dashboard reporting
- Connections to cloud, on-premises, and Microsoft data sources
- Power Query for data transformation
- Copilot-powered natural-language analysis and report generation
- Enterprise-scale modeling and governance
Why choose Microsoft Power BI: The Microsoft integration depth is the primary argument. If revenue reporting already runs through Azure or Excel, Power BI centralizes marketing data alongside those existing flows without requiring a parallel reporting stack.
Microsoft Power BI pricing: A free account is available for creating personal reports. Power BI Pro costs $14 per user per month billed annually. Power BI Premium Per User costs $24 per user per month billed annually. Power BI Embedded pricing varies by capacity.
G2 rating: 4.5/5
9. Tableau
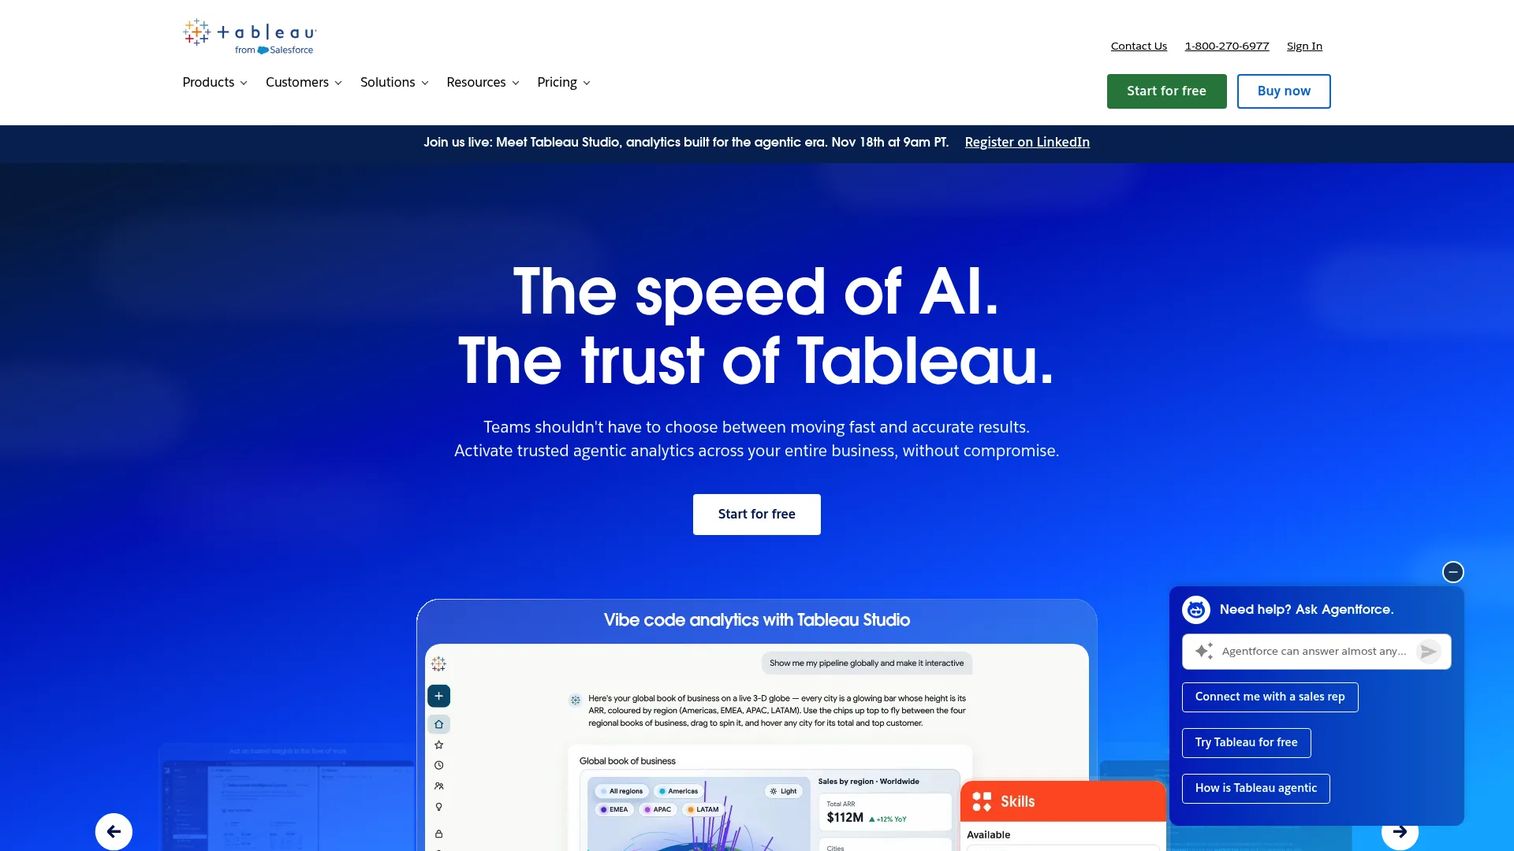
Tableau is an analytics platform built for interactive visualization, flexible data exploration, and scalable dashboard sharing. Tableau Prep Builder handles data preparation. Tableau Pulse delivers metric summaries and insights. Tableau Agent supports AI-assisted authoring and data exploration. The platform suits marketing teams with complex segmentation needs or executive reporting requirements that go beyond standard templates.
Best for: Data-mature marketing teams with analyst support that need deeper visualization and exploratory analytics than campaign-focused reporting tools provide.
Key features
- Advanced interactive dashboards and visual analytics
- Data preparation with Tableau Prep Builder
- Tableau Pulse metrics and insight summaries
- AI-assisted authoring and exploration with Tableau Agent
- Governance controls and enterprise dashboard sharing
Why choose Tableau: The visualization flexibility and analyst-grade data exploration make it the right call when standard marketing dashboard templates aren't enough. It requires more governance overhead than plug-and-play reporting tools.
Tableau pricing: Tableau Cloud Standard starts at $15 per user per month billed annually. Enterprise starts at $35 per user per month billed annually. Creator, Explorer, and Viewer license tiers are priced separately within each edition. A free public tier (Tableau Public) is available for creating publicly shared visualizations.
G2 rating: 4.4/5
10. Klipfolio
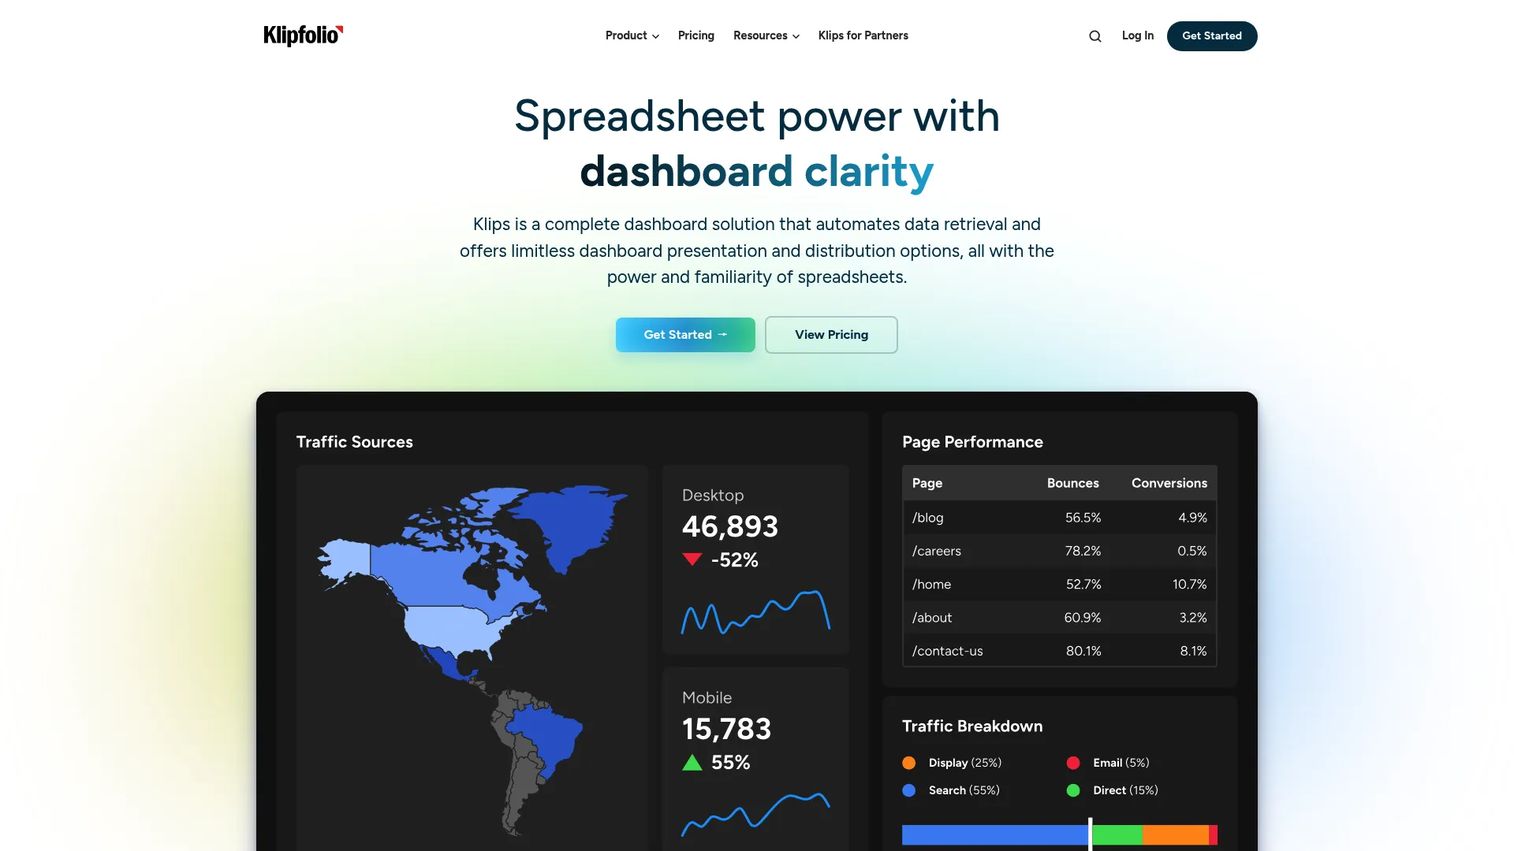
Klipfolio is cloud-based dashboard and BI software for building live, metric-driven analytics. It supports both grid and free-form dashboard layouts with 30+ chart types and 130+ data integrations covering databases, APIs, spreadsheets, and REST services. Data modeling, joining, filtering, and transformation capabilities give marketing analysts control over how metrics are calculated and presented without requiring a full BI environment.
Best for: Teams that want flexible custom KPI dashboards and recurring metric views without the full scope of an enterprise BI rollout.
Key features
- Custom dashboard builder with grid and free-form layouts
- 130+ data integrations including databases, APIs, and spreadsheets
- Data modeling, joining, filtering, and transformation
- Published links, embedded dashboards, and scheduled PDF/image reports
- Role-based access controls
Why choose Klipfolio: The balance between flexibility and accessibility makes it useful for marketing analysts who want to own their metric definitions without depending on a centralized data team. The 14-day free trial lets you test connector coverage before committing.
Klipfolio pricing: Base plan starts at $120 per month billed annually, scaling to $600 per month on higher tiers. A 14-day free trial is available.
G2 rating: 4.5/5
11. Zoho Analytics
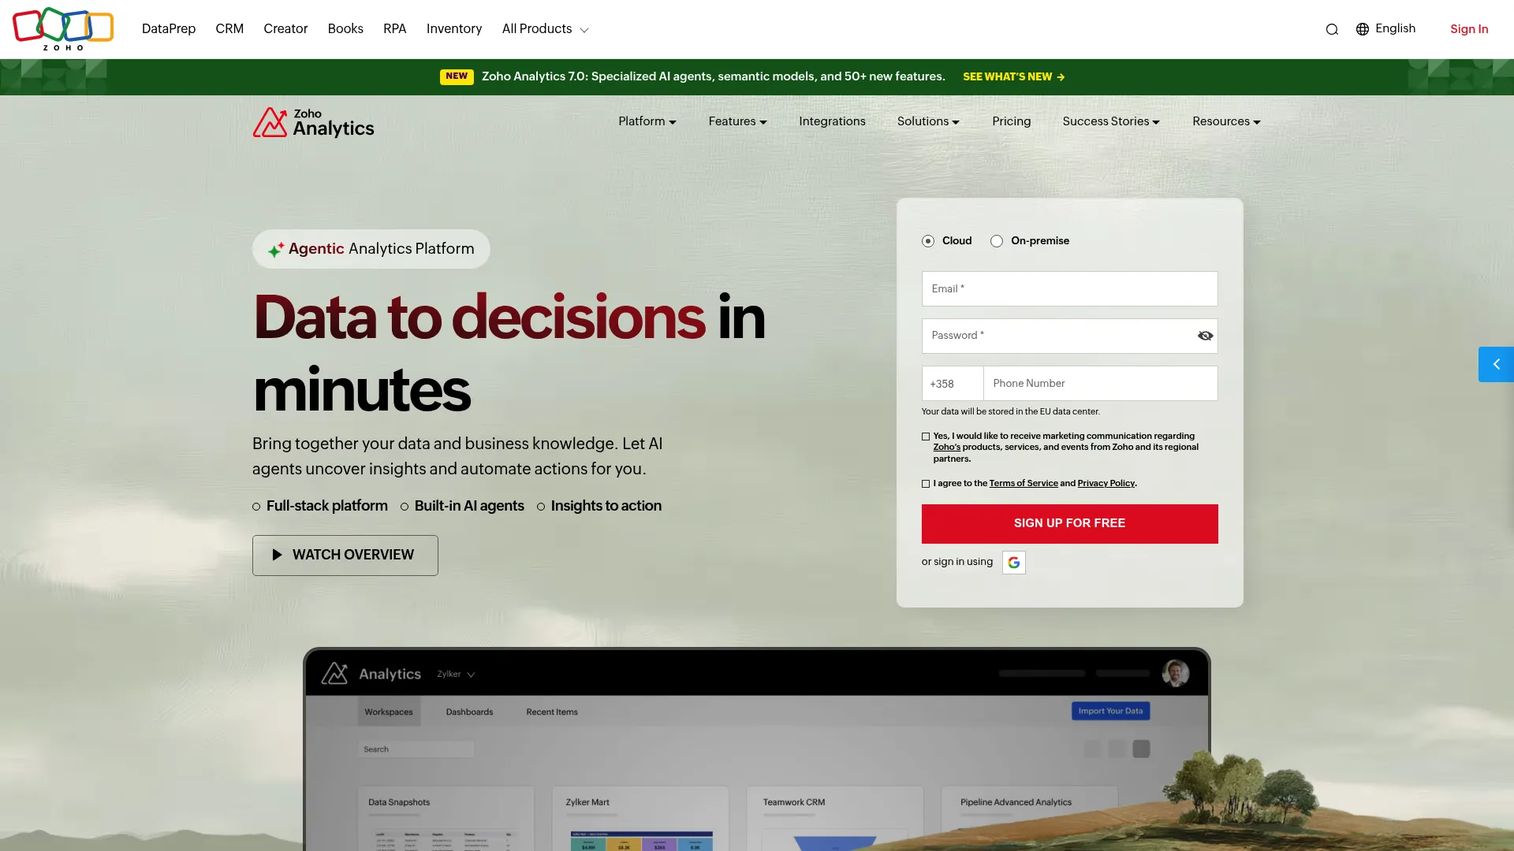
Zoho Analytics is an AI-assisted self-service BI platform that connects to 500+ data sources including Zoho CRM, Zoho Books, and external databases. It supports data pipelines, 250+ transformation functions, 50+ visualization types, and AI-assisted analysis through Ask Zia. The platform covers forecasting, anomaly detection, what-if analysis, and sharing with fine-grained access control. For teams whose sales and marketing stack already runs through Zoho, it removes the need for a separate reporting tool.
Best for: SMBs and teams running their marketing and sales operations on Zoho apps who want affordable BI without a separate platform.
Key features
- 500+ data source connectors including Zoho CRM, Zoho Books, and external databases
- AI-assisted analysis with Ask Zia, forecasting, and anomaly detection
- 50+ visualization types and interactive dashboards
- Data pipelines with 250+ transformation functions
- Sharing, embedding, and fine-grained access controls
Why choose Zoho Analytics: The price point is the clearest argument. For a Zoho-native team, the integrations work without connector fees, and the free tier lets small teams start without a subscription.
Zoho Analytics pricing: Free plan supports 2 users and 10,000 rows. Basic starts at $24 per month billed annually. Standard runs $48 per month annually. Premium runs $115 per month annually. Enterprise runs $455 per month annually.
G2 rating: 4.2/5
12. Geckoboard
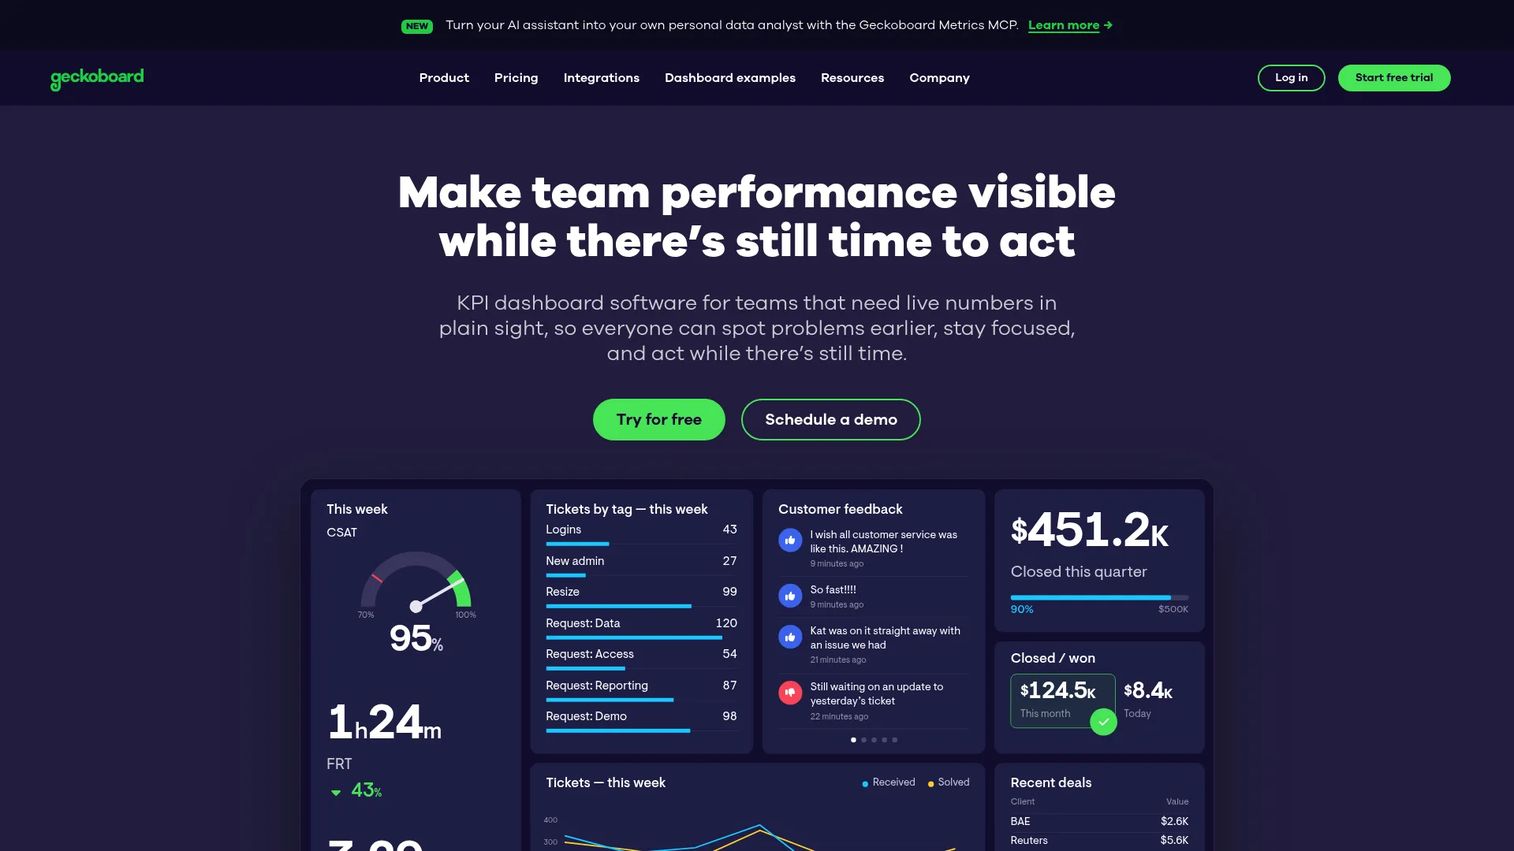
Geckoboard is real-time dashboard software designed to make live performance metrics visible across team displays, Slack, email, and shared links. It connects 90+ data sources including Salesforce, HubSpot, Zendesk, and Google Sheets. TV wallboards with remote screen management make it practical for sales floors and marketing operations rooms that need always-on visibility into key numbers. Real-time KPI alerts fire via Slack or Microsoft Teams when thresholds are crossed.
Best for: Teams that want live KPI dashboards displayed prominently and updated continuously rather than a weekly reporting document.
Key features
- Customizable real-time dashboards with drag-and-drop widgets
- 90+ integrations including Salesforce, HubSpot, and Zendesk
- TV wallboards with remote screen management
- Real-time KPI alerts via Slack and Microsoft Teams
- Goals, status indicators, leaderboards, and scheduled snapshots
Why choose Geckoboard: The TV display capability and real-time update frequency make it the right tool when dashboards need to be visible all day, not opened on demand. It's not built for deep attribution work or complex segmentation.
Geckoboard pricing: Essentials plan starts at $79 per month billed annually and includes 2 dashboards, 1 editor, and 1 screen. Performance runs $319 per month annually and includes 20 dashboards, 3 editors, and 5 screens, plus alerts and drilldowns. Enterprise pricing is custom.
G2 rating: 4.3/5
13. Cyfe
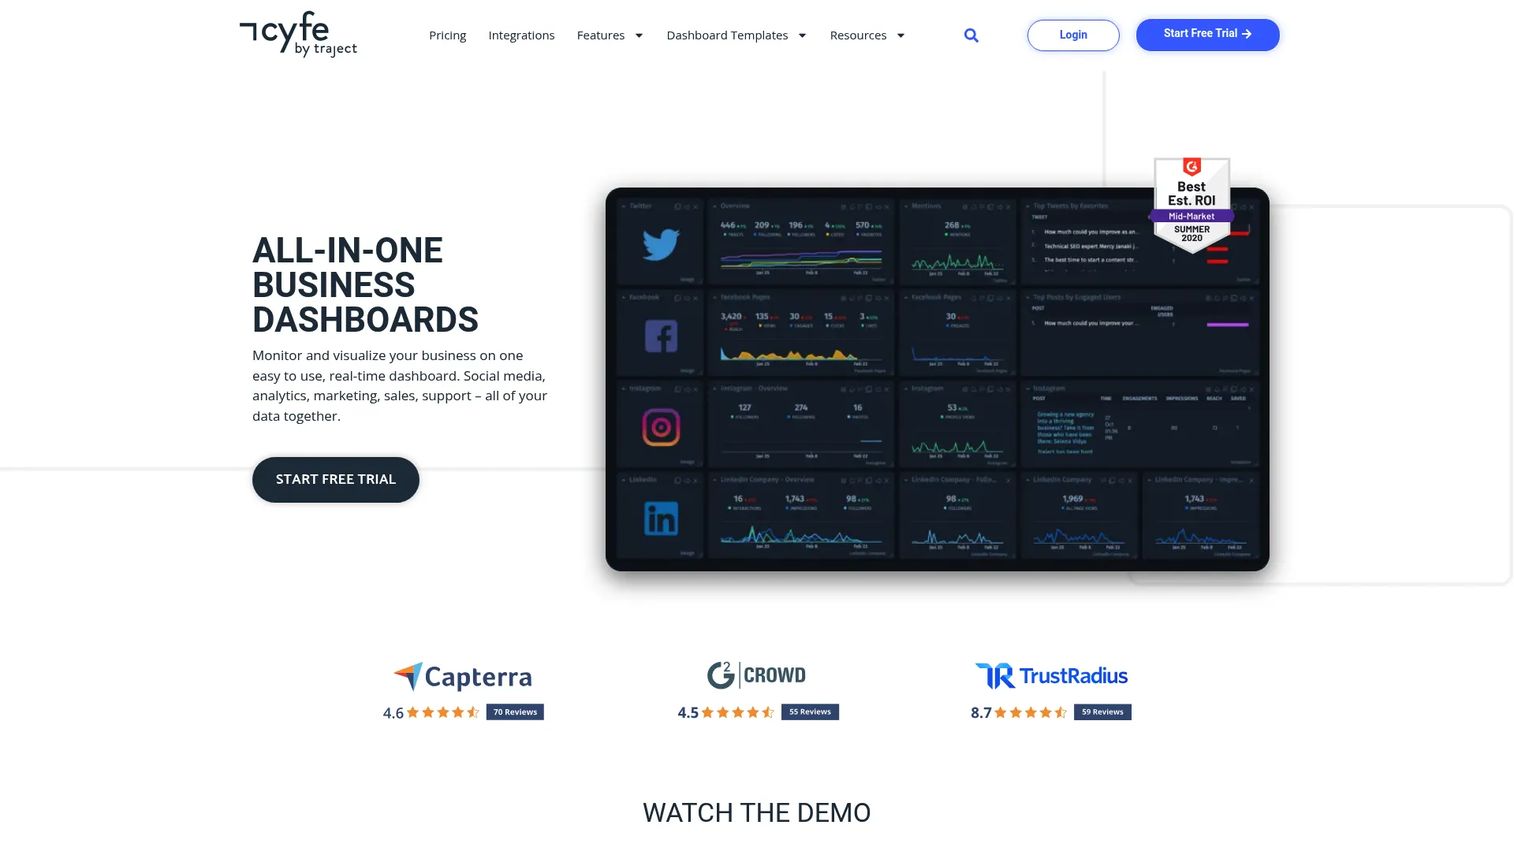
Cyfe is an all-in-one business dashboard platform with 100+ integrations and 250+ pre-built metrics covering marketing, social media, sales, web analytics, and support. Its Push API accepts custom data, and the TV Mode option makes dashboards display-ready. White-label dashboards and custom URLs support agency and client-facing reporting. Data mashups and historical data storage let small teams track trends without building a data warehouse.
Best for: Small marketing teams and founders who need broad channel coverage in one place without the overhead of a BI platform.
Key features
- 100+ integrations and 250+ pre-built metrics
- Custom widgets and Push API for external data
- White-label dashboards and custom URLs
- Scheduled reports and data exports
- TV Mode and email/SMS widget alerts
Why choose Cyfe: The breadth of pre-built widgets means a generalist marketer can get a cross-channel view running quickly. For teams with complex attribution requirements, the depth runs thin, but for simple operational visibility it's cost-effective.
Cyfe pricing: Starter plan is $29 per month (2 dashboards, 1 user). Standard runs $39 per month (5 dashboards, 2 users). Pro runs $65 per month. Premier runs $119 per month. Agency runs from $190 per month. A 14-day free trial is available.
G2 rating: 4.3/5
14. Metrics Watch
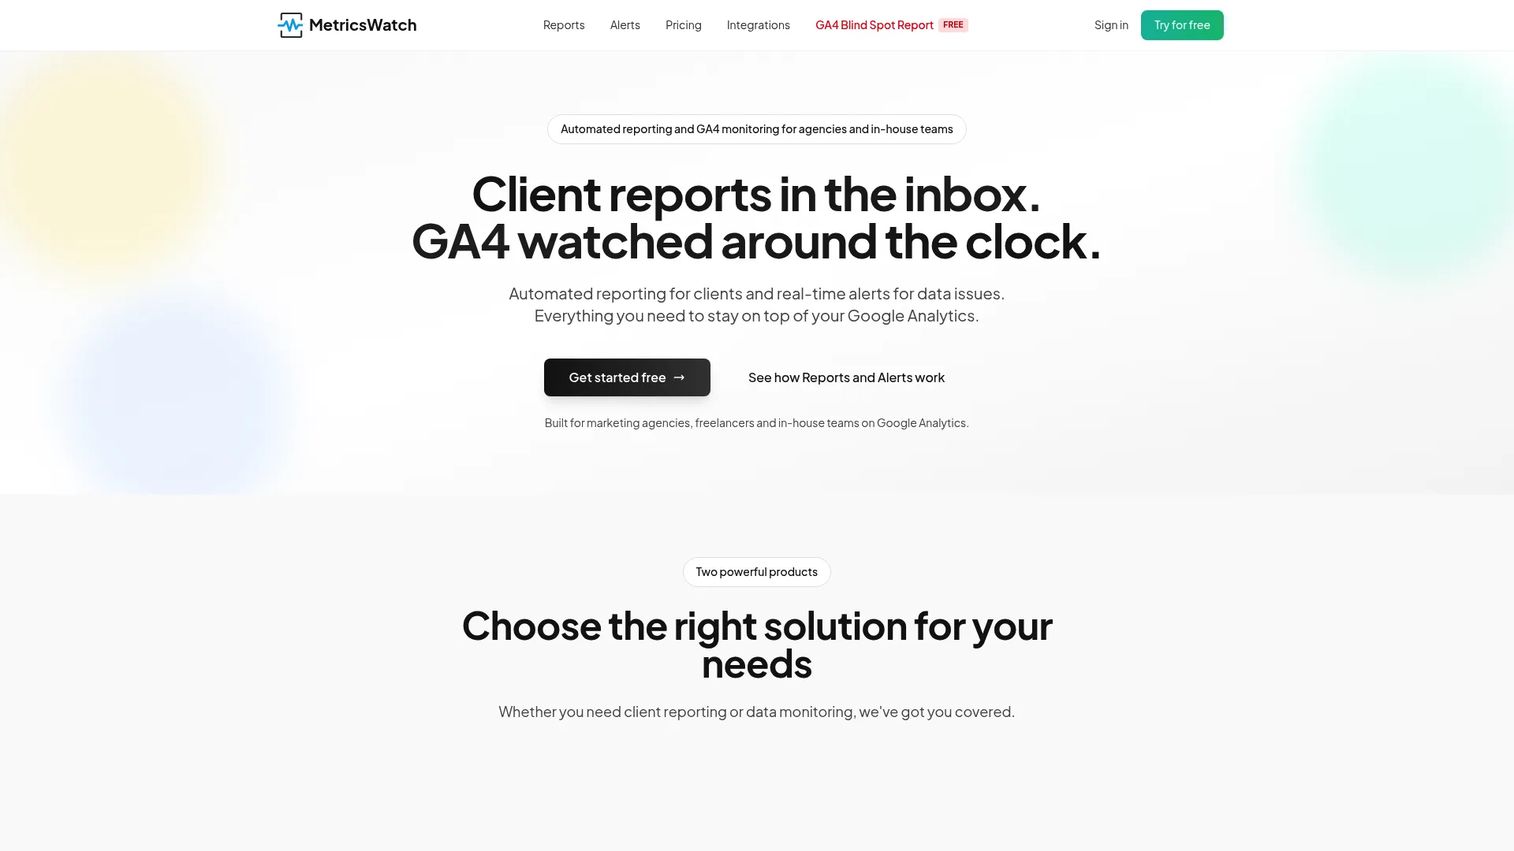
Metrics Watch is automated marketing reporting software that delivers reports directly to inboxes rather than requiring stakeholders to log into a dashboard. It consolidates multi-source marketing data into customizable email templates, supports GA4 anomaly monitoring with threshold-based alerts, and handles scheduled daily, weekly, or monthly delivery. White-label options make it appropriate for agency client reporting where the audience will not interact with a web interface.
Best for: Agencies and consultants whose clients read reports in email and will not reliably log into a separate dashboard platform.
Key features
- Automated email reports delivered daily, weekly, or monthly
- Multi-source marketing data consolidation
- GA4 anomaly monitoring with threshold alerts
- Customizable templates with white-label options
- Slack notification support for GA4 alerts
Why choose Metrics Watch: When the report consumption problem is adoption rather than data quality, delivering the report to where people already are (their inbox) solves it without requiring training. The dual product line covers both reporting and monitoring in one subscription.
Metrics Watch pricing: Reports plans start at $49 per month (Startup), $149 per month (Pro), and $399 per month (Agency). Alerts plans run separately: Basic at $79 per month, Starter at $99 per month, Professional at $299 per month. Enterprise uses custom pricing. A 14-day free trial is available with no credit card required.
G2 rating: 4.0/5
15. ThoughtSpot
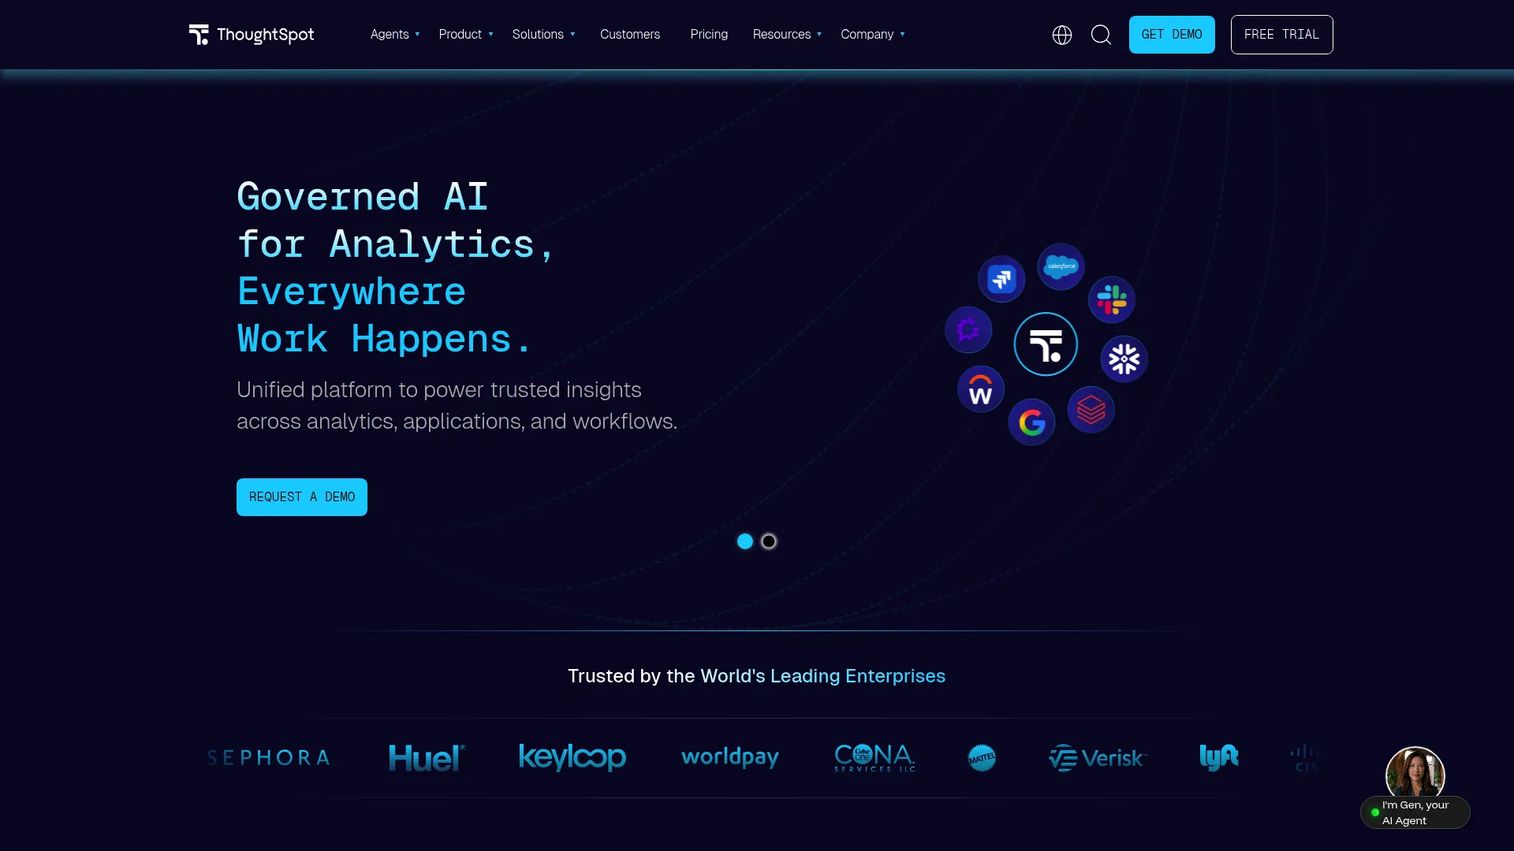
ThoughtSpot is an AI-powered analytics platform that lets users explore data through natural-language search rather than writing SQL or building traditional reports. AI agents handle analytics, modeling, visualization, and coding tasks. Dynamic Liveboards deliver interactive dashboards. Automated KPI monitoring and anomaly detection run continuously across governed datasets. Embedded analytics APIs and SDKs support customer-facing analytics builds.
Best for: Data-mature enterprise marketing teams that want natural-language self-serve analytics on clean, governed datasets without waiting on analyst capacity.
Key features
- Natural-language search and data exploration
- AI agents for analytics, modeling, and visualization
- Dynamic Liveboards and interactive dashboards
- Automated KPI monitoring and anomaly detection
- Embedded analytics via APIs and SDKs
Why choose ThoughtSpot: When the bottleneck is analyst time and the data foundation is already governed and clean, ThoughtSpot lets marketers ask complex questions directly. Without a solid data foundation, the natural-language layer surfaces inconsistent answers.
ThoughtSpot pricing: Essentials plan starts at $25 per user per month billed annually. Pro uses consumption-based credit pricing at $0.10 per credit. Developer plan is free for one year. Enterprise and Embedded Enterprise use custom pricing.
G2 rating: 4.4/5
Considerations when choosing marketing dashboard software
Start with the reporting job
A weekly client report, a live team KPI board, and an enterprise attribution dashboard require fundamentally different tools. Identify the primary reporting job before evaluating features. An agency producing 20 monthly client reports needs white-label templates and scheduled delivery. A demand gen team proving pipeline impact to a CFO needs attribution blending and CRM integration.
Check the integrations before the demo
A missing connector creates manual spreadsheet work, which eliminates the reason for buying a dashboard tool in the first place. Verify that the tool connects natively to your specific sources: Google Ads, Meta Ads, LinkedIn Ads, TikTok Ads, GA4, HubSpot, Salesforce, Shopify, Mailchimp, and Klaviyo are the most common requirements. Community or partner connectors often carry separate fees and have slower refresh rates than native connectors.
Audit your metric definitions first
CAC, ROAS, and pipeline generated break when teams blend sources without aligning attribution windows, naming conventions, and currency handling. Before selecting a tool, write down how each key metric is calculated, which data source owns it, and how conflicts between sources will be resolved. A dashboard tool will not fix a data governance problem; it will just make the disagreements more visible.
Price the full reporting workflow
The base subscription is rarely the total cost. Add connector fees for third-party integrations, viewer seats for stakeholders who only consume reports, client portal access if you're running an agency, and any warehouse costs for tools that require a destination. Factor in internal setup and maintenance time, which scales with dashboard complexity and release cadence.
Decide who owns the dashboard
Dashboards decay without named ownership. Assign one person to maintain metric definitions as the product and campaigns change, one person to update templates when sources shift, and one reviewer to verify executive reporting accuracy before distribution. Without that structure, dashboards become a source of confusion rather than confidence.
Conclusion
The right marketing dashboard software depends on the reporting job and the team's existing infrastructure.
For agency and client reporting, Whatagraph and DashThis offer the fastest path from data connection to shareable, branded output. Metrics Watch covers the specific case where clients read reports in email rather than logging in.
For cross-channel data quality, Supermetrics and Funnel.io sit upstream of dashboards, normalizing data before it hits any visualization layer. Both are more useful when the problem is inconsistent source data than when the problem is a missing chart.
Looker Studio remains the strongest free option for Google-native stacks. Databox and Klipfolio fit teams that want flexible KPI tracking without full BI overhead. Geckoboard and Cyfe cover teams that need broad, always-visible metric displays.
For enterprise reporting connected to company-wide data, Microsoft Power BI, Tableau, Domo, Zoho Analytics, and ThoughtSpot each bring different strengths: Microsoft stack fit, visualization depth, operational workflow integration, Zoho ecosystem value, and AI-assisted exploration, respectively.
Pick by reporting job first, then verify integrations, then calculate total cost.
Once your dashboard tells you which campaigns are driving results, the next job is showing prospects the product experience behind those clicks. Guideflow helps marketing teams create interactive product demos for landing pages, campaigns, nurture emails, and sales follow-up, so clicks turn into qualified pipeline rather than bounced page views.
Start your journey with Guideflow today!
FAQs about marketing dashboard software
There isn't a single best tool across all teams. Whatagraph and DashThis are the strongest picks for agencies that need client-ready, automated reporting. Looker Studio is the best free option for Google-heavy stacks. Microsoft Power BI and Tableau suit enterprise teams with analyst support. Databox and Klipfolio work well for mid-market teams tracking KPIs without a full BI rollout.
Marketing dashboard software consolidates campaign, website, CRM, ecommerce, and paid media data into visual reports. Teams use it for cross-channel performance tracking, weekly stakeholder reporting, campaign pacing, budget allocation decisions, and attribution analysis connecting ad spend to pipeline and revenue.
A complete marketing performance dashboard covers spend and ROAS by channel, CPA, CAC, MQL to SQL conversion, pipeline generated, revenue influenced, and traffic by source. Executive dashboards typically add payback period and LTV:CAC. Client-facing dashboards usually focus on campaign-level metrics with channel-specific comparisons.
Looker Studio works well for teams whose primary data lives in Google Ads, GA4, Google Search Console, and Google Sheets. As the reporting stack grows to include CRM, paid social, ecommerce, and email platforms, maintaining the connector setup and dashboard governance becomes more demanding. Teams typically add paid connectors or move to a dedicated marketing reporting tool as reporting complexity increases.
Marketing dashboard tools are purpose-built for campaign and channel reporting. They set up faster, require less technical expertise, and optimize for the specific metrics marketers care about. BI platforms like Tableau, Domo, and ThoughtSpot are broader analytical environments designed for company-wide data modeling, governed datasets, and complex cross-functional queries. BI platforms offer more analytical depth; marketing dashboard tools offer faster time to a shareable report.
Pricing models vary significantly across the category. Free tools (Looker Studio, Zoho Analytics free tier, Databox free tier) exist at one end. Per-user BI platforms like Tableau start at $15 per user per month. Agency-focused tools like DashThis start around $44 to $54 per month. Connector platforms like Funnel.io start at $300 per month. Enterprise platforms like Whatagraph and Domo use custom or consumption-based pricing. Total cost scales with connector count, user seats, client portals, and warehouse requirements.
Agencies typically build one dashboard template per reporting type (paid media, SEO, email, full-funnel), connect client data sources once, and schedule automated delivery weekly or monthly. White-label options let them brand reports with the agency or client logo. Tools like Whatagraph, DashThis, and Metrics Watch are designed specifically for this workflow, handling multi-account management and scheduled delivery without manual intervention.
The most critical sources for marketing teams are Google Ads, Meta Ads, LinkedIn Ads, TikTok Ads, GA4, Google Search Console, HubSpot, Salesforce, Shopify, Mailchimp, and Klaviyo. Beyond those, the right source list depends on the specific channels a team runs. Verify native connector availability for each source before selecting a tool. Missing a primary source means manual export work that the dashboard was supposed to eliminate.