Your laptop slows down mid-test. A question lands in Slack: Is this a product regression or a machine cooking itself under load? Task managers show CPU and memory usage, but they rarely reveal whether the processor is throttling, whether a fan has stopped responding, or whether a drive is reporting early warning signs. That gap between "something is slow" and "here is what the hardware is doing" is exactly where hardware monitoring software earns its keep.
The global hardware monitoring tools market reached $2.7 billion in 2025 and is forecast to hit $5.96 billion by 2034, a 9.2% compound annual growth rate, according to Dataintelo (2025). More organizations are instrumenting their local environments, not just their cloud infrastructure. For product managers validating a release, reproducing a performance complaint, or checking whether a development machine is the source of an unexplained slowdown, the right PC hardware monitoring software makes that investigation repeatable and evidence-based.
This guide covers eight tools selected for sensor depth, logging capability, platform support, and fit for technical operators who need data rather than guesswork.
What's inside
This guide is for product managers, developers, and technical operators who need to monitor local hardware during testing, release validation, or performance investigation. It does not assume overclocker-level expertise.
Tools were selected based on:
- Sensor coverage: CPU, GPU, motherboard, storage, and fan data
- Logging and reporting: ability to capture sustained readings, not just live snapshots
- Platform and portability: Windows support, Linux availability where relevant, and portable operation where applicable
- Cost and licensing: free tiers, commercial licensing terms, and paid upgrade value
Each tool is assessed for a specific monitoring job, not ranked as universally the best choice for every user.
TL;DR
- Best for deep sensor coverage: HWiNFO delivers the most detailed real-time readings, logging, and hardware inventory in this list
- Best for a quick Windows sensor check: HWMonitor shows temperatures, voltages, fan speeds, and S.M.A.R.T. drive data with minimal setup
- Best open-source option: Libre Hardware Monitor is the actively maintained community fork, with broader modern hardware support than its predecessor
- Best for CPU-only temperature checks: Core Temp gives you per-core processor readings without the overhead of a full diagnostics suite
- Best for GPU overlay monitoring: MSI Afterburner puts real-time GPU telemetry on screen during graphics-heavy workloads
What is hardware monitoring software?
Hardware monitoring software reads data from your computer's sensors to show real-time temperatures, fan speeds, voltages, clock speeds, utilization, power draw, and storage-health signals.
What hardware monitoring software tracks
- CPU package and individual core temperatures
- GPU temperature, load, power draw, memory use, and clock speeds
- Fan speeds and, where supported, fan control
- Motherboard voltages and power readings
- RAM utilization and system resource pressure
- SSD and hard-drive S.M.A.R.T. health data
- Battery condition and discharge rates on supported laptops
- Minimum, maximum, and average values logged over time
How it differs from system information tools
System information products identify what hardware is installed. Hardware monitors add live sensor data and time-series logs on top of that inventory. Several tools in this list do both, which is useful when you need to capture a component list alongside a performance baseline for an engineering ticket.
What product managers should monitor
The most useful signals during a performance investigation are sustained CPU and GPU temperatures under a repeatable workload, clock behavior during slowdowns, storage health when local builds or data tasks stall unexpectedly, fan speeds when thermal noise appears, and combined CPU, GPU, memory, and disk utilization rather than any single metric in isolation.
| Metric | What it can indicate |
|---|---|
| CPU temperature climbing above spec | Thermal throttling, cooling issue, or ambient heat |
| GPU clock dropping mid-task | Thermal or power limit being hit |
| S.M.A.R.T. warning flag | Drive health degradation worth escalating |
| Fan speed at zero under load | Fan failure or firmware detection gap |
| Memory utilization at ceiling | Application memory pressure, not a hardware fault |
A high reading alone is not a diagnosis. Compare readings under a repeatable workload before drawing conclusions.
When to use hardware monitoring software
Validate a suspected performance regression
Reproduce the same workflow while logging CPU, GPU, memory, and disk behavior. If the slowdown tracks with sustained high temperatures and clock reductions, the constraint is the device. If sensor readings stay normal, the investigation belongs in the application layer. That distinction saves engineering time.
Check temperatures during demanding work
Long video calls, local builds, browser-heavy testing, design exports, and GPU-intensive rendering all push different hardware paths. Run a monitor during a realistic session, capture the sustained peaks, and compare them against the processor manufacturer's thermal specification for your chip.
Catch hardware-health signals before escalation
S.M.A.R.T. data can surface a deteriorating drive before it causes data loss. Recurring thermal throttling, a fan that stops responding, and persistent voltage anomalies are patterns worth capturing and escalating rather than individual readings. The workflow is straightforward: Capture a baseline at idle, reproduce the workload, then compare sustained readings against the baseline.
Hardware monitoring software comparison
The right tool depends on the monitoring job. A quick CPU temperature check during a video call needs a different tool than a logged multi-hour diagnostic session. The table below covers all eight tools with verified pricing and current G2 status.
| # | Product | Best for | Key differentiator | Pricing | G2 rating |
|---|---|---|---|---|---|
| 1 | HWiNFO | Deep diagnostics and sensor logging | Detailed hardware inventory plus real-time monitoring | Free (personal); Pro from $29 | 4.5/5 |
| 2 | HWMonitor | Quick Windows sensor checks | Clear min and max readings for common sensors | Free; Pro from €19.95 | 4.4/5 |
| 3 | Open Hardware Monitor | Lightweight open-source monitoring | Portable, no-install monitoring for supported hardware | Free | Not listed |
| 4 | Libre Hardware Monitor | Modern open-source sensor monitoring | Actively maintained fork with broad sensor access | Free | Not listed |
| 5 | Core Temp | Focused CPU temperature tracking | Per-core CPU temperature monitoring | Free (personal); commercial from $25/machine | Not listed |
| 6 | NZXT CAM | Visual desktop monitoring | Dashboard with NZXT hardware device integration | Free | Not listed |
| 7 | AIDA64 | Diagnostics, reporting, and stress testing | Detailed reports, benchmarks, and SensorPanel | From $65.95 (30-day trial) | 4.0/5 |
| 8 | MSI Afterburner | GPU performance overlays | In-game telemetry and GPU monitoring workflow | Free | Not listed |
8 best hardware monitoring software tools for 2026
1. HWiNFO
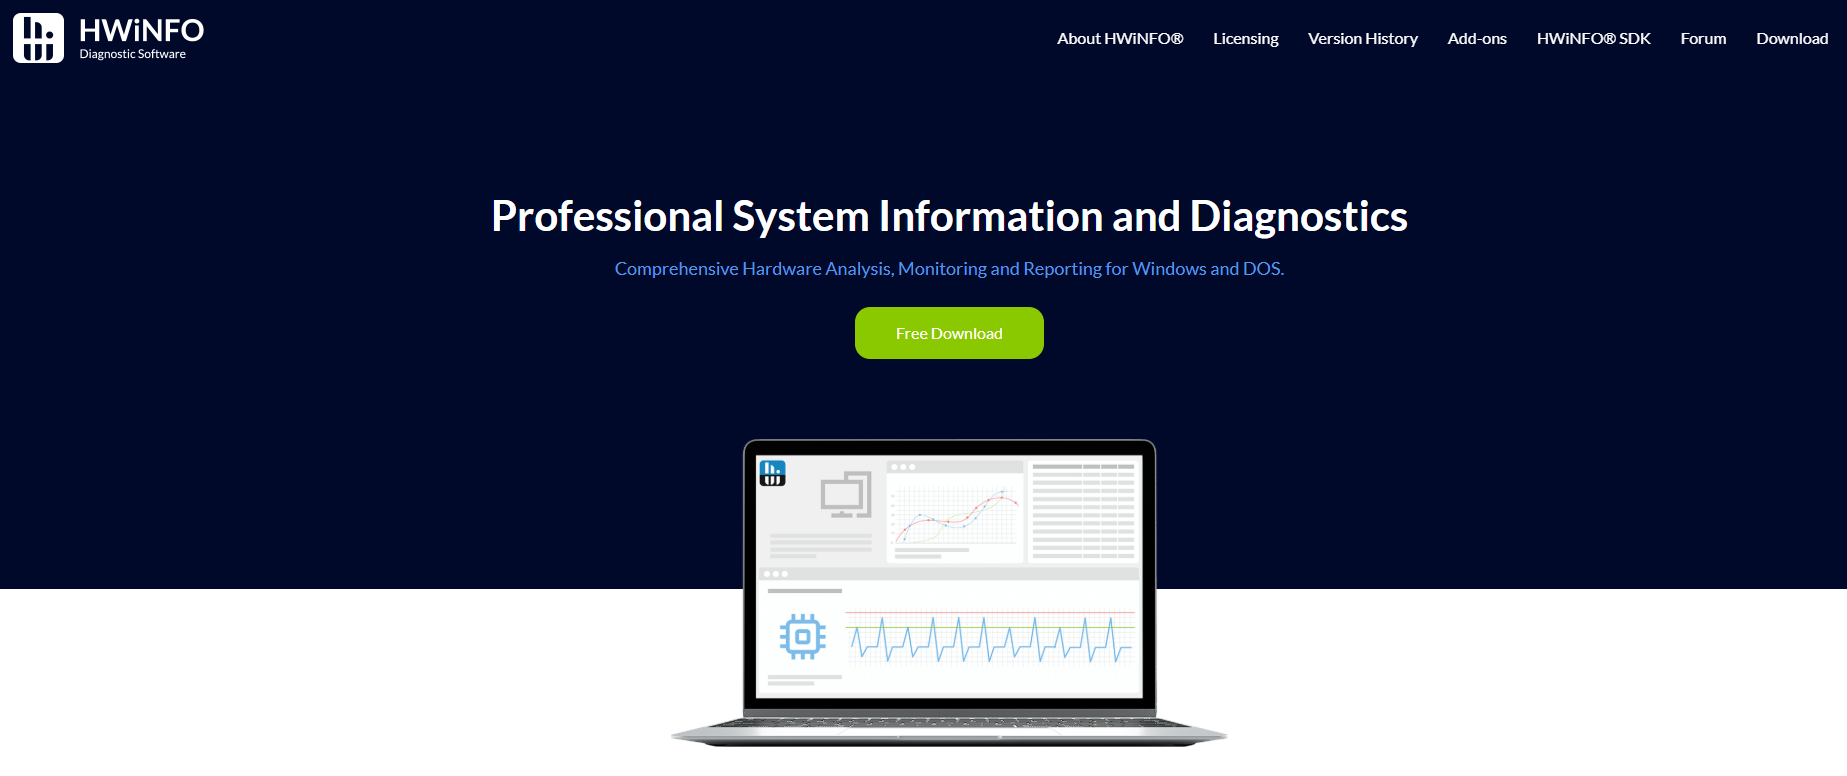
HWiNFO is hardware analysis, monitoring, diagnostics, and reporting software for Windows and DOS. It reads sensors across CPUs, GPUs, drives, peripherals, and motherboard components, displaying them all in a single Sensors Status window with live min, max, and average columns. Reports export to XML, CSV, or HTML, which makes it straightforward to attach evidence to an engineering ticket or IT escalation.
Best for: Product teams and developers who need more than a temperature reading, specifically a logged, multi-component picture of system behavior under a sustained workload.
Key features
- Real-time sensor monitoring across CPU, GPU, motherboard, and drives
- Min, max, and average columns for every reading
- Hardware inventory with detailed component information
- Report export: XML, CSV, HTML
- Customizable graphs, tray icons, OSD alerts, and extensions
Why choose HWiNFO: It earns the top position through sensor depth and reporting flexibility. If the question is "what was the machine doing during that three-hour test run," HWiNFO's logging gives you the answer. Readers who only need a single temperature in the taskbar will find it more than they need at first; a narrower utility like Core Temp is a faster start for that job.
HWiNFO pricing: Free for personal and non-commercial use. Pro licensing starts at $29 for the first year (subscription) or $199 as a one-time lifetime purchase, covering commercial use and additional features.
G2 rating: 4.5/5
2. HWMonitor
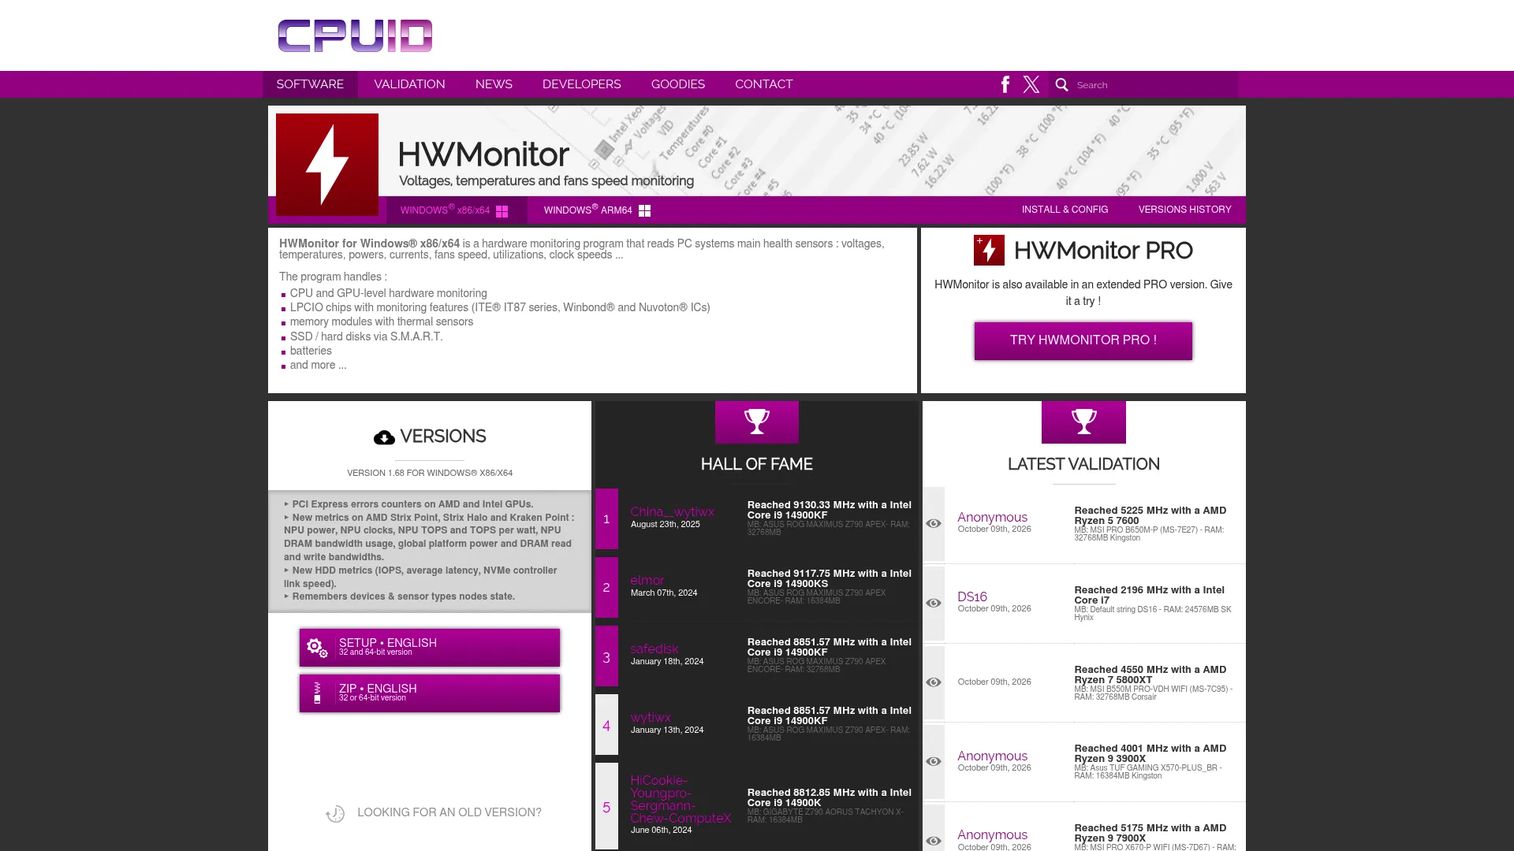
HWMonitor is a Windows sensor utility from CPUID that reads voltages, temperatures, power draw, currents, fan speeds, utilization, and clock speeds across your hardware. It also pulls S.M.A.R.T. data from SSDs and hard drives, and checks memory-module thermal sensors and battery status on supported laptops. The tree-style interface makes it easy to scan all readings at once without navigating between views.
Best for: Users who want a fast, no-frills answer about what their hardware sensors are currently reporting.
Key features
- Temperature, voltage, and current readings across CPU and GPU
- Fan speed monitoring for all detected fans
- Min and max value tracking per sensor
- S.M.A.R.T. drive health data
- Battery and memory-module thermal sensors
Why choose HWMonitor: The min and max columns capture the peak readings that occurred during a test, even if you weren't watching at the exact moment. For a PM who needs to check "did the machine overheat during that workflow," that captured maximum is often the only data point that matters. It's less suited to deep diagnostics or custom reporting, but for quick sensor checks it delivers answers with almost no setup time.
HWMonitor pricing: The classic version is free to download. HWMonitor PRO adds remote monitoring capabilities: The Standard license is €19.95 (unlimited usage, one year of updates), and the Extended license is €34.95 (unlimited usage, two years of updates).
G2 rating: 4.4/5
3. Open Hardware Monitor
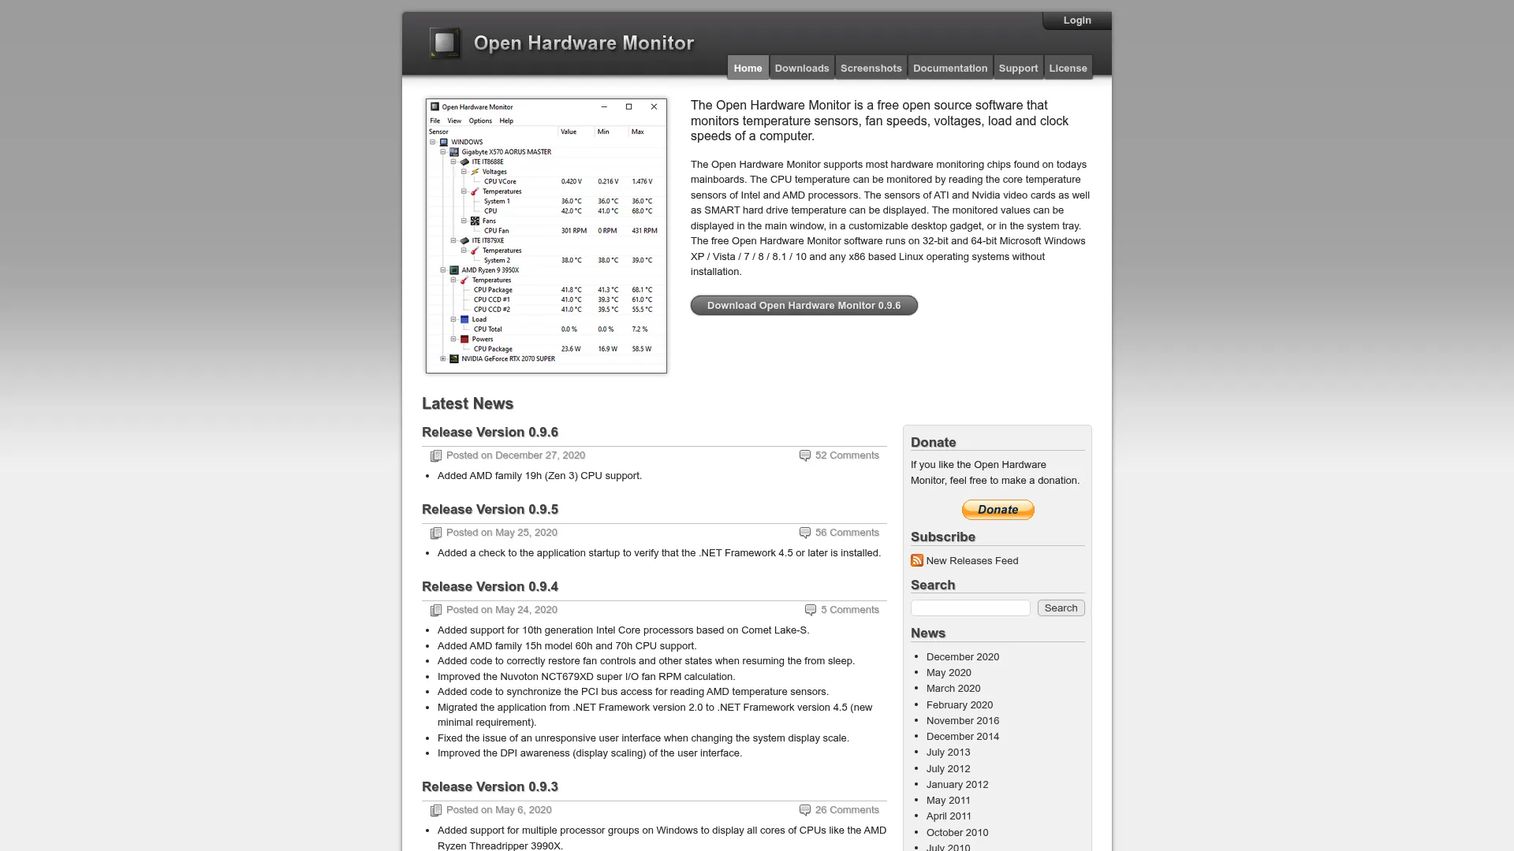
Open Hardware Monitor is a free, open-source utility that reads CPU, GPU, motherboard, hard-drive, and SSD sensors without requiring installation. It displays data in the main window, a customizable desktop gadget, or the system tray, and publishes readings through Windows Management Instrumentation (WMI) for scripts or integrations. The portable format means you can run it on a test machine without leaving anything behind.
Best for: Technical users who want free, portable sensor monitoring on Windows with transparent open-source licensing.
Key features
- CPU, GPU, motherboard, and drive sensor readings
- Portable operation, no installation required
- System tray and desktop gadget display options
- WMI data publishing for scripting
- Fan speed, voltage, load, and clock monitoring
Why choose Open Hardware Monitor: The portable, no-install model suits situations where you need to validate a machine quickly without modifying its software environment. That's a real operational convenience during pre-release device checks. One caveat worth noting before deploying: The project's last published release dates to December 2020, so verify that it supports your specific CPU generation and chipset before relying on it for current hardware. For newer systems, Libre Hardware Monitor is the actively maintained alternative.
Open Hardware Monitor pricing: Free. No paid tier exists.
4. Libre Hardware Monitor
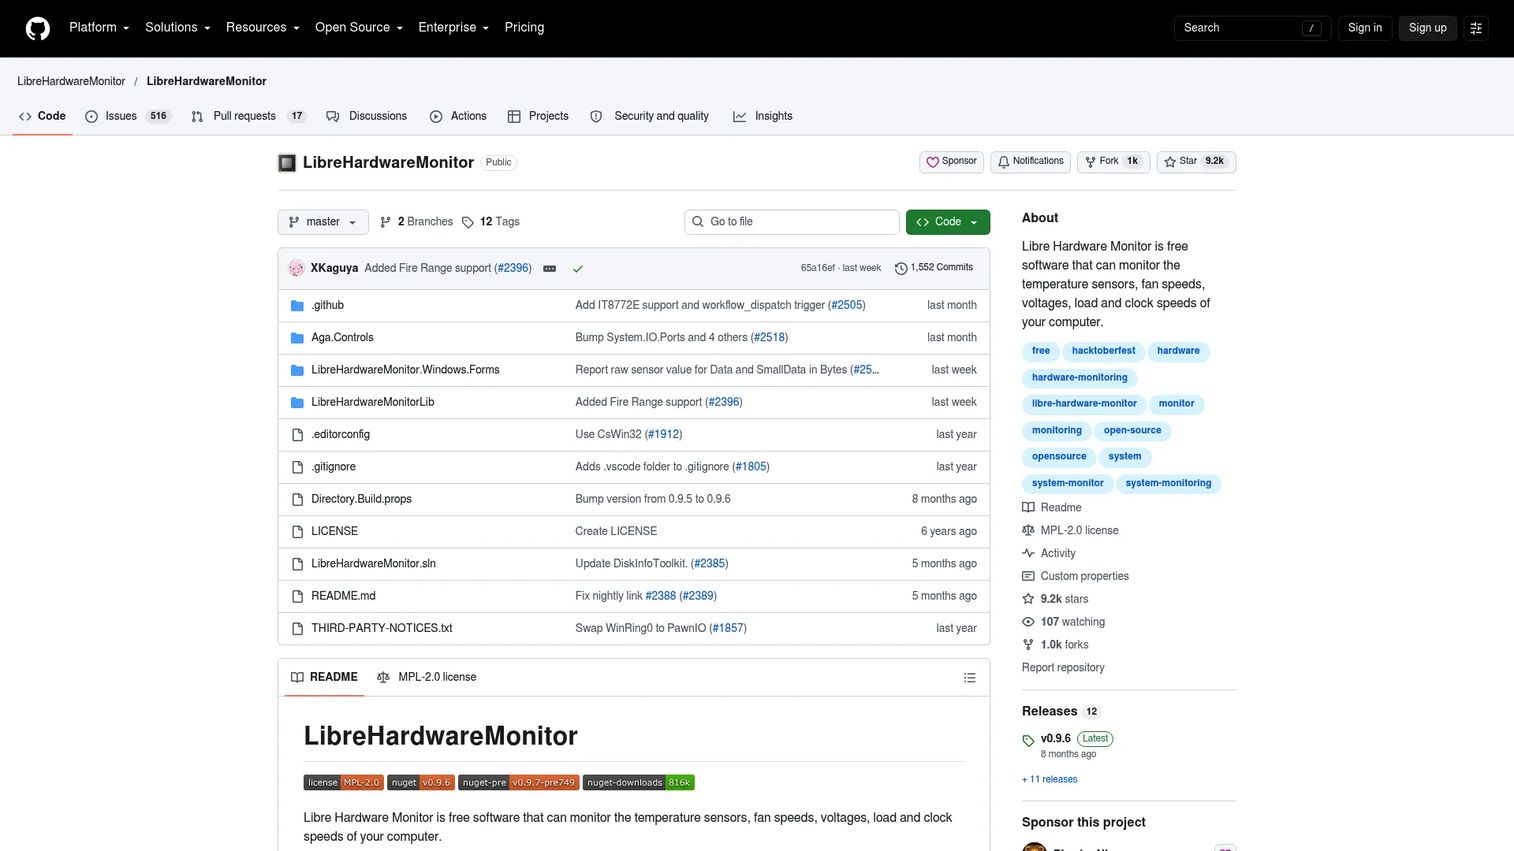
Libre Hardware Monitor is the actively maintained open-source fork of Open Hardware Monitor, licensed under MPL 2.0. It reads temperature sensors, fan speeds, voltages, load, and clock speeds from motherboards, Intel and AMD processors, NVIDIA and AMD graphics cards, HDDs, SSDs, NVMe drives, and network cards. The project is maintained by a community of contributors and receives regular updates for new hardware generations.
Best for: Windows users who want open-source sensor monitoring with current hardware support and access to the underlying .NET library for developer integrations.
Key features
- Temperature, fan, voltage, load, and clock readings
- Support for Intel, AMD CPUs and NVIDIA, AMD, Intel GPUs
- NVMe, SSD, and HDD sensor access
- Windows Forms GUI plus a reusable .NET library
- System tray sensor display
Why choose Libre Hardware Monitor: For teams where a technical colleague needs to collect local environment evidence without budget approval for a paid tool, Libre Hardware Monitor provides broad sensor coverage at no cost. The .NET library also means a developer can integrate sensor readings into a custom script or dashboard if the workflow calls for it. The interface is more utilitarian than a polished commercial dashboard, but the coverage is substantive.
Libre Hardware Monitor pricing: Free and open-source under MPL 2.0.
5. Core Temp
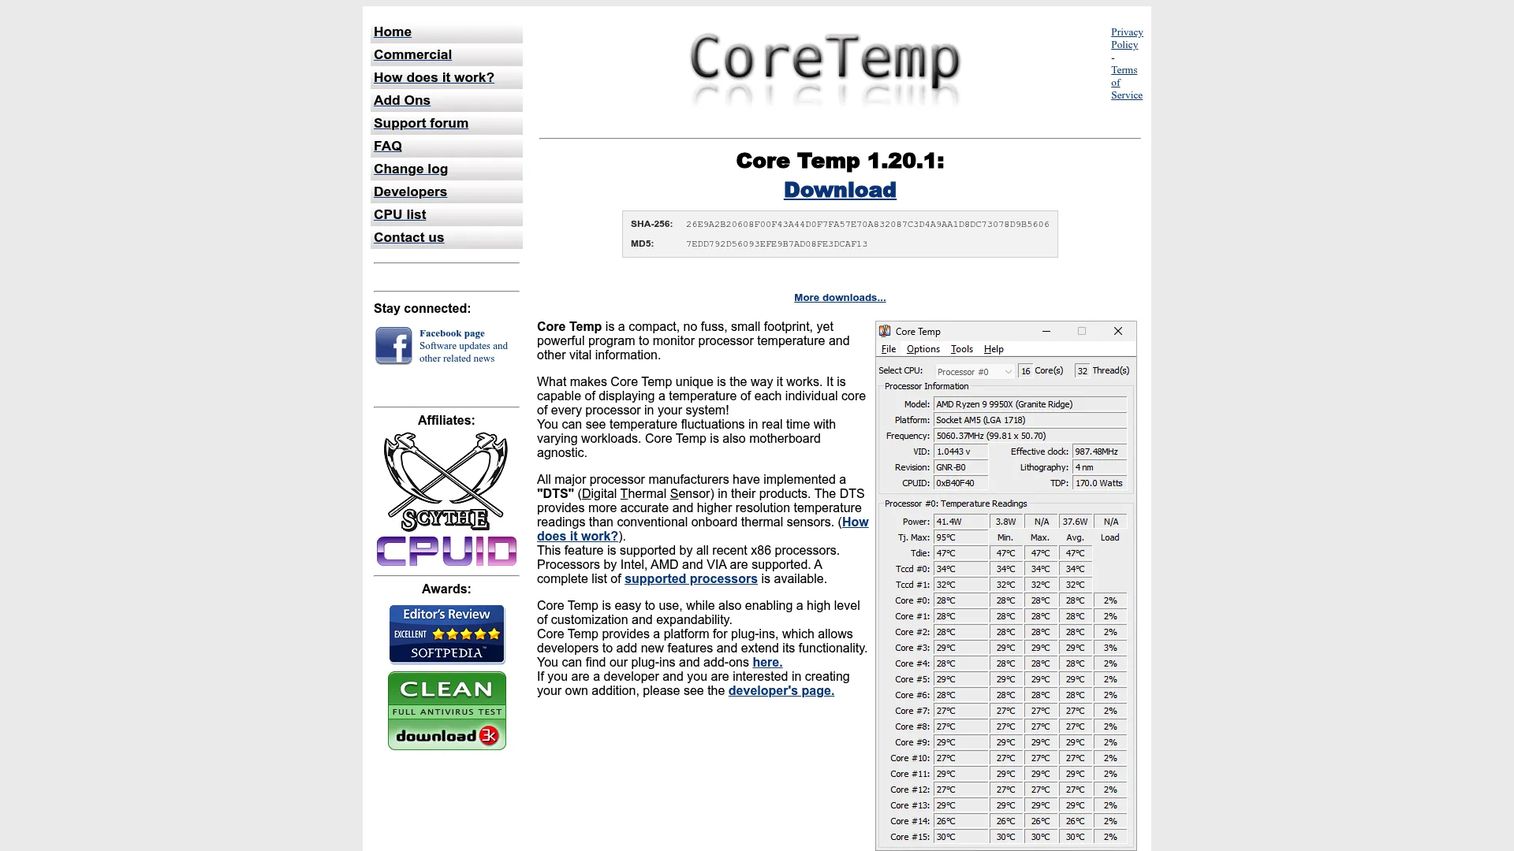
Core Temp is a compact Windows utility focused specifically on processor temperature monitoring. It shows the temperature of each individual CPU core in real time, tracks minimum and maximum values, and supports Intel, AMD, and VIA x86 processors. A plugin platform extends its functionality, and temperature alerts can notify you when a threshold is crossed.
Best for: Individuals who need a focused CPU temperature check during browser-heavy testing, local builds, or laptop-intensive sessions, without the overhead of a full hardware suite.
Key features
- Per-core CPU temperature readings
- Processor load monitoring
- Minimum and maximum temperature tracking
- Temperature threshold alerts
- Plugin support for extended functionality
Why choose Core Temp: It answers one question quickly: How hot is the processor right now, and was it hotter during that last task? For a PM working on a laptop that slows down during demanding browser sessions or large local builds, that answer is often enough to confirm or rule out a thermal constraint. Choose a broader monitor like HWiNFO if the investigation also involves GPU, storage, or motherboard sensors.
Core Temp pricing: Free for personal use. Commercial licensing starts at $25 per physical machine, with volume pricing available for 2 to 999 machines. Organizations deploying 1,000 or more machines can request a quote directly.
6. NZXT CAM
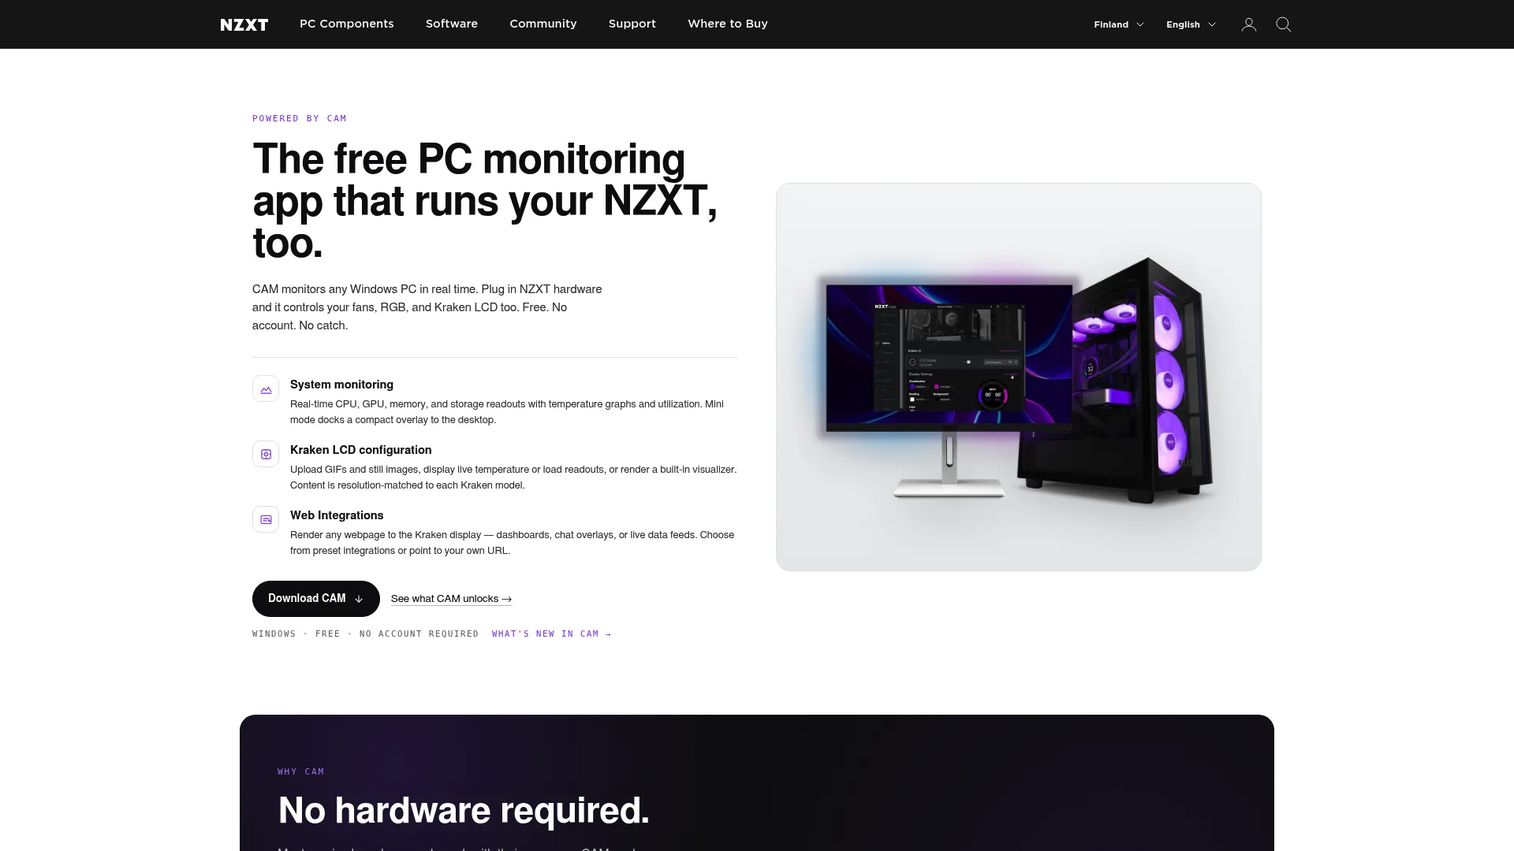
NZXT CAM is a free Windows application for real-time PC monitoring combined with hardware control for compatible NZXT devices. It tracks CPU, GPU, memory, and storage temperatures and utilization, and extends to fan-speed control, RGB lighting, and Kraken LCD configuration for users with supported NZXT cooling and display hardware. A mini mode overlay sits on the desktop for at-a-glance visibility during work sessions.
Best for: Desktop users on Windows 10 or 11 who want a polished monitoring dashboard and use compatible NZXT cooling or display hardware.
Key features
- Real-time CPU, GPU, memory, and storage monitoring
- Temperature graphs and utilization tracking
- Fan-speed and pump control on compatible NZXT hardware
- Kraken LCD configuration with live metrics and GIFs
- Mini mode desktop overlay
Why choose NZXT CAM: For quick visibility during recordings, demos, or active work sessions, the dashboard format gives an at-a-glance view without navigating a sensor tree. Its value amplifies if you already use NZXT cooling hardware, since device control and monitoring live in the same application. For broader diagnostics across mixed hardware, or for machines without NZXT components, a general-purpose monitor covers more ground. Note that CAM supports Windows 10 and 11 only; macOS and Linux are not supported.
NZXT CAM pricing: Free, with no subscription required.
7. AIDA64
AIDA64 is a paid diagnostics, benchmarking, and monitoring suite for Windows. It covers detailed hardware and software analysis, CPU, memory, disk, and system benchmarking, real-time sensor monitoring with logging, system stability and stress testing, and network inventory for IT asset management. The SensorPanel feature lets teams build custom monitoring displays showing the exact metrics they need in a configurable layout.
Best for: Power users, IT-adjacent technical teams, and small to medium-sized businesses that need detailed diagnostic reports, stress testing, and customizable monitoring panels alongside core sensor data.
Key features
- Detailed hardware and software diagnostics
- System stability and stress testing
- SensorPanel with configurable monitoring layouts
- CPU, memory, and disk benchmarking
- Network inventory and remote monitoring (Business edition)
Why choose AIDA64: When the investigation requires more than current readings, such as generating a hardware report to accompany an engineering escalation, running a stability test before a critical release, or establishing a reproducible performance baseline, AIDA64 packages those capabilities together. It's overbuilt for a reader who only needs a free temperature check, but for teams validating performance claims on a controlled test machine, the combined workflow is worth the license cost.
AIDA64 pricing: A 30-day trial is available. AIDA64 Extreme costs $65.95 for 3 PCs. AIDA64 Engineer is $239.90 per seat. AIDA64 Business covers 10 nodes at $239.90. AIDA64 Network Audit covers 10 nodes at $142.90. All licenses include one year of support and maintenance.
G2 rating: 4.0/5
8. MSI Afterburner
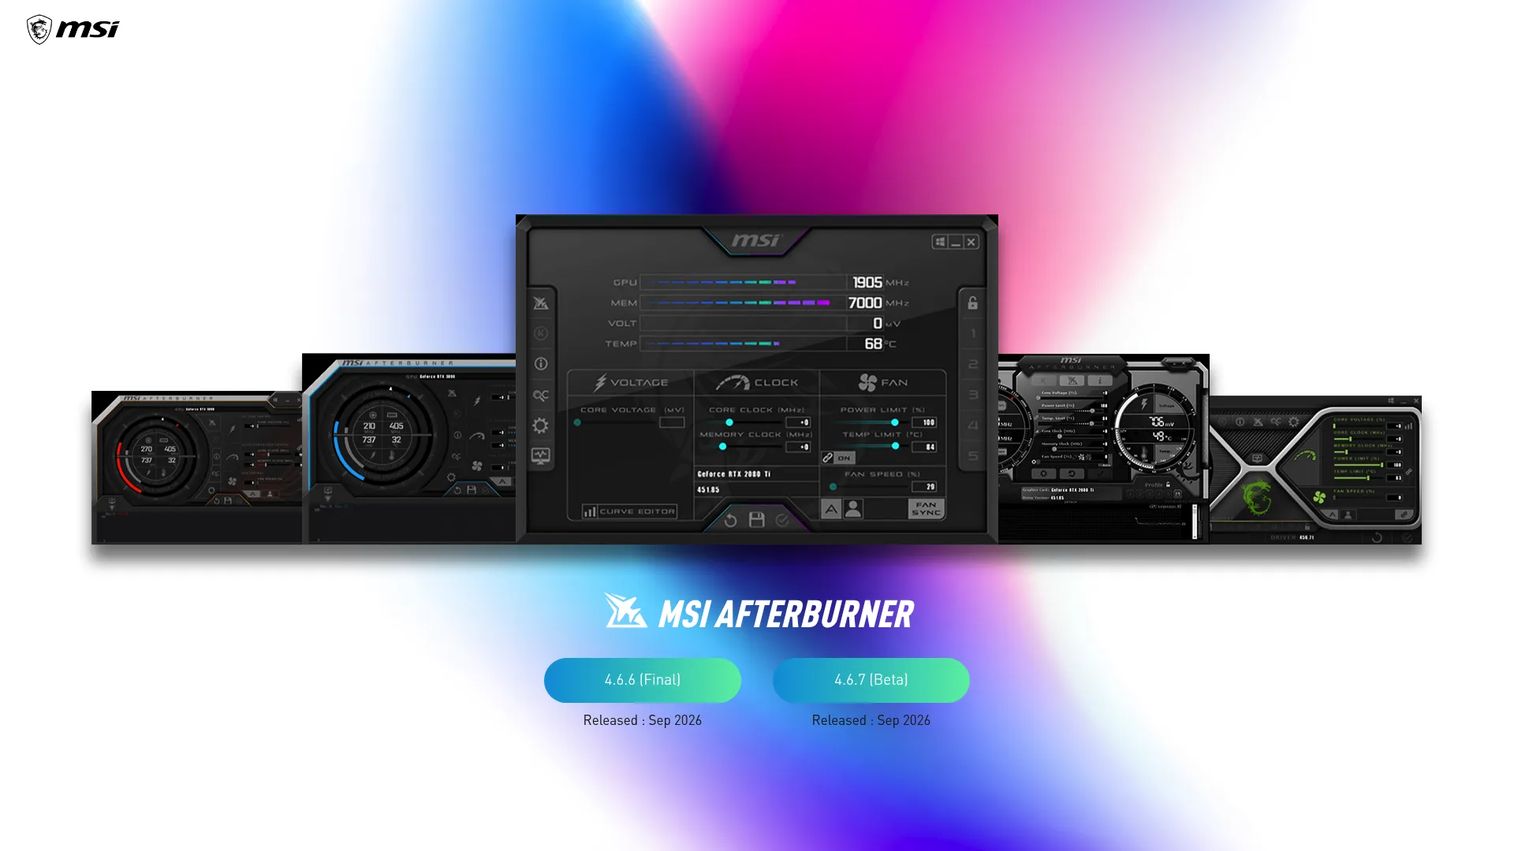
MSI Afterburner is a free GPU monitoring and tuning utility that works with graphics cards from all brands, not only MSI products. Its on-screen display shows GPU temperature, clock speed, utilization, frame rate, and memory use as an overlay during any application. Custom fan profiles let users set temperature-based fan curves, and the video capture function records gameplay or application footage alongside hardware telemetry.
Best for: Product managers and developers who need to watch GPU behavior in real time during graphics-intensive applications, browser rendering benchmarks, video processing, or GPU-adjacent product testing.
Key features
- Real-time GPU temperature and clock monitoring
- On-screen performance overlay for any application
- Frame rate and GPU utilization telemetry
- Custom fan curve controls
- GPU tuning and overclocking controls
Why choose MSI Afterburner: The overlay format is particularly useful for reproducing a frame drop, rendering slowdown, or GPU-intensive workflow, because you see the sensor data at the exact moment the issue occurs rather than correlating logs after the fact. Its GPU focus means it's not a replacement for a full-system monitor when storage, CPU thermal behavior, or motherboard readings are also in scope. The tuning features are separate from monitoring; you don't need to adjust GPU clocks to use it as a diagnostic tool.
MSI Afterburner pricing: Free, with no paid tiers.
Considerations when choosing hardware monitoring software
Match sensor depth to the question
A CPU-only temperature utility answers a narrow thermal question about the processor. For unexplained instability where the source could be the GPU, a drive, or a voltage issue, choose a tool that captures CPU, GPU, storage, fan, and motherboard data together. Starting with a narrow tool and switching mid-investigation wastes time.
Prioritize logging over live snapshots
A reading captured after a slowdown has already resolved tells you very little. Logging minimum, maximum, and average values over a sustained session gives you something to compare across runs. Before escalating a device issue to IT or engineering, check that you have time-series data from at least two comparable workload sessions.
Verify hardware and operating-system compatibility
Sensor availability depends on the motherboard chipset, processor generation, GPU driver version, storage device firmware, and operating system. Open-source tools in particular may lag on support for very recent hardware. Check the project's release notes or issue tracker for your specific components before committing to a tool.
Keep monitoring separate from tuning
Monitoring observes what the hardware is doing. Tuning changes it. Changing fan curves, clock speeds, or voltage settings during an investigation contaminates the baseline. Establish stable readings under the stock configuration first, then decide whether any adjustment is warranted.
Decide how much reporting you actually need
A dashboard or system tray readout works for quick checks. Choose a diagnostics and reporting suite when you need to share structured evidence with engineering, IT, or hardware support. The cost difference between free utilities and paid suites like AIDA64 is most justified when the investigation requires documentation, not just observation.
Conclusion
The right hardware monitoring software is the one that answers your specific question with enough evidence to act on. For most product managers validating local test environments or chasing a performance anomaly, the decision breaks down by job:
- HWiNFO for the most complete sensor picture and logged reports
- HWMonitor for quick Windows readings across temperatures, fans, and drive health
- Libre Hardware Monitor for free, open-source monitoring on current hardware
- Open Hardware Monitor for portable monitoring on older or simpler setups
- Core Temp when the question is specifically about the processor
- NZXT CAM for a dashboard-first experience on Windows with NZXT hardware
- AIDA64 when you need diagnostics, stress testing, and structured reports together
- MSI Afterburner for GPU telemetry during graphics-intensive work
Start by capturing a baseline at idle, reproduce the workload that triggers the concern, and compare the sustained readings against the baseline. That three-step habit turns a vague "something is slow" report into a defensible data point, whether the next step is a hardware swap, an engineering ticket, or confirmation that the device is fine and the investigation belongs elsewhere.
Start your journey with Guideflow today!
FAQs
The answer depends on what you need to monitor. HWiNFO covers the widest range of sensors, including CPU, GPU, motherboard, drives, and fan data, with logging and export. HWMonitor is a faster starting point for straightforward readings. MSI Afterburner is the specialist choice when GPU behavior during an active application is the focus. Start with HWiNFO if you're unsure which component is the source of the issue.
Install a CPU or hardware monitoring tool, let the machine idle for a few minutes to establish a baseline, then reproduce the workload while watching the temperature readings. Core Temp shows per-core values and tracks the maximum reached during the session. Compare the peak against the thermal specification for your specific processor model, keeping in mind that ambient room temperature and chassis airflow both affect normal operating ranges.
It shows temperature patterns, fan behavior, and clock reductions that occur when a processor hits its thermal limit. Most modern CPUs reduce clock speed automatically when temperature thresholds are crossed, and that reduction appears as a clock drop in monitoring data. The software surfaces the pattern; identifying the underlying cause, whether it's dust buildup, failing thermal paste, a failed fan, or sustained workload pressure, requires additional investigation.
MSI Afterburner is designed specifically for this combination, displaying GPU temperature, clock speed, utilization, and frame rate as an on-screen overlay during any application. Full-system monitors like HWiNFO show GPU temperatures and clocks but don't provide a game-oriented frame rate overlay. Verify that your graphics driver and operating system are compatible with any overlay tool before relying on it during a test session.
For most CPU, GPU, fan, voltage, and S.M.A.R.T. drive checks, free tools cover the job entirely. HWiNFO, HWMonitor, Libre Hardware Monitor, Core Temp, NZXT CAM, and MSI Afterburner all cost nothing for personal or non-commercial use. Paid tools become relevant when the workflow requires stress testing, professional-grade reports, customizable sensor panel displays, or a commercial license for organizational deployment.
Yes, through S.M.A.R.T. data. Tools like HWiNFO and HWMonitor read the health attributes and temperature that drives report to the operating system, flagging values that indicate wear or anomalies. A clean S.M.A.R.T. report doesn't guarantee a drive has no problems; certain failure modes don't appear in S.M.A.R.T. data before a drive fails. Treat it as an early warning system rather than a definitive health certificate.
Most sensor utilities run with low overhead during normal operation and won't meaningfully affect test results. High-frequency logging, complex overlays, or running multiple monitoring tools simultaneously can add measurable load to the system. For a performance investigation, run one primary monitor rather than layering several, and keep the logging interval at a reasonable frequency for the question you're trying to answer.
Track CPU and GPU temperatures alongside their respective clock speeds to catch throttling. Add utilization for CPU, GPU, and memory to see where the machine is hitting resource limits. Include disk activity if the workload involves local reads or writes. Fan speeds confirm whether cooling is responding to thermal load. Looking at these signals together gives you a system-level picture rather than a single metric that might mislead in isolation.