A customer emails support: "The checkout button does nothing." Your team scrambles. Three hours and eleven Slack messages later, you learn the bug shipped four releases ago, affects 6% of users on Safari, and nobody caught it because it never threw a visible error in staging.
That gap between "a bug exists in production" and "a human notices it" is where activation quietly leaks, retention erodes, and support tickets pile up. According to Astute Analytica (2023), 80% of user-reported errors were already known to developers through monitoring systems. Read that again. The signal was there. The workflow to act on it was not.
Error monitoring software closes that gap. It surfaces exceptions the moment they happen, groups the noise, attaches context like stack traces and session replay, and routes the fix to the right person before the next customer churns. For product managers, this is not just engineering hygiene. A silent production bug is an activation problem, a retention problem, and a support-load problem wearing an engineering costume. If you are already thinking about the health of your stack, it sits right next to your application performance monitoring tools and the broader question of how you catch failures before your users do.
What's inside
This guide covers the best error monitoring software for 2026, who each tool fits, and what product managers should optimize for when shortlisting. We ranked these nine tools on the factors that actually change team outcomes: depth of error context (stack traces, metadata, user context), noise reduction and issue grouping, session replay and root cause analysis, release tracking and deployment tracking, integrations into the developer workflow, and pricing transparency. Every pricing figure and G2 rating here was pulled from each vendor's live pricing page and G2 listing. This is written for PMs, engineering managers, and founders comparing error tracking software mid-evaluation, not for a first-time category lookup.
TL;DR
- Best overall for full-context debugging: Sentry. Unified error tracking, tracing, logs, and replay in one place.
- Best for AI-assisted triage and workflow automation: Rollbar. Intelligent grouping that shrinks noisy queues.
- Best for mobile and app stability: Bugsnag. Release health and stability tracking over time.
- Best for unified observability at scale: Datadog. Error tracking inside a broad monitoring platform.
- Best for frontend replay plus error context: LogRocket. See exactly what the user did before the failure.
- Best free crash reporting for mobile: Firebase Crashlytics. No cost, tight fit for Android and iOS teams.
If you build a web app and want one tool that answers "what broke and why," start with Sentry. Mobile-first teams should look hard at Bugsnag and Crashlytics. Teams already running broad monitoring should evaluate whether Datadog's error tracking fits their existing stack before adding a dedicated tool.
What is error monitoring software?
Error monitoring software is a category of developer tooling that automatically detects, captures, groups, and alerts on application errors and exceptions in production so teams can diagnose and fix them faster. It sits close to broader observability but stays focused on one job: turning raw failures into actionable, prioritized issues.
A capable error tracking tool typically captures:
- Stack traces showing the exact line and call path where the failure happened
- Metadata and user context so you know who was affected, on what device, browser, or app version
- Release tracking and deployment tracking to tie a spike in errors back to the exact deploy that caused it
- Issue grouping that collapses thousands of duplicate events into a single actionable issue
- Alerting that notifies the right person or channel when something new or severe appears
- Session replay in some tools, letting you watch what the user experienced before and after the error
- Logs and traces correlation so a single error connects to the surrounding request and infrastructure signals
The distinction from general observability matters. Observability platforms answer broad questions about system health across metrics, logs, and traces. Error monitoring answers a sharper one: this specific exception is happening, here is who it hit, here is the stack trace, here is the release that introduced it, go fix it. Many teams run both, and increasingly the two overlap. The market reflects that pull: global error monitoring software revenue reached US$976.8 million in 2023 and is projected to hit US$2,887.9 million by 2032 (Astute Analytica, 2023).
When to use error monitoring software
The tooling earns its place the moment production issues start reaching users before they reach your dashboards. Here is where it changes the work.
Catch production issues before users flood support
Astute Analytica (2023) found 69% of IT professionals spend at least 10 hours a week identifying software errors. Alerting and issue grouping cut that number by surfacing problems the moment they appear, deduplicated, so one broken release does not generate a thousand tickets. For PMs, this is direct support deflection: a bug caught by monitoring at 9:02am is a bug that never becomes a CSAT hit at noon.
Debug recurring failures with context
The slow part of debugging is not writing the fix. It is reproducing the problem. Stack traces show where the code broke. Release data shows when it started. Session replay shows what the user was actually doing. Together they collapse time-to-diagnosis from hours of guessing to minutes of reading. Root cause analysis stops being archaeology.
Prioritize fixes by user impact
Not every error deserves a sprint slot. Good tooling ranks issues by frequency, number of affected users, and correlation to a recent release. That data feeds directly into triage and roadmap decisions. A PM can walk into standup and say "this one error is hitting 12% of trial users on signup" instead of "engineering thinks there might be a bug somewhere." Impact framing beats vibes every time.
Comparison table
We ranked this shortlist by how completely each tool handles error context, noise reduction, and release tracking, then weighted for fit across web, mobile, and full-stack teams. Pricing and G2 ratings below reflect each vendor's live pricing page and G2 listing at the time of writing. Verify current figures before you buy, since usage-based rates change often.
| # | Product | Intent | Key differentiation | Pricing | G2 rating |
|---|---|---|---|---|---|
| 1 | Sentry | Full-context error tracking and tracing | Errors, traces, logs, and replay unified with AI debugging | Free; Team $26/mo; Business $80/mo | 4.5/5 |
| 2 | Rollbar | AI-assisted triage and grouping | Intelligent error grouping that shrinks noisy queues | Free; paid usage-based | 4.5/5 |
| 3 | Bugsnag | App stability and release health | Stability scores tracked over time across platforms | Free; Select and Preferred from $0/mo | Not listed on G2 |
| 4 | Datadog | Error tracking within full observability | Errors correlated with logs, traces, and metrics at scale | From $15 per host/mo (annual) | 4.4/5 |
| 5 | LogRocket | Frontend replay plus error context | Pixel-perfect session replay tied to errors | Free; Core $69/mo; Professional $295/mo | 4.5/5 |
| 6 | Raygun | Errors plus real user monitoring | Errors correlated to real user impact and deploys | From $80 per 100K errors/mo (annual) | 4.3/5 |
| 7 | Airbrake | Lightweight error and performance monitoring | Simple setup with straightforward usage tiers | Free Dev; Basic $19/mo; Pro $38/mo | 4.4/5 |
| 8 | Firebase Crashlytics | Free mobile crash reporting | No-cost crash reporting inside the Firebase ecosystem | Free | 4.4/5 |
| 9 | SmartBear Insight Hub | App error and performance monitoring | Bugsnag's engine as developer observability | Free; Select and Preferred from $0/mo | 4.3/5 |
1. Sentry
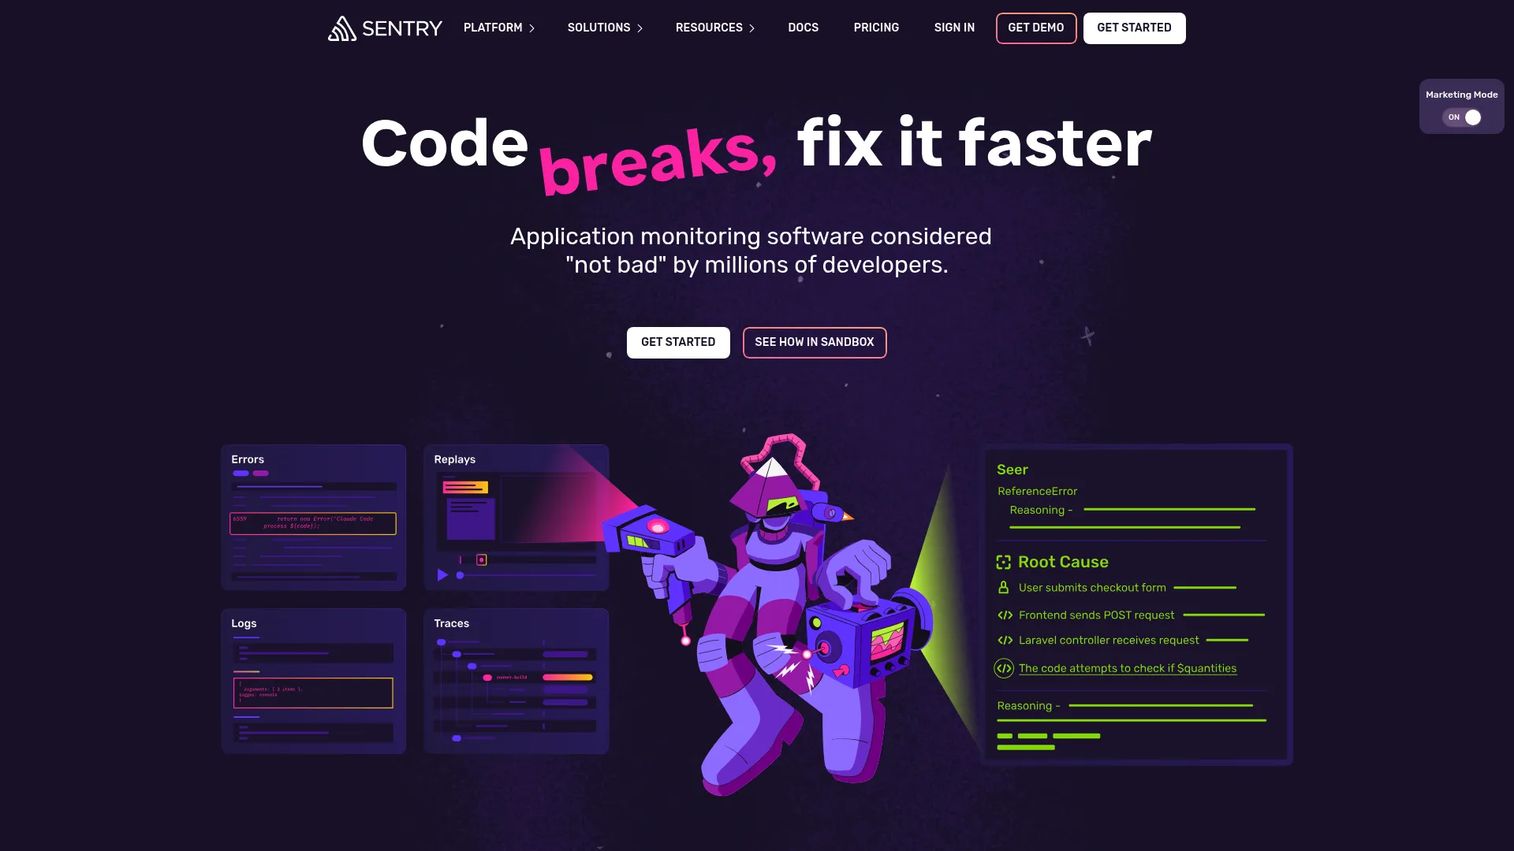
Sentry is an application monitoring and error tracking platform built to debug software issues across web, mobile, and backend apps. It has become a category reference point for a reason: it connects the signals that debugging actually needs, so you move from an issue, to its context, to a fix without switching tools. For product teams, that connected path is the difference between a bug that gets fixed today and one that lingers across three sprints.
Sentry's core loop is fast. An exception fires, Sentry captures the stack traces and metadata, groups it with related events, and ties it to the release that introduced it. From there you can pull in tracing, logs, session replay, and profiling to reconstruct exactly what happened. Its Seer AI debugging layer suggests likely causes and fixes, which shortens root cause analysis for teams drowning in a busy error feed.
Best for: Teams that want unified error tracking, performance monitoring, logs, and replay in one tool to debug production issues quickly.
Key strengths
- Connected context: Errors, traces, logs, and replay live together, so diagnosis does not require tab-hopping.
- Broad framework support: SDKs across most major languages and frameworks, with fast onboarding.
- AI debugging with Seer: Surfaces likely root causes and suggested fixes to speed up triage.
Why choose Sentry: If your team wants one place to answer "what broke, who did it hit, and which deploy caused it," Sentry covers that end to end without stitching together separate products. It fits web and full-stack teams especially well, and the free Developer tier makes it easy to evaluate before committing budget.
Sentry pricing: The Developer plan is free for one user. Team runs $26/mo, Business is $80/mo, and Enterprise is custom. Billing is usage-based on top of the tier, so watch event volume as you scale.
2. Rollbar
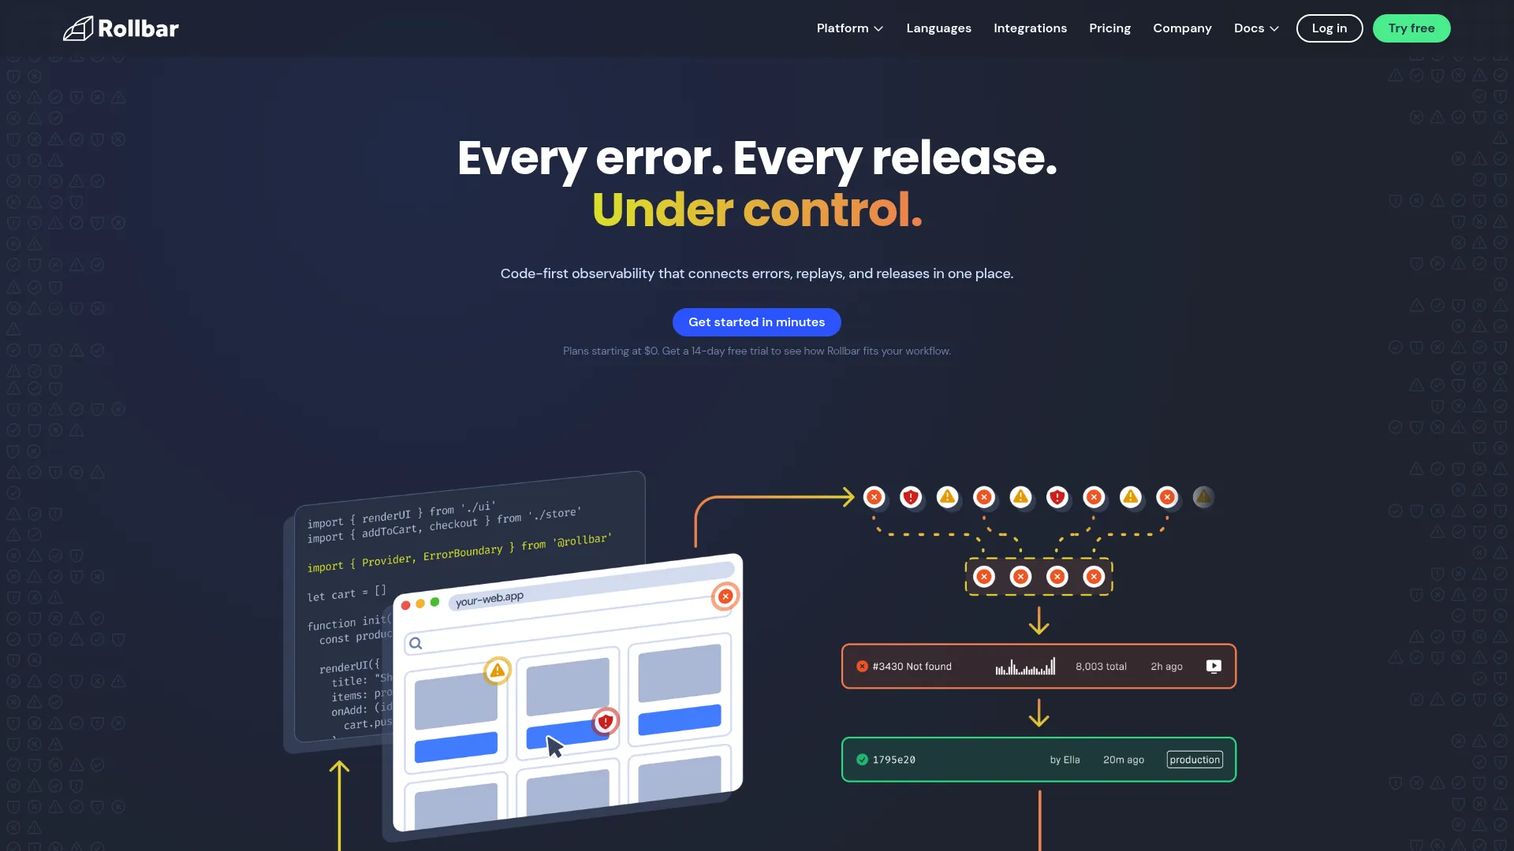
Rollbar is an error monitoring and debugging platform for web and mobile applications, built around one clear promise: cut the noise. Its intelligent grouping collapses floods of similar errors into single, actionable issues, which is exactly the workflow problem PMs feel when an error queue becomes something the team learns to ignore. A queue nobody reads is a monitoring tool that quietly stopped working.
The real-time error feed pairs with alerting so new or reactivated issues surface immediately, not after a customer reports them. Rollbar attaches stack traces, telemetry, and deploy and version tracking to each item, so you can correlate a spike to the release that caused it. The AI-assisted triage angle matters here: instead of a human manually sorting duplicates, the grouping does the first pass, freeing engineering time for the fix.
Best for: Teams that need production error monitoring with strong alerting and issue grouping to keep queues actionable.
Key strengths
- Intelligent grouping: Deduplicates related errors so the queue stays readable and prioritized.
- Real-time feed and alerts: New and reactivated issues surface the moment they appear.
- Deploy and version tracking: Ties error spikes to the exact release that introduced them.
Why choose Rollbar: Pick Rollbar when your team is fighting queue fatigue and repeat incidents. The grouping and automation are designed to reduce the manual triage tax, which keeps monitoring something the team actually uses rather than a dashboard nobody opens.
Rollbar pricing: There is a free plan that includes a monthly occurrence and session allowance. Essentials and Advanced are usage-based paid tiers, and Enterprise is custom. Check the live pricing page for current occurrence limits, since usage caps drive the cost.
3. Bugsnag
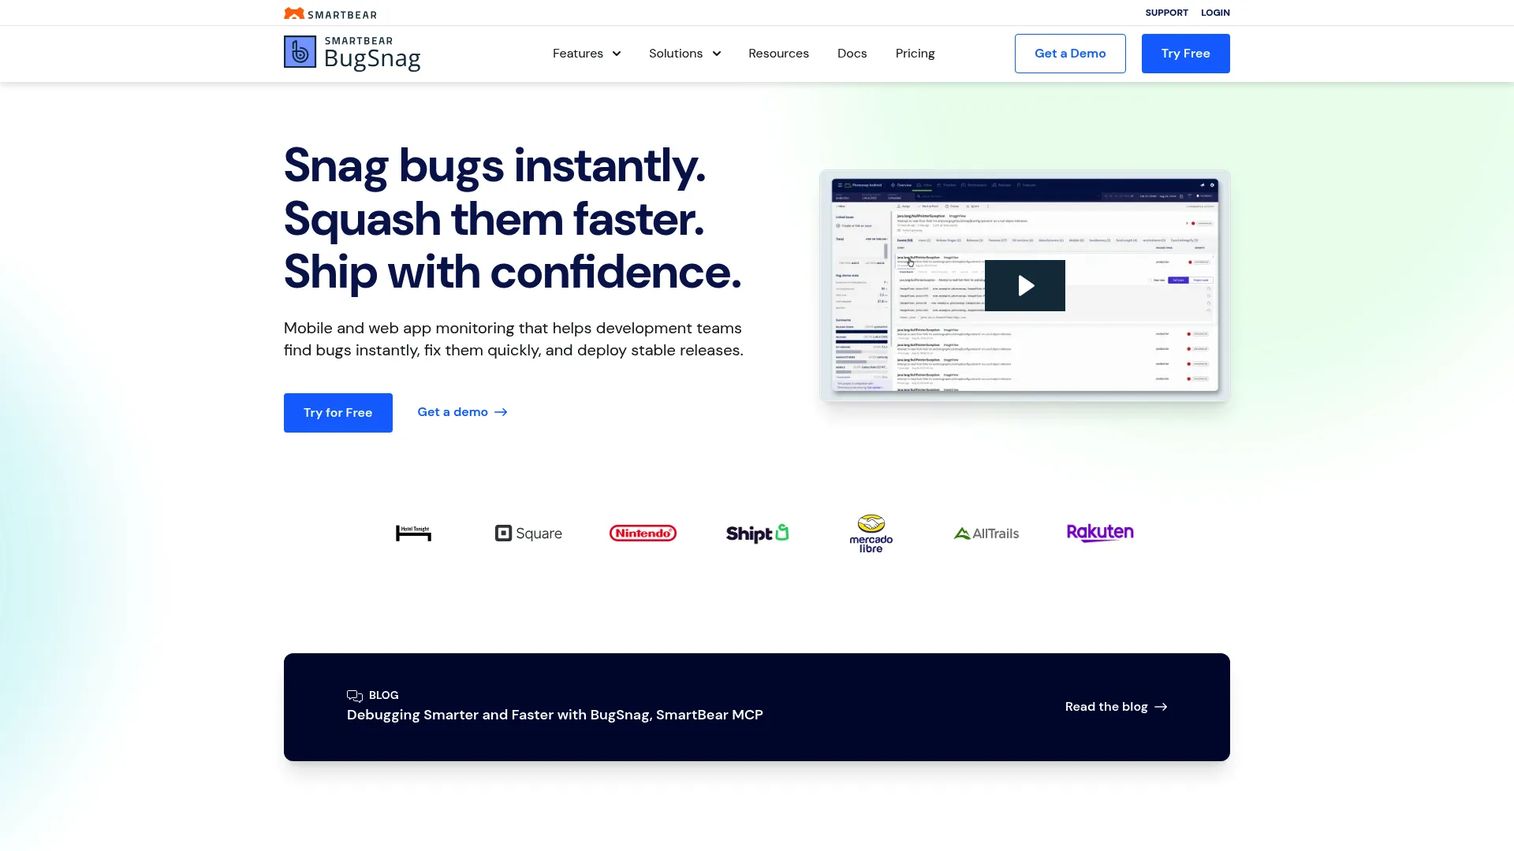
Bugsnag is an application error and performance monitoring platform with a strong reputation for stability management. Where some tools focus on the individual exception, Bugsnag also tracks a stability score over time, so a team can answer "is this release healthier than the last one?" That release-health lens is exactly how a PM thinks about ship confidence, which makes it a natural fit for teams tracking app stability across versions.
Bugsnag spans mobile, web, desktop, and server apps, with diagnostics that help teams prioritize automatically by user impact. It handles mobile crash reporting well, which matters for teams shipping native apps where a crash is a hard, visible failure rather than a quiet console error. Performance monitoring uses span-based pricing, and feature flags plus experiments round out the platform.
Best for: Teams that need crash and error monitoring plus release-health tracking for apps across platforms.
Key strengths
- Stability management: Tracks release health over time so you know if a version is safe to keep shipping.
- Cross-platform coverage: Monitors mobile, web, desktop, and server apps from one place.
- Automated prioritization: Ranks issues by user impact so the team fixes what matters first.
Why choose Bugsnag: If release confidence is your metric and mobile crash reporting is a real concern, Bugsnag's stability-first framing fits how product teams reason about shipping. It rewards teams that care about the trend line, not just the latest exception.
Bugsnag pricing: There is a free plan. Select and Preferred both start at $0/mo and scale with usage, while Enterprise requires contacting sales. Monthly and yearly billing are available, so map your event and span volume to the tier before committing.
4. Datadog
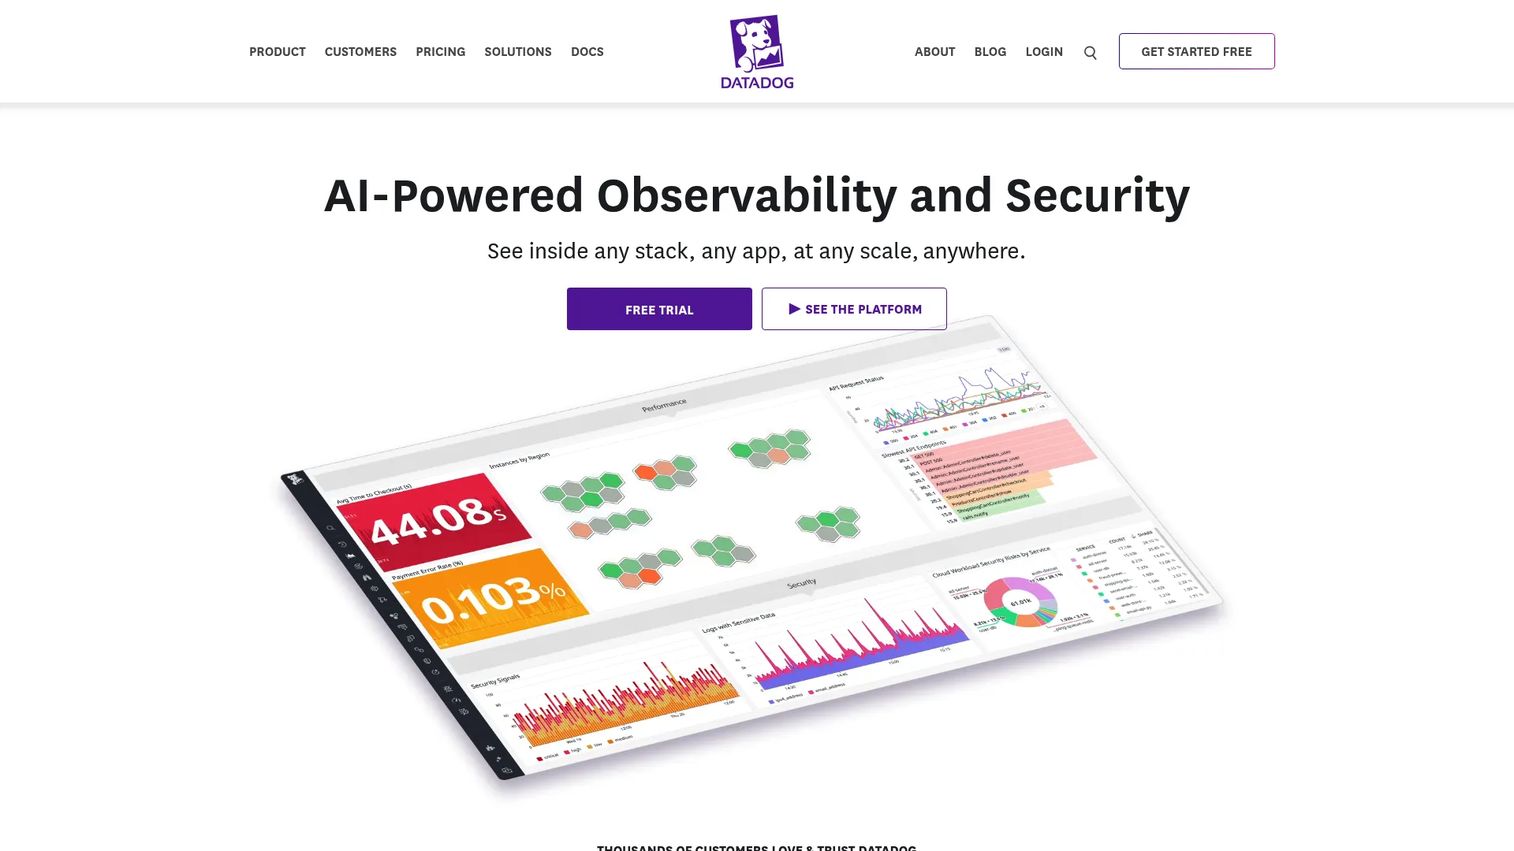
Datadog is a cloud monitoring and security platform where Error Tracking is one feature inside a much broader observability stack. For teams already running Datadog for infrastructure, application performance monitoring, and logs, error tracking slots in without adding another vendor. The value here is correlation: an error does not sit in isolation, it links to the traces, logs, and metrics around it.
Datadog groups errors, ties them to the surrounding request via logs and traces correlation, and alerts on latency and error spikes across services. This shines at scale, where the question is rarely "what is this one error" and more often "which service is degrading and why." The platform's breadth is the reason to choose it and the reason to think carefully: if you only need focused error tracking, a dedicated tool is faster to evaluate, but if Datadog already runs your monitoring, consolidating here reduces tool sprawl.
Best for: Teams that already run broad observability and want error tracking inside their existing platform at scale.
Key strengths
- Logs and traces correlation: Errors connect to the surrounding request and infrastructure signals.
- Platform breadth: Infrastructure, APM, logs, and user experience monitoring in one place.
- Scale-ready alerting: Error and latency alerting across many services and hosts.
Why choose Datadog: Choose Datadog when your team already lives in it. The error tracking becomes powerful because everything else is already instrumented alongside it, giving incident response a single pane of glass rather than a separate login.
Datadog pricing: Pricing is product-specific and usage-based. Infrastructure Pro starts at $15 per host per month billed annually, with higher tiers for enterprise and DevSecOps needs. Error tracking and APM are priced separately, so build your estimate from the products you actually need.
5. LogRocket
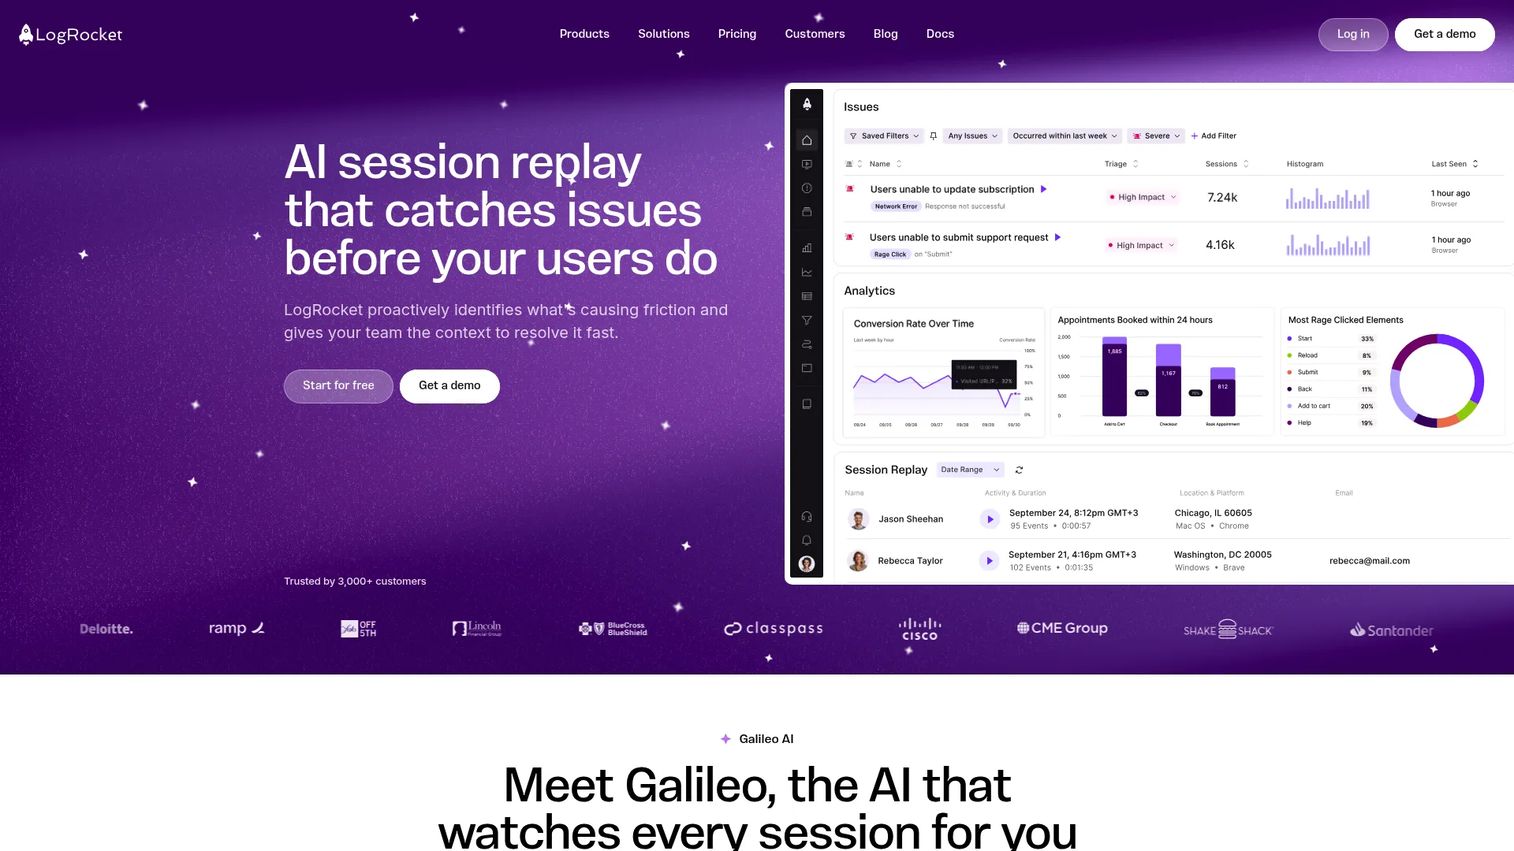
LogRocket is a session replay and product analytics platform for web and mobile apps, with JavaScript error reporting built in. Its defining strength is reproducing issues from the user's point of view. Instead of reading a stack trace and imagining what happened, you watch a pixel-perfect replay of the exact session that hit the error, including the clicks, the rage-taps, and the network calls leading up to it.
That combination of session replay, product analytics, and error tracking makes LogRocket especially useful for product-led teams. When a bug is really a confusing flow, replay shows you the difference. The Galileo AI layer helps surface the sessions worth watching, and frontend performance monitoring rounds out the front end monitoring story with user context attached to every issue.
Best for: Product-led teams that need session replay plus product analytics and error tracking in one tool.
Key strengths
- Pixel-perfect session replay: Watch exactly what the user did before, during, and after a failure.
- Product analytics: Connect errors to behavior, funnels, and drop-off, not just crash counts.
- Frontend error reporting: JavaScript errors captured with full user context.
Why choose LogRocket: If your team keeps asking "but what were they actually doing?" LogRocket answers it directly. Pairing replay with analytics makes it a strong fit when the line between a bug and a UX problem is blurry, which is most of the time for product-led growth teams.
LogRocket pricing: There is a free forever plan. Core is $69/mo, Professional is $295/mo billed annually, and Enterprise is custom. A 14-day trial gives access to the full feature set before you decide.
6. Raygun
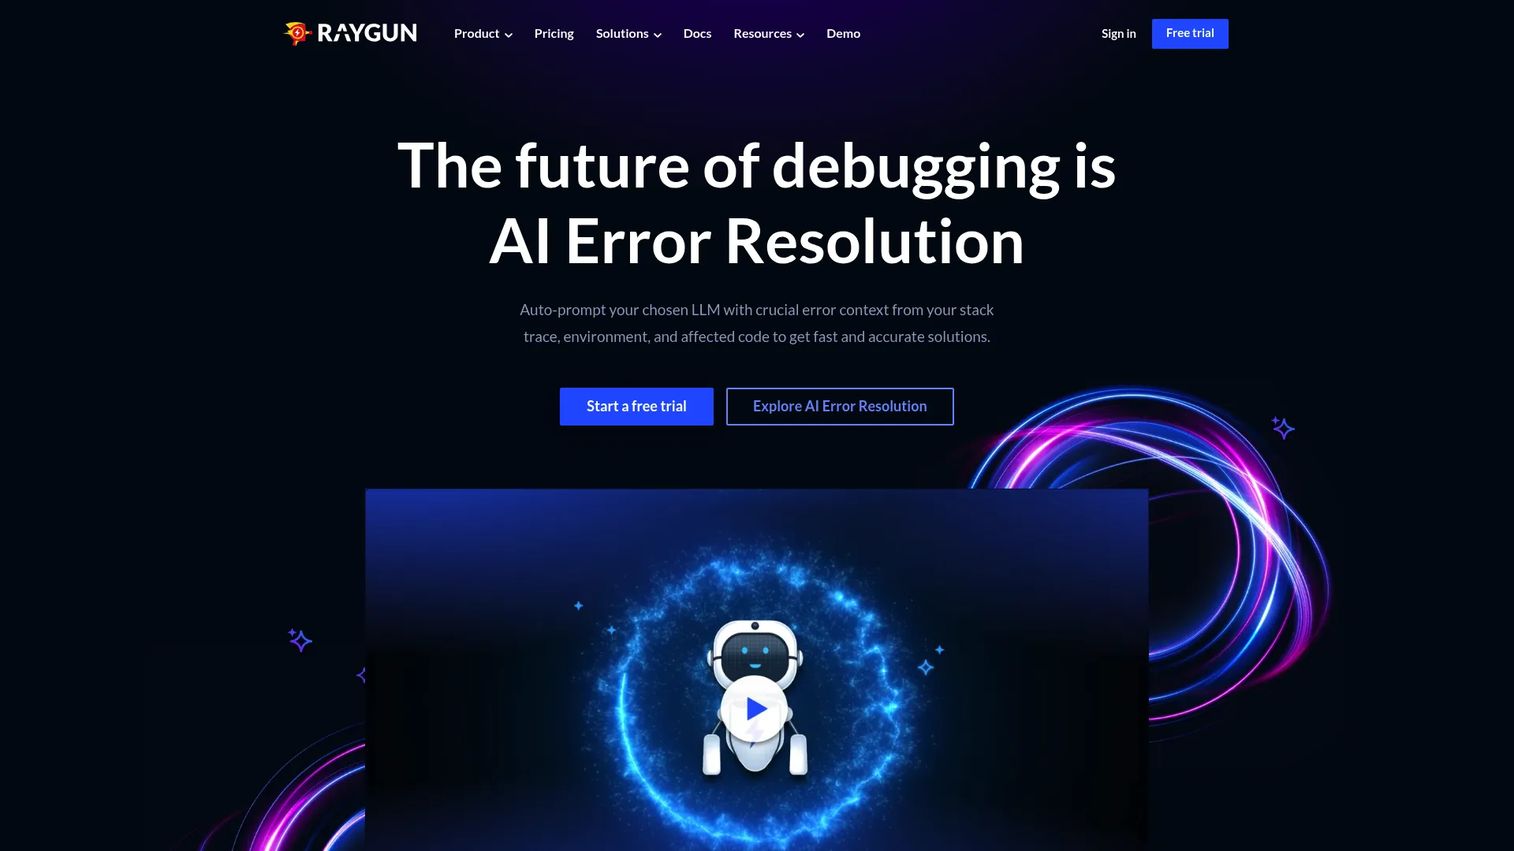
Raygun is an application monitoring platform for web and mobile apps that combines crash reporting, real user monitoring, and application performance monitoring. The distinctive move is correlating errors directly to real user impact. You are not just counting exceptions, you are seeing how they hit actual sessions, which turns an abstract error rate into a concrete customer-experience metric a PM can act on.
Deployment tracking lets you tie error and performance regressions back to specific releases, so a spike after a deploy is immediately traceable. Because real user monitoring and error tracking sit in the same tool, you can move from "this page got slow" to "this exception is why" without leaving the platform. Usage-based pricing scales with error volume, and add-ons cover SSO and usage capping for teams that need spend control.
Best for: Teams that want error, performance, and real user monitoring correlated with deploys under one roof.
Key strengths
- Crash reporting plus RUM: Errors correlated to real user sessions and experience.
- Deployment tracking: Ties regressions back to the release that shipped them.
- Application performance monitoring: Slow requests and errors analyzed together.
Why choose Raygun: Raygun fits teams that want the connective tissue between "something broke" and "here is how many real users it hurt." That user-impact framing maps neatly to how product managers prioritize, making triage conversations more grounded in actual customer effect.
Raygun pricing: Raygun uses usage-based pricing. Basic starts at $80 per 100,000 errors per month on annual billing, with Team and Business tiers scaling from there and Enterprise available on request. A 14-day free trial is offered, and there is no permanent free tier.
7. Airbrake
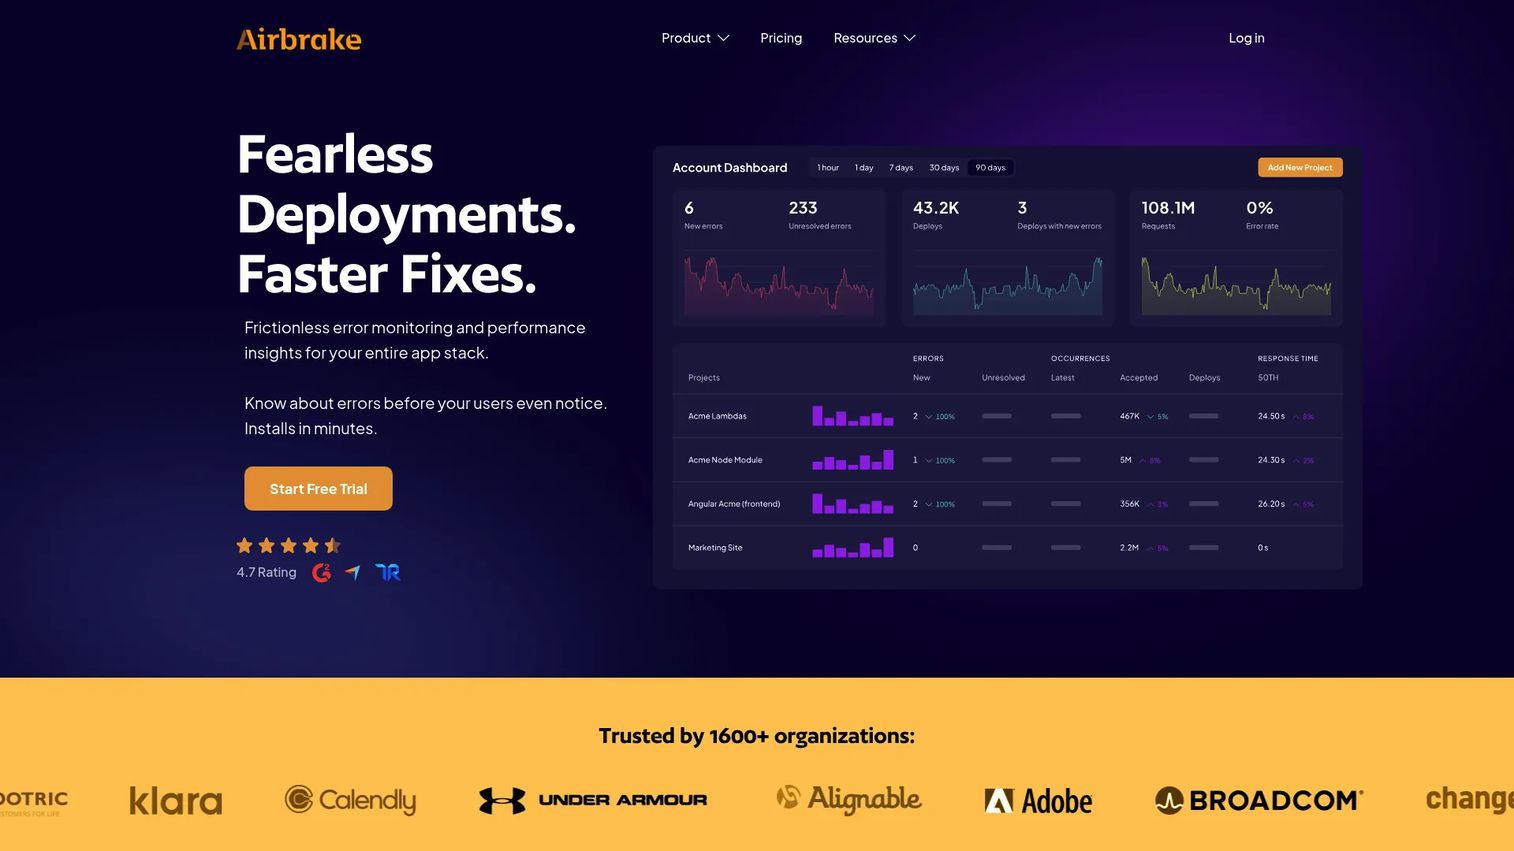
Airbrake is a lightweight error and performance monitoring tool built for teams that want fast setup and straightforward pricing. Not every team needs a sprawling observability platform. Some just want exceptions captured, grouped, searchable, and pushed to Slack, with a bill they can predict. Airbrake fits that brief cleanly.
The core loop covers real-time error alerts, performance monitoring, and deploy tracking, so you can spot a regression right after a release. Search and filtering make it quick to find the specific error you care about in a busy feed. The usage-based tiers are transparent and modest at the entry level, which appeals to startups and small teams that want error tracking without a heavy procurement conversation or a steep learning curve.
Best for: Teams that want simple, quick-to-deploy error tracking with predictable, usage-based pricing.
Key strengths
- Real-time error alerts: Immediate notification when new issues appear in production.
- Deploy tracking: Correlate errors to the release that introduced them.
- Search and filtering: Find the specific error you need fast in a busy feed.
Why choose Airbrake: Choose Airbrake when simplicity and predictable cost matter more than a wide platform. It is a practical pick for smaller teams and early-stage products that want production visibility without the overhead of a full observability suite.
Airbrake pricing: There is a free Dev tier. Basic is $19/mo and Pro is $38/mo, with monthly and yearly options, and annual billing saves 10%. Error and performance volume are metered, so higher usage moves you up the tiers.
8. Firebase Crashlytics
Firebase Crashlytics is Google's realtime crash and error reporting tool for mobile apps, and it is free to use. For teams building on Android, iOS, Flutter, or Unity, and especially those already inside the Firebase ecosystem, it is often the default and the fastest path to real mobile crash reporting.
Crashlytics groups crashes intelligently, prioritizes by severity and prevalence, and surfaces the issues affecting the most users first. Its AI-powered crash insights help explain what happened, and realtime alerts plus release monitoring flag regressions as they roll out. Integrations with Jira, Slack, BigQuery, and Android Studio plug it straight into a mobile developer workflow, so crashes become tickets and analytics events without manual glue.
Best for: Mobile teams building on Android, iOS, Flutter, or Unity who want free crash reporting inside Firebase.
Key strengths
- Realtime crash reporting: Crashes surface immediately with grouping and prioritization by prevalence.
- AI-powered insights: Automated context on what caused a crash to speed diagnosis.
- Firebase-native integrations: Connects to Jira, Slack, BigQuery, and Android Studio out of the box.
Why choose Firebase Crashlytics: If your product is mobile-first and you already use Firebase for analytics, auth, or messaging, Crashlytics is the obvious starting point. It removes cost from the equation entirely, which is hard to beat for early-stage mobile teams.
Firebase Crashlytics pricing: There is no cost to use Crashlytics. It is free, which makes it a low-risk addition to any mobile stack already touching Firebase.
9. SmartBear Insight Hub
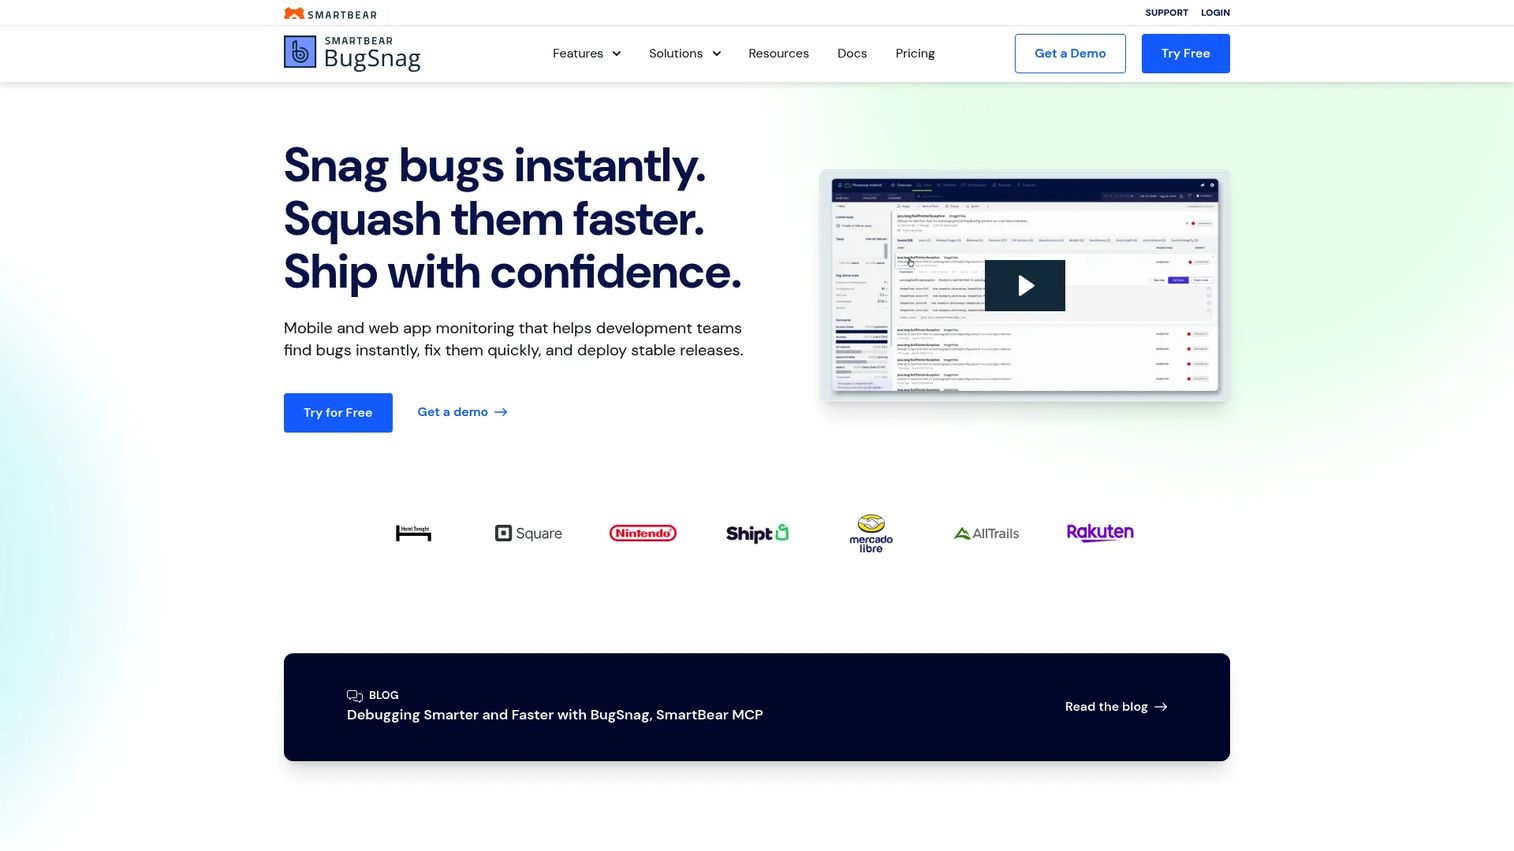
SmartBear Insight Hub is developer observability software for error monitoring, performance monitoring, and distributed tracing. It is the evolution of BugSnag under SmartBear, carrying forward the same stability-focused engine while positioning it inside a broader developer observability story. Teams that valued Bugsnag's approach to app health will recognize the DNA here.
Insight Hub keeps the stable-app-health lens front and center: error monitoring and crash reporting, performance monitoring, and distributed tracing that connects an error to the request path across services. Release insights help teams judge whether a deploy improved or degraded stability, and the diagnostic data attached to each issue supports faster root cause analysis. It fits teams that want app health and tracing consolidated in one observability tool.
Best for: Teams that want error monitoring, performance insights, and distributed tracing in a single observability tool.
Key strengths
- Error and crash monitoring: Carries forward Bugsnag's stability-focused diagnostics.
- Performance monitoring: Tracks app performance alongside errors for a fuller picture.
- Distributed tracing: Connects an error to the request path across services.
Why choose SmartBear Insight Hub: Pick Insight Hub when you want the Bugsnag stability engine plus tracing under one roof, backed by SmartBear's broader developer tooling. It suits teams that think in terms of overall app health and release insights rather than isolated exceptions.
SmartBear Insight Hub pricing: The pricing page shows Free, Select, and Preferred tiers, with Select and Preferred starting at $0/mo and scaling with usage. Enterprise requires contacting sales. Confirm current metered rates before committing.
Considerations before you buy
Feature checklists look similar across vendors. What separates a tool that sticks from one the team abandons is fit with how you actually work. Here is what to pressure-test.
Noise reduction and issue grouping
A monitoring tool that floods the team gets muted, and a muted tool catches nothing. Evaluate how aggressively each tool deduplicates related errors and whether grouping is accurate. Test it against a real error spike, not a demo dataset. The goal is a queue the team reads every day.
Depth of context per error
Ask what each issue carries: stack traces, user context, release info, breadcrumbs, and where available, session replay. The richer the context, the faster root cause analysis goes. A bare exception with no metadata just tells you something is wrong, not what or why.
Release and deployment tracking
You want to tie an error spike to the exact deploy that caused it. Confirm the tool ingests release markers from your CI/CD pipeline and shows error rates per version. This is what turns "when did this start?" into a one-click answer during incident response.
Integrations with your developer workflow
An error should become a ticket, an alert, and a Slack message without manual copy-paste. Check for native integrations with your issue tracker, chat, and CI/CD. The less friction between detection and action, the more the tool actually gets used. If you care about the wider health picture, weigh how it complements your existing application performance monitoring setup.
Pricing model and scale
Most tools price on event volume, sessions, or hosts. A plan that looks cheap at launch can spike as traffic grows. Model your expected volume at 3x current scale and check what the bill becomes. Look for usage capping if predictable spend matters.
Conclusion
The right pick depends less on rank and more on your stack. For full-context web and full-stack debugging, Sentry is the most complete single tool, connecting errors, traces, logs, and replay with AI-assisted triage. Teams fighting queue fatigue should look at Rollbar's grouping and automation. Mobile-first teams have two strong paths: Bugsnag for stability tracking across platforms, and Firebase Crashlytics for free crash reporting inside the Firebase ecosystem.
If you want replay tied to product analytics, LogRocket answers "what was the user actually doing." If real user impact drives your prioritization, Raygun correlates errors to real sessions and deploys. Airbrake fits smaller teams wanting simple setup and predictable cost, and SmartBear Insight Hub suits teams wanting the Bugsnag engine plus distributed tracing.
Next step: pick two tools that match your platform and stack maturity, run each against a live error spike for a week, and judge them on one thing above all: does the team actually open the queue and act on it? That, not the feature list, is what protects activation, retention, and support load over time. Strong observability starts with catching failures before your users do.
FAQs
For most SaaS product teams, Sentry is the strongest all-around choice because it unifies error tracking, tracing, logs, and session replay with rich release tracking. What matters for a product team is context richness and cross-team visibility: engineering fixes issues faster, while support and product see who was affected and how badly. The best tool is the one that turns a raw exception into a prioritized, shareable issue everyone can act on.
The software is technically developer-facing, but the business impact is squarely product-facing. Silent production bugs erode activation, drag down retention, and inflate support load, all of which land on a PM's metrics. Error monitoring gives product managers a data-backed way to prioritize fixes by user impact and to protect the customer experience, so it is very much a PM concern even if engineers use the dashboard most.
They solve different parts of diagnosis, so it is not really either-or. Stack traces show where in the code a failure happened, which is essential for the engineer writing the fix. Session replay shows what the user experienced before and after the failure, which is essential when the bug is really a confusing flow or an edge-case interaction. Tools like LogRocket and Sentry offer both, and the combination speeds root cause analysis more than either alone.
Frame it as product depth versus platform breadth. If your team wants focused error debugging and a fast evaluation, Sentry is usually easier to adopt and answers "what broke and why" out of the box. If you already run Datadog broadly for infrastructure, APM, and logs, its Error Tracking fits neatly into that stack and gives you logs and traces correlation without adding a vendor. The deciding factor is whether you are consolidating into a platform or want a dedicated error tracking tool.
Yes. Mobile teams care more about crash reporting, release stability across app versions, and platform-specific diagnostics for Android and iOS. A crash on mobile is a hard, visible failure, and users cannot simply refresh. Firebase Crashlytics and Bugsnag are strong mobile-friendly options, with Crashlytics free and tightly integrated into the Firebase ecosystem and Bugsnag offering cross-platform stability tracking over time.
Most tools use usage-based billing tied to event volume, session counts, or number of hosts, often layered on tiered plans. Some, like Airbrake and Raygun, meter errors directly, while platforms like Datadog price per host across separate products. Because rates and event limits change often, verify current vendor pricing before purchase and model your costs at expected future scale, not just today's traffic.
As quiet as possible while still catching everything that matters. Good tools group related errors into single issues, prioritize by user impact, and suppress duplicate alerts so the team is not buried. Too much noise is the fastest way to get a monitoring tool ignored, and an ignored tool catches nothing. When you evaluate, test grouping accuracy against a real error spike and confirm you can tune alert thresholds to your team's tolerance.