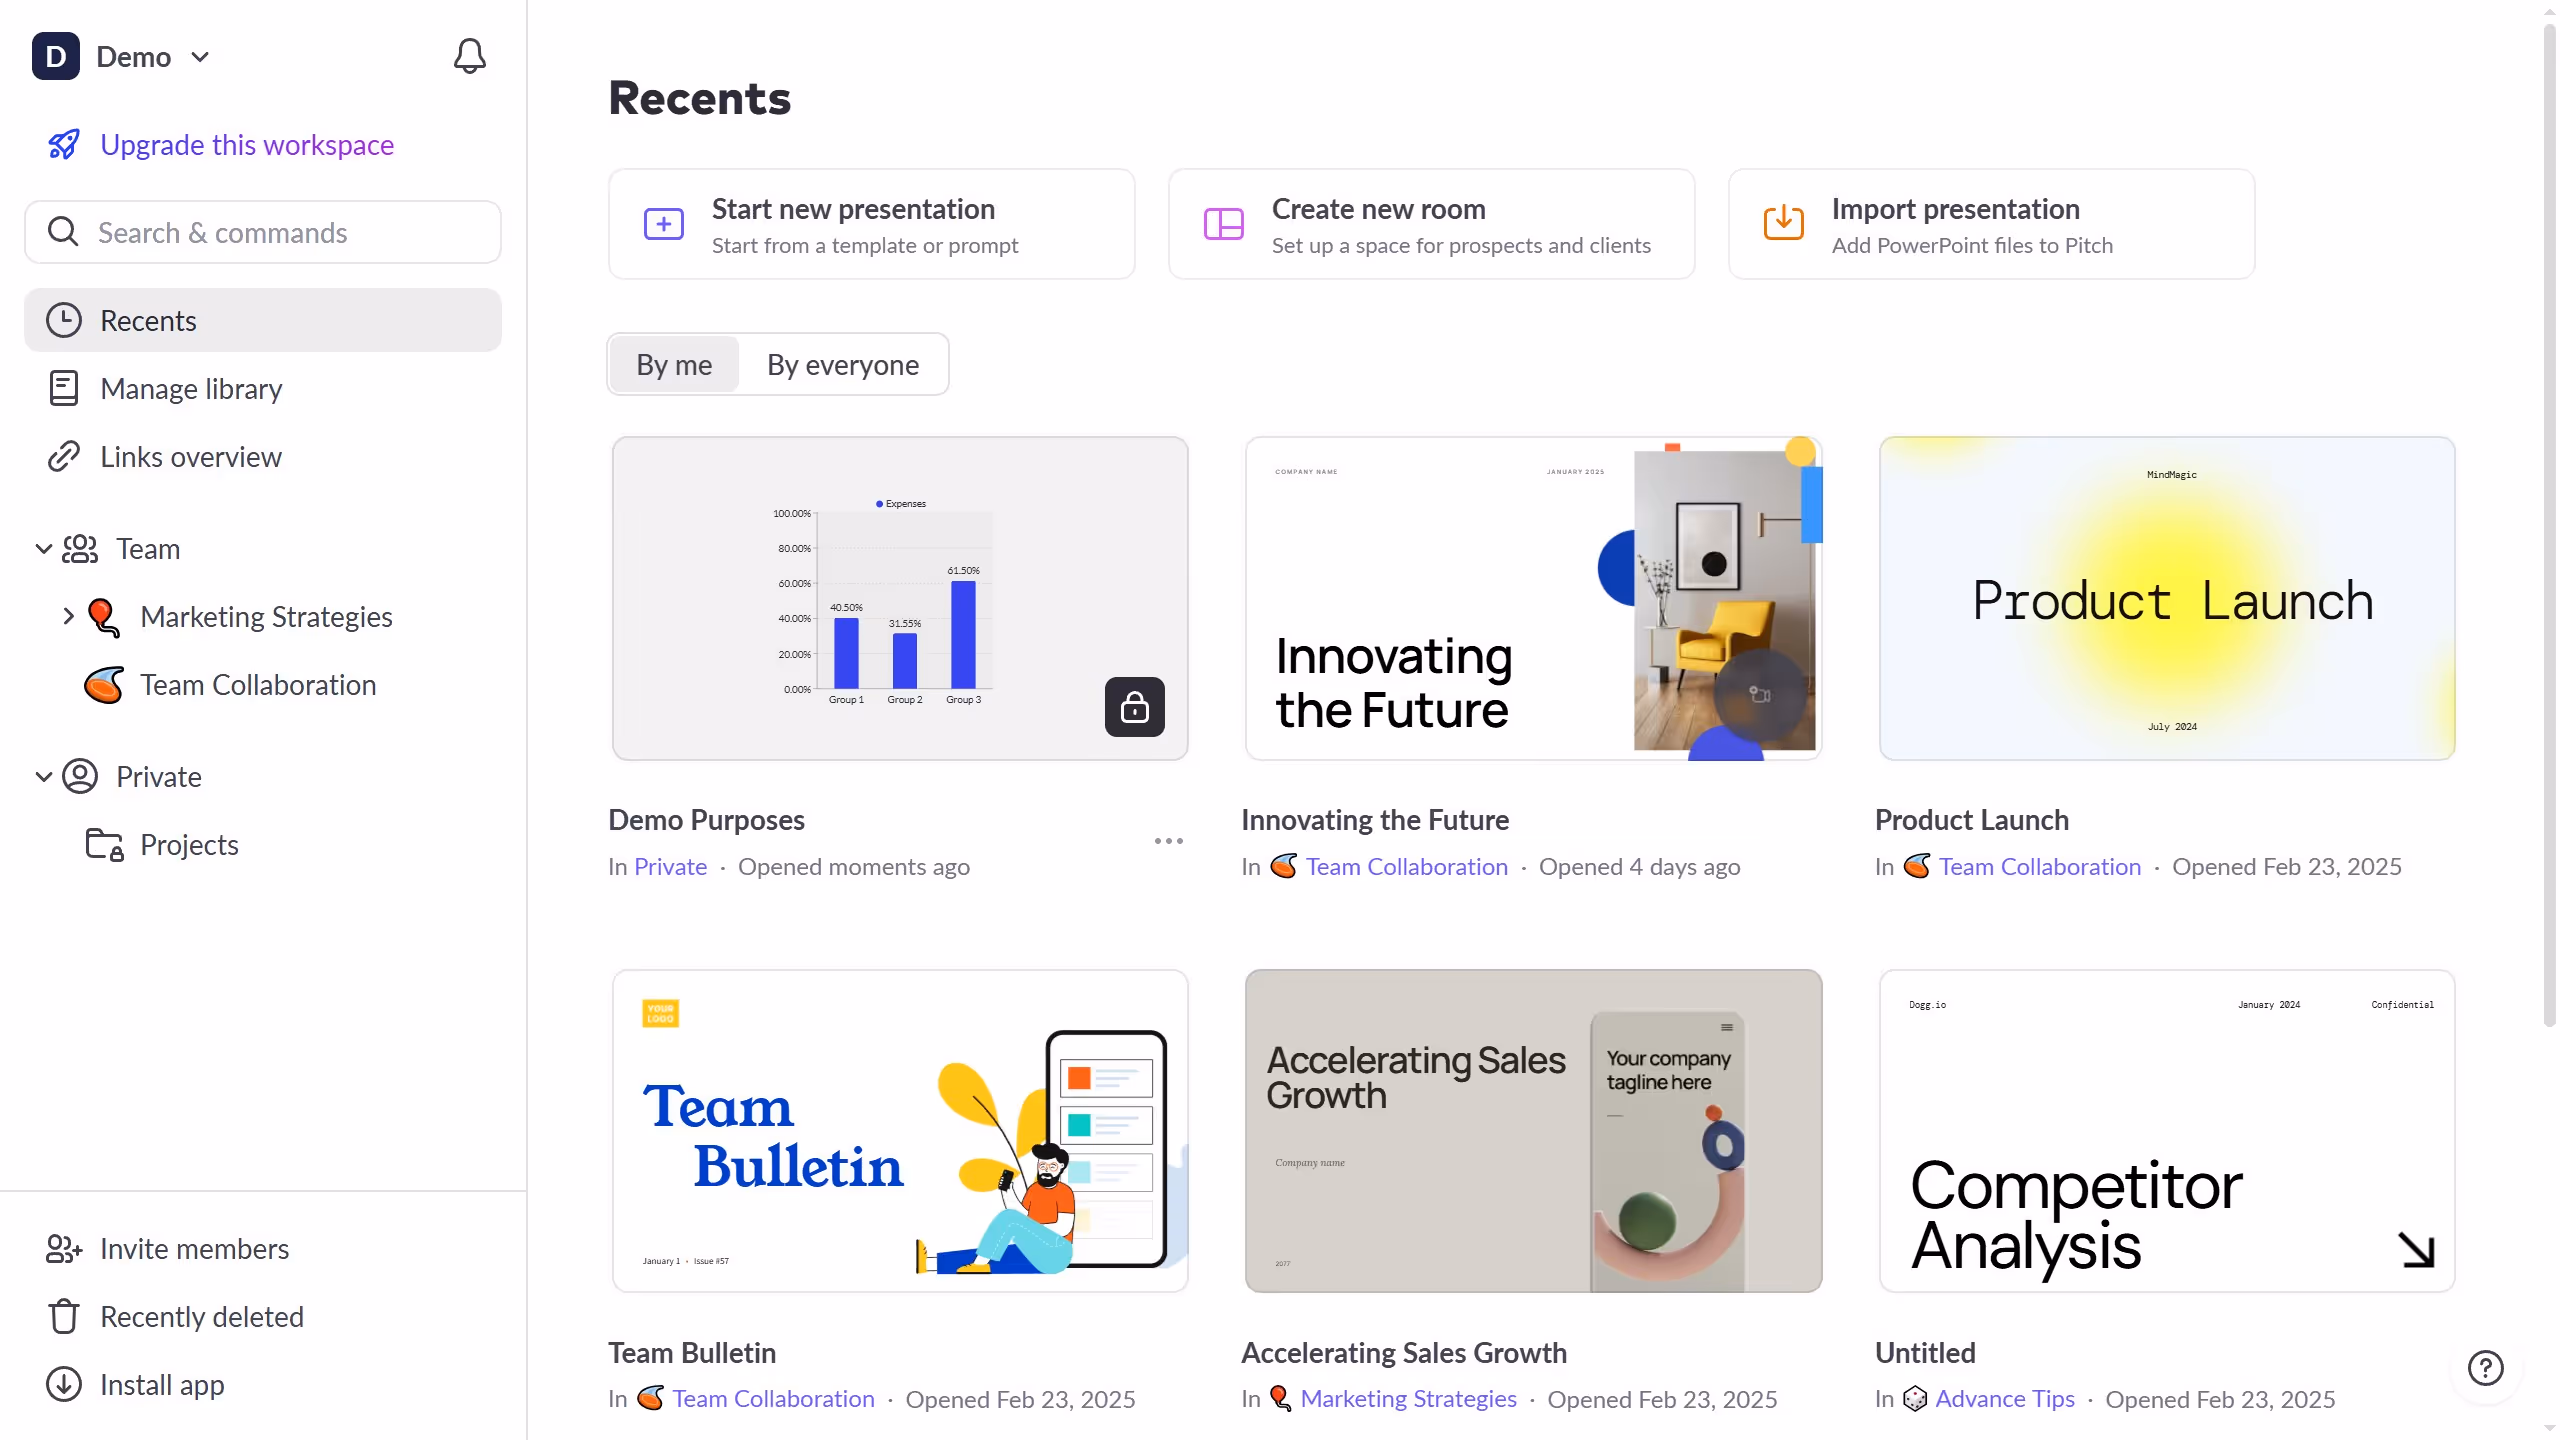
Pitch is a collaborative presentation tool designed to make creating beautiful and functional presentations effortless.
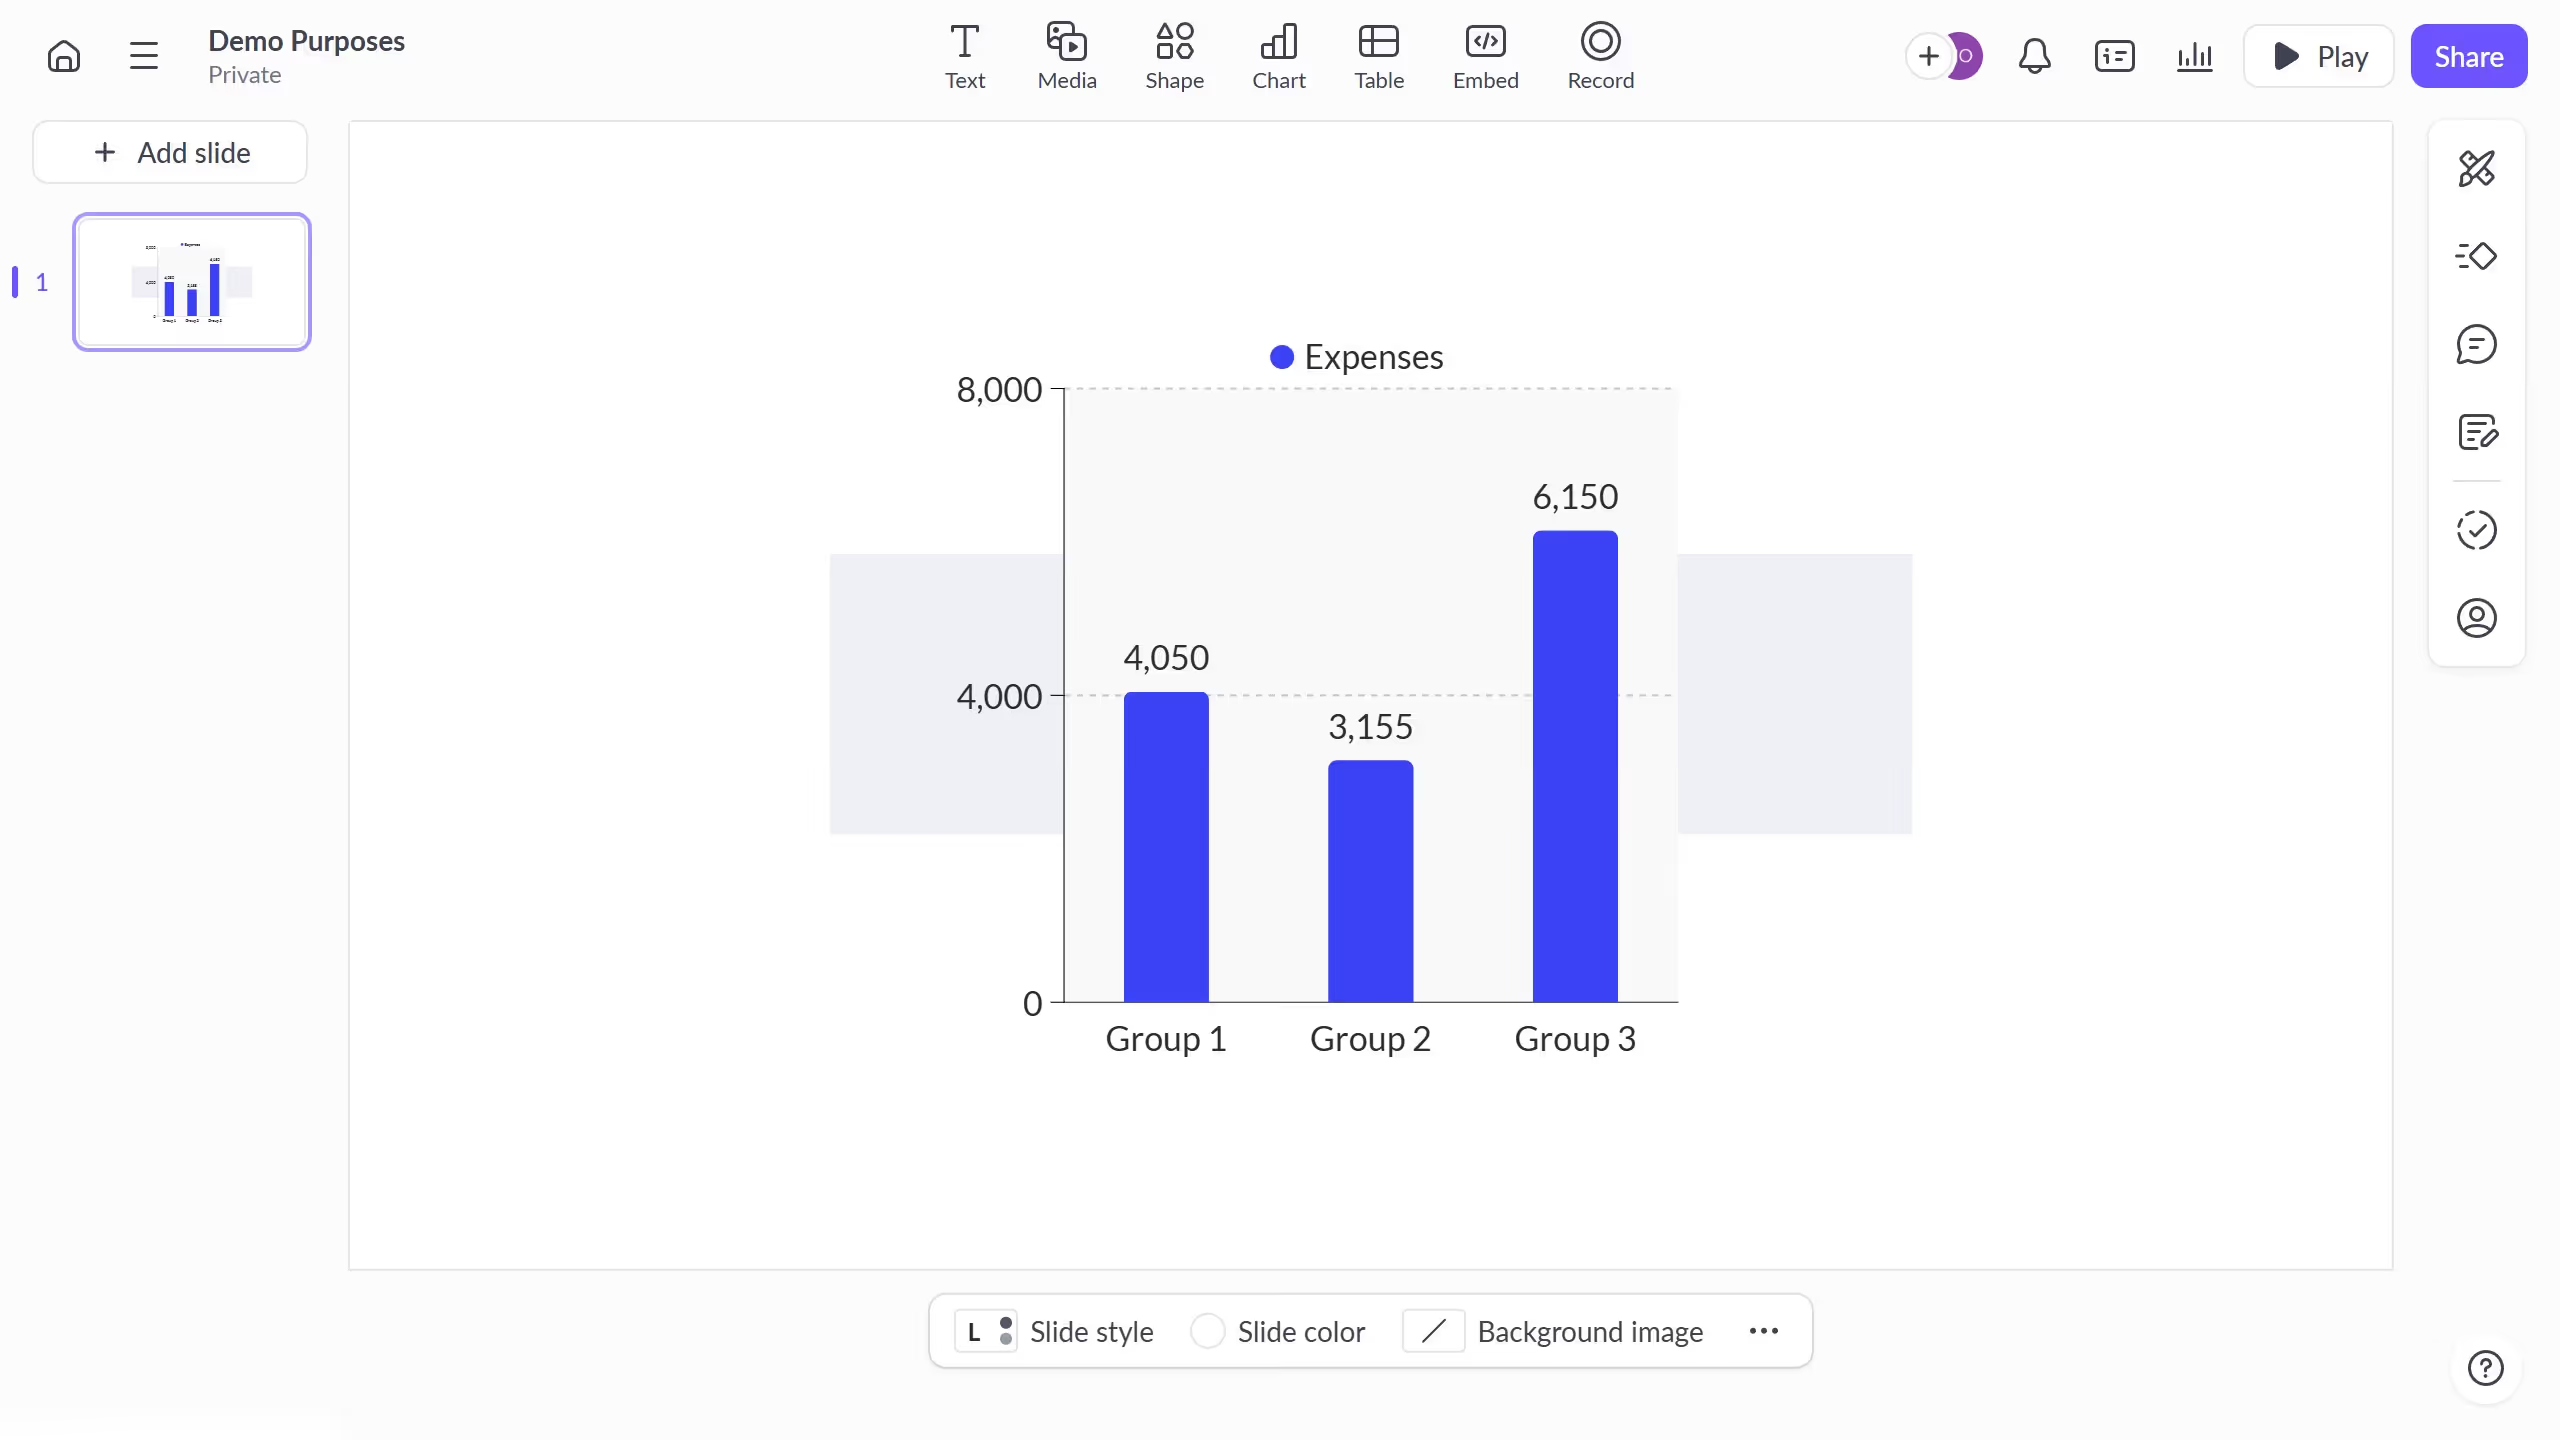
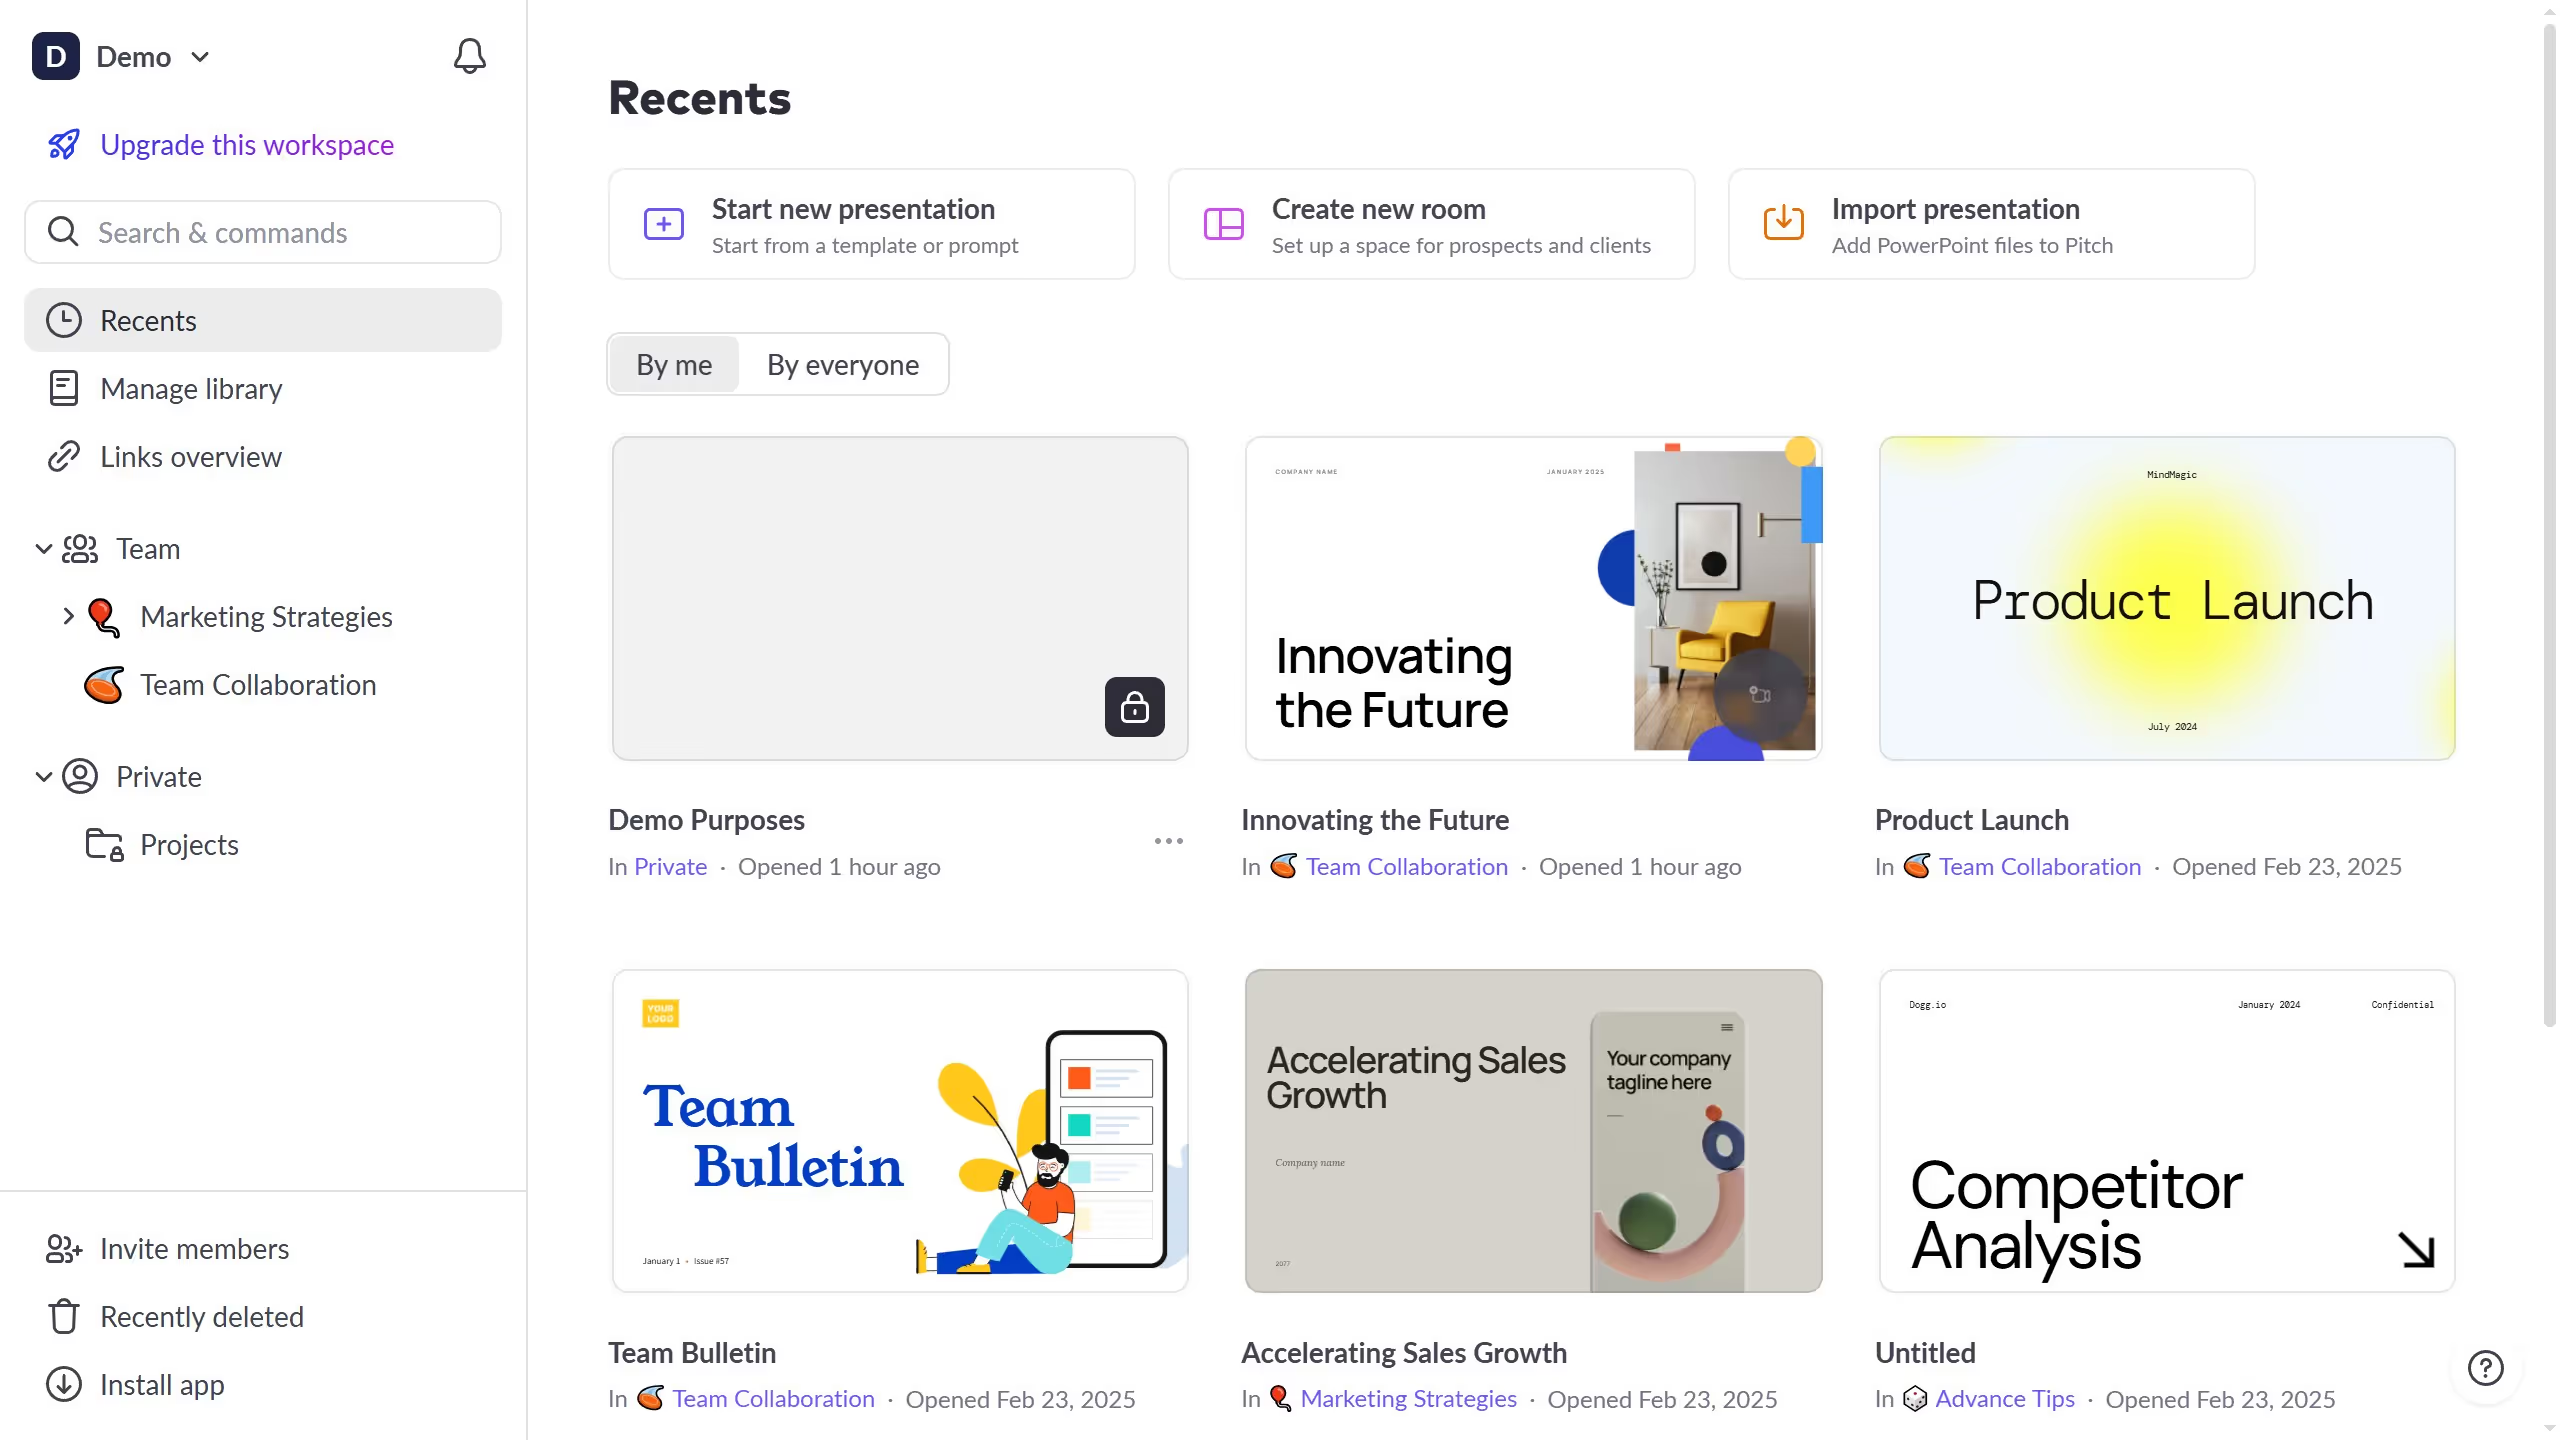
The ability to edit chart data seamlessly in Pitch is one of its standout features. You can easily modify your chart data, ensuring your presentations are always up-to-date and relevant.
Using this feature, teams can collaborate in real-time, enhancing the accuracy of data-driven insights. This streamlined approach saves time and promotes dynamic presentations, all while maintaining a visually cohesive design.