Pitch is a collaborative presentation platform designed to enhance team productivity and creativity.
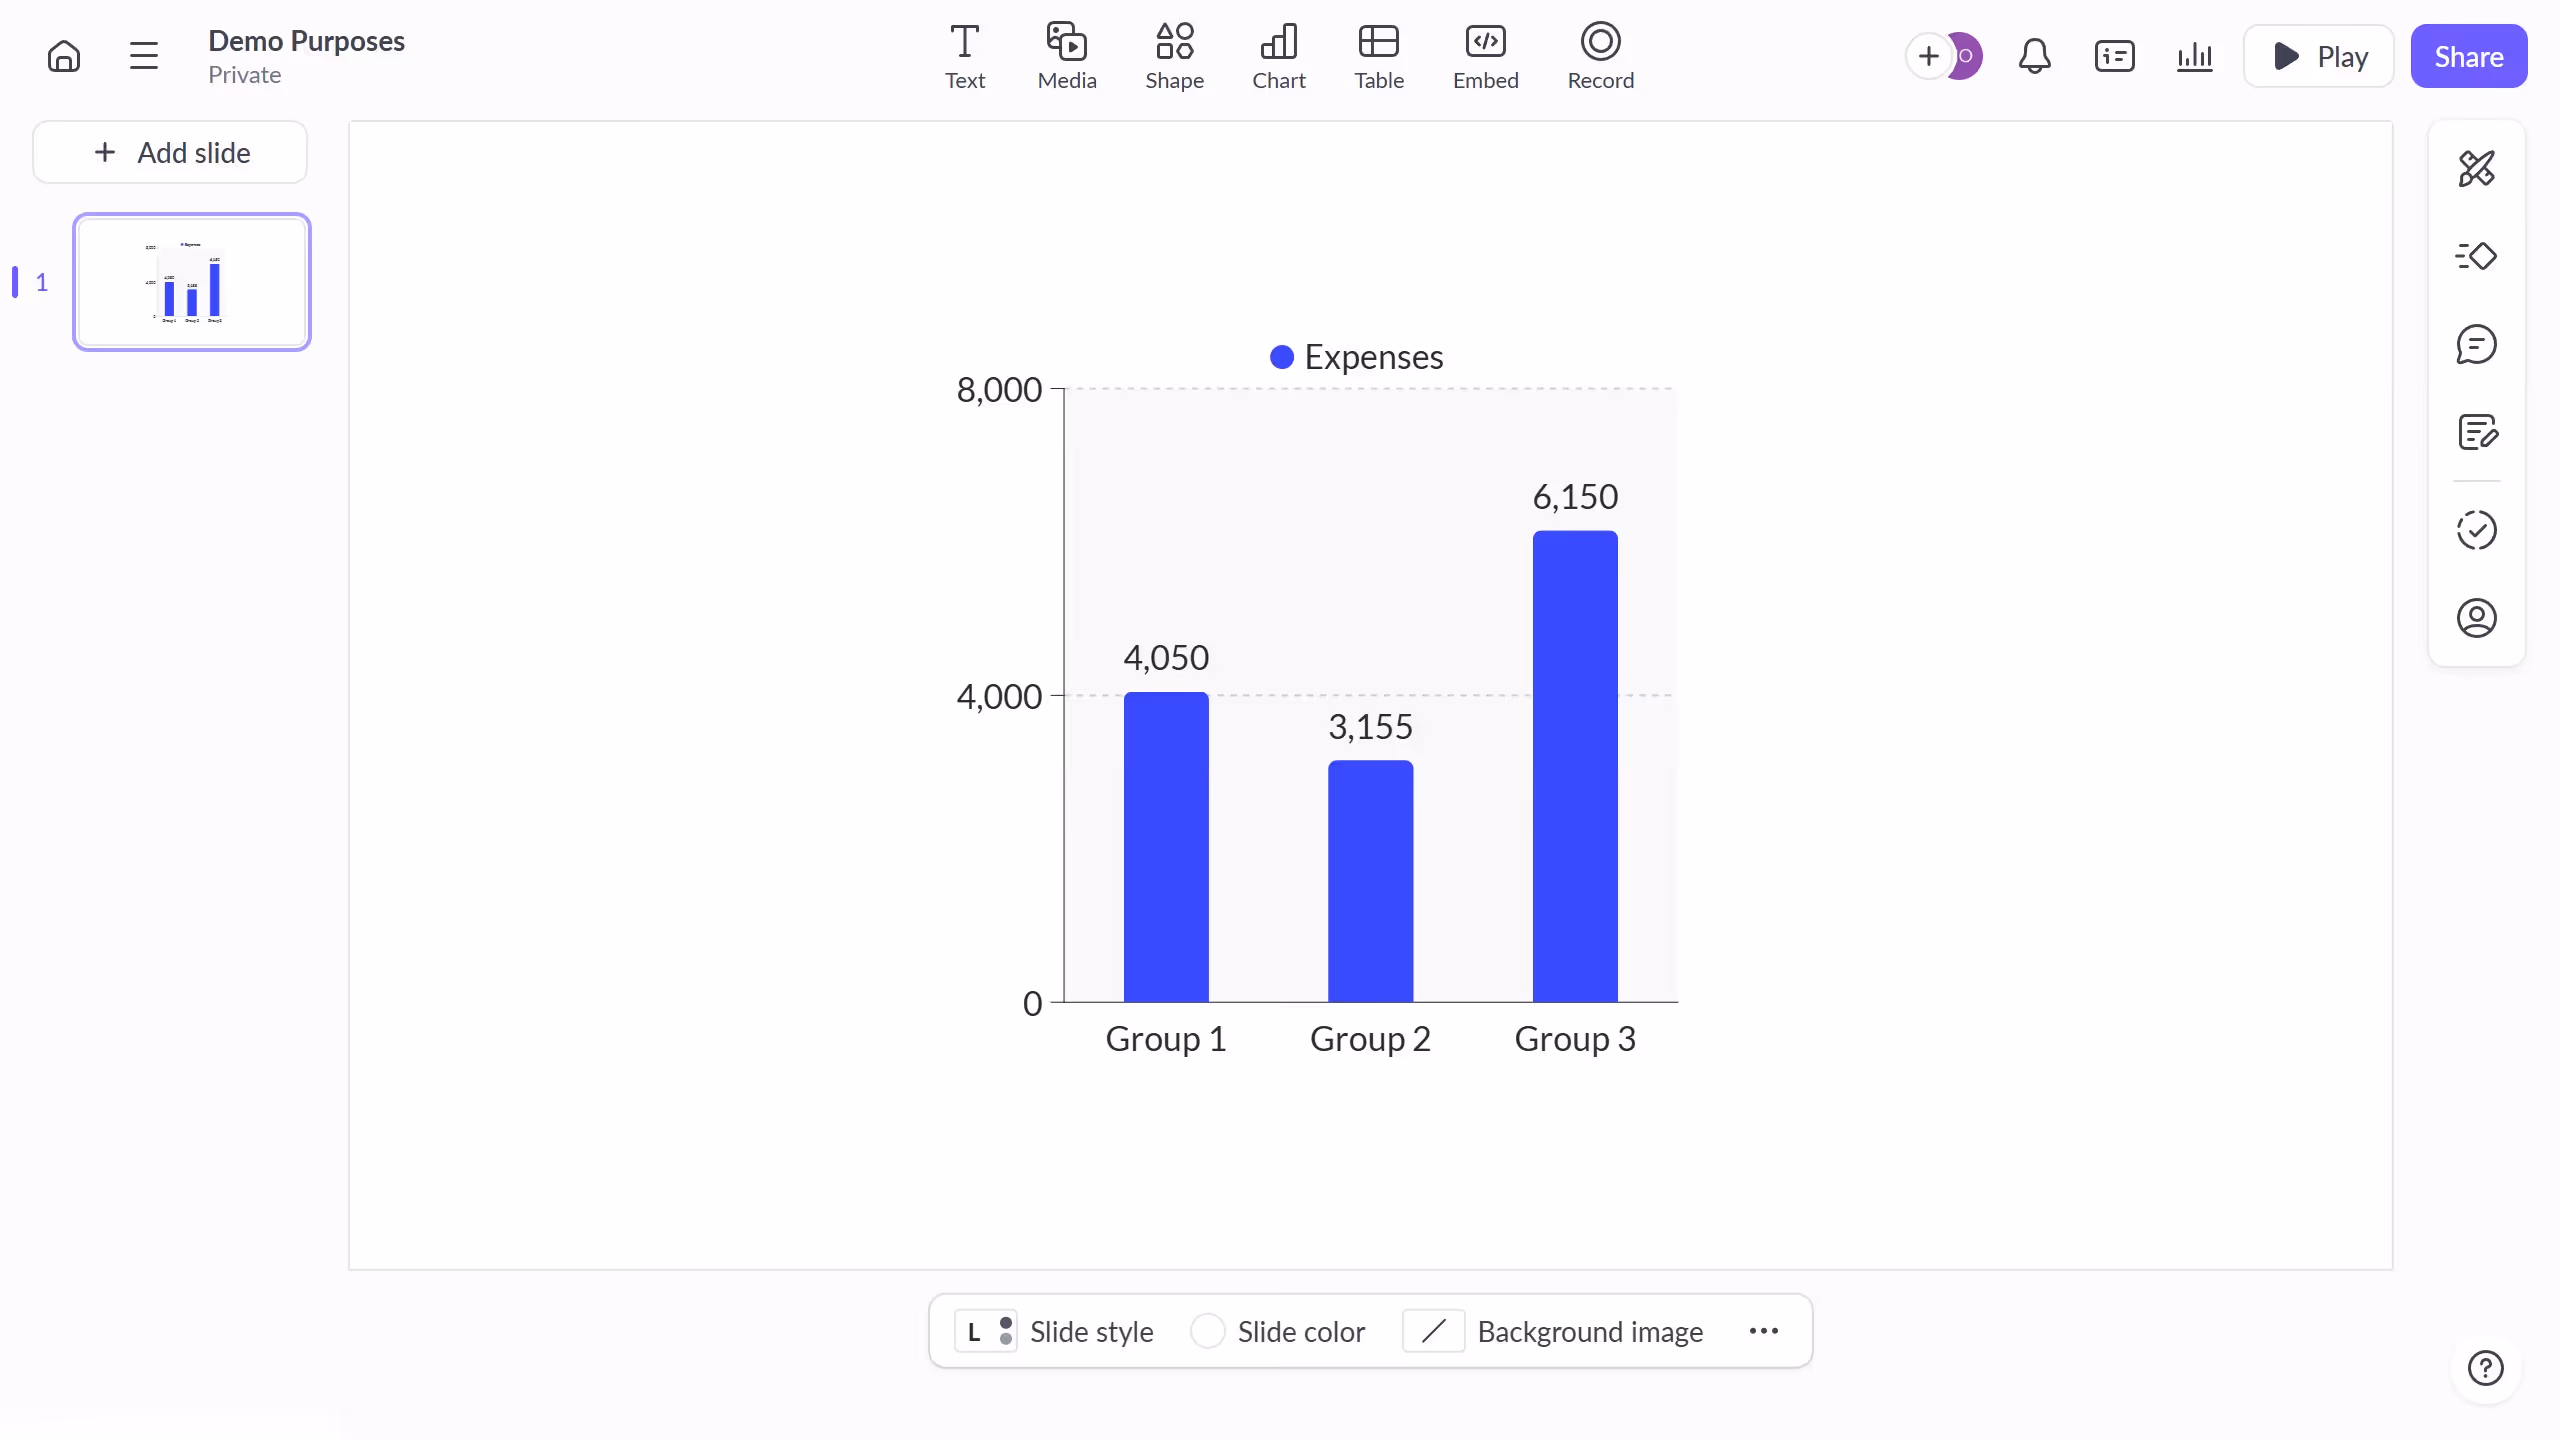
One of its valuable features is the ability to display the chart legend, which is crucial for comprehending data at a glance.
Showing the chart legend in Pitch allows users to contextualize information effortlessly, ensuring everyone understands the data presented.
This feature enhances clarity and communication, making your presentations more impactful and informative while promoting seamless teamwork.