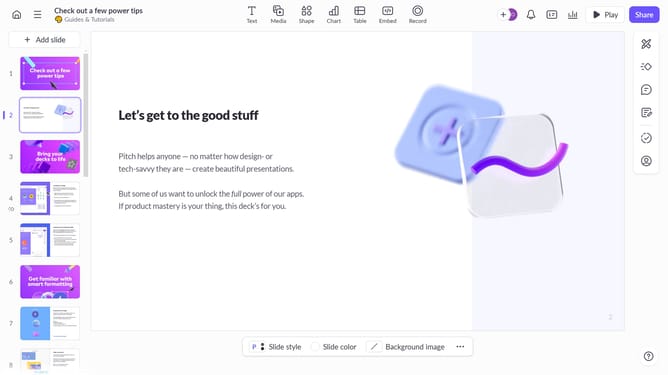
How to show the chart legend on Pitch
Here is how to show the chart legend on pitch
- First, open the presentation containing the chart you want to edit
- Select the slide containing the chart in the slide navigator
- Next, click on the chart to select it
- After that, click on "More options" in the toolbar that appears
- Next locate the "Legend" option in the right-hand panel
- Then, toggle on the switch next to "Legend"
- Finally, customize the legend font as needed
Why should you show the chart legend on Pitch
Pitch is a dynamic presentation tool designed to make your ideas shine with ease and elegance.
Showing the chart legend on Pitch enhances the clarity of your data presentation by visually mapping out each element. It ensures your audience can easily follow along and understand the nuances of your data story.
Integrating chart legends in your presentation is beneficial as it promotes better comprehension by providing a quick reference guide to your chart’s symbols, colors, and patterns. Ultimately, this feature fosters more engaging and compelling presentations.
Last update