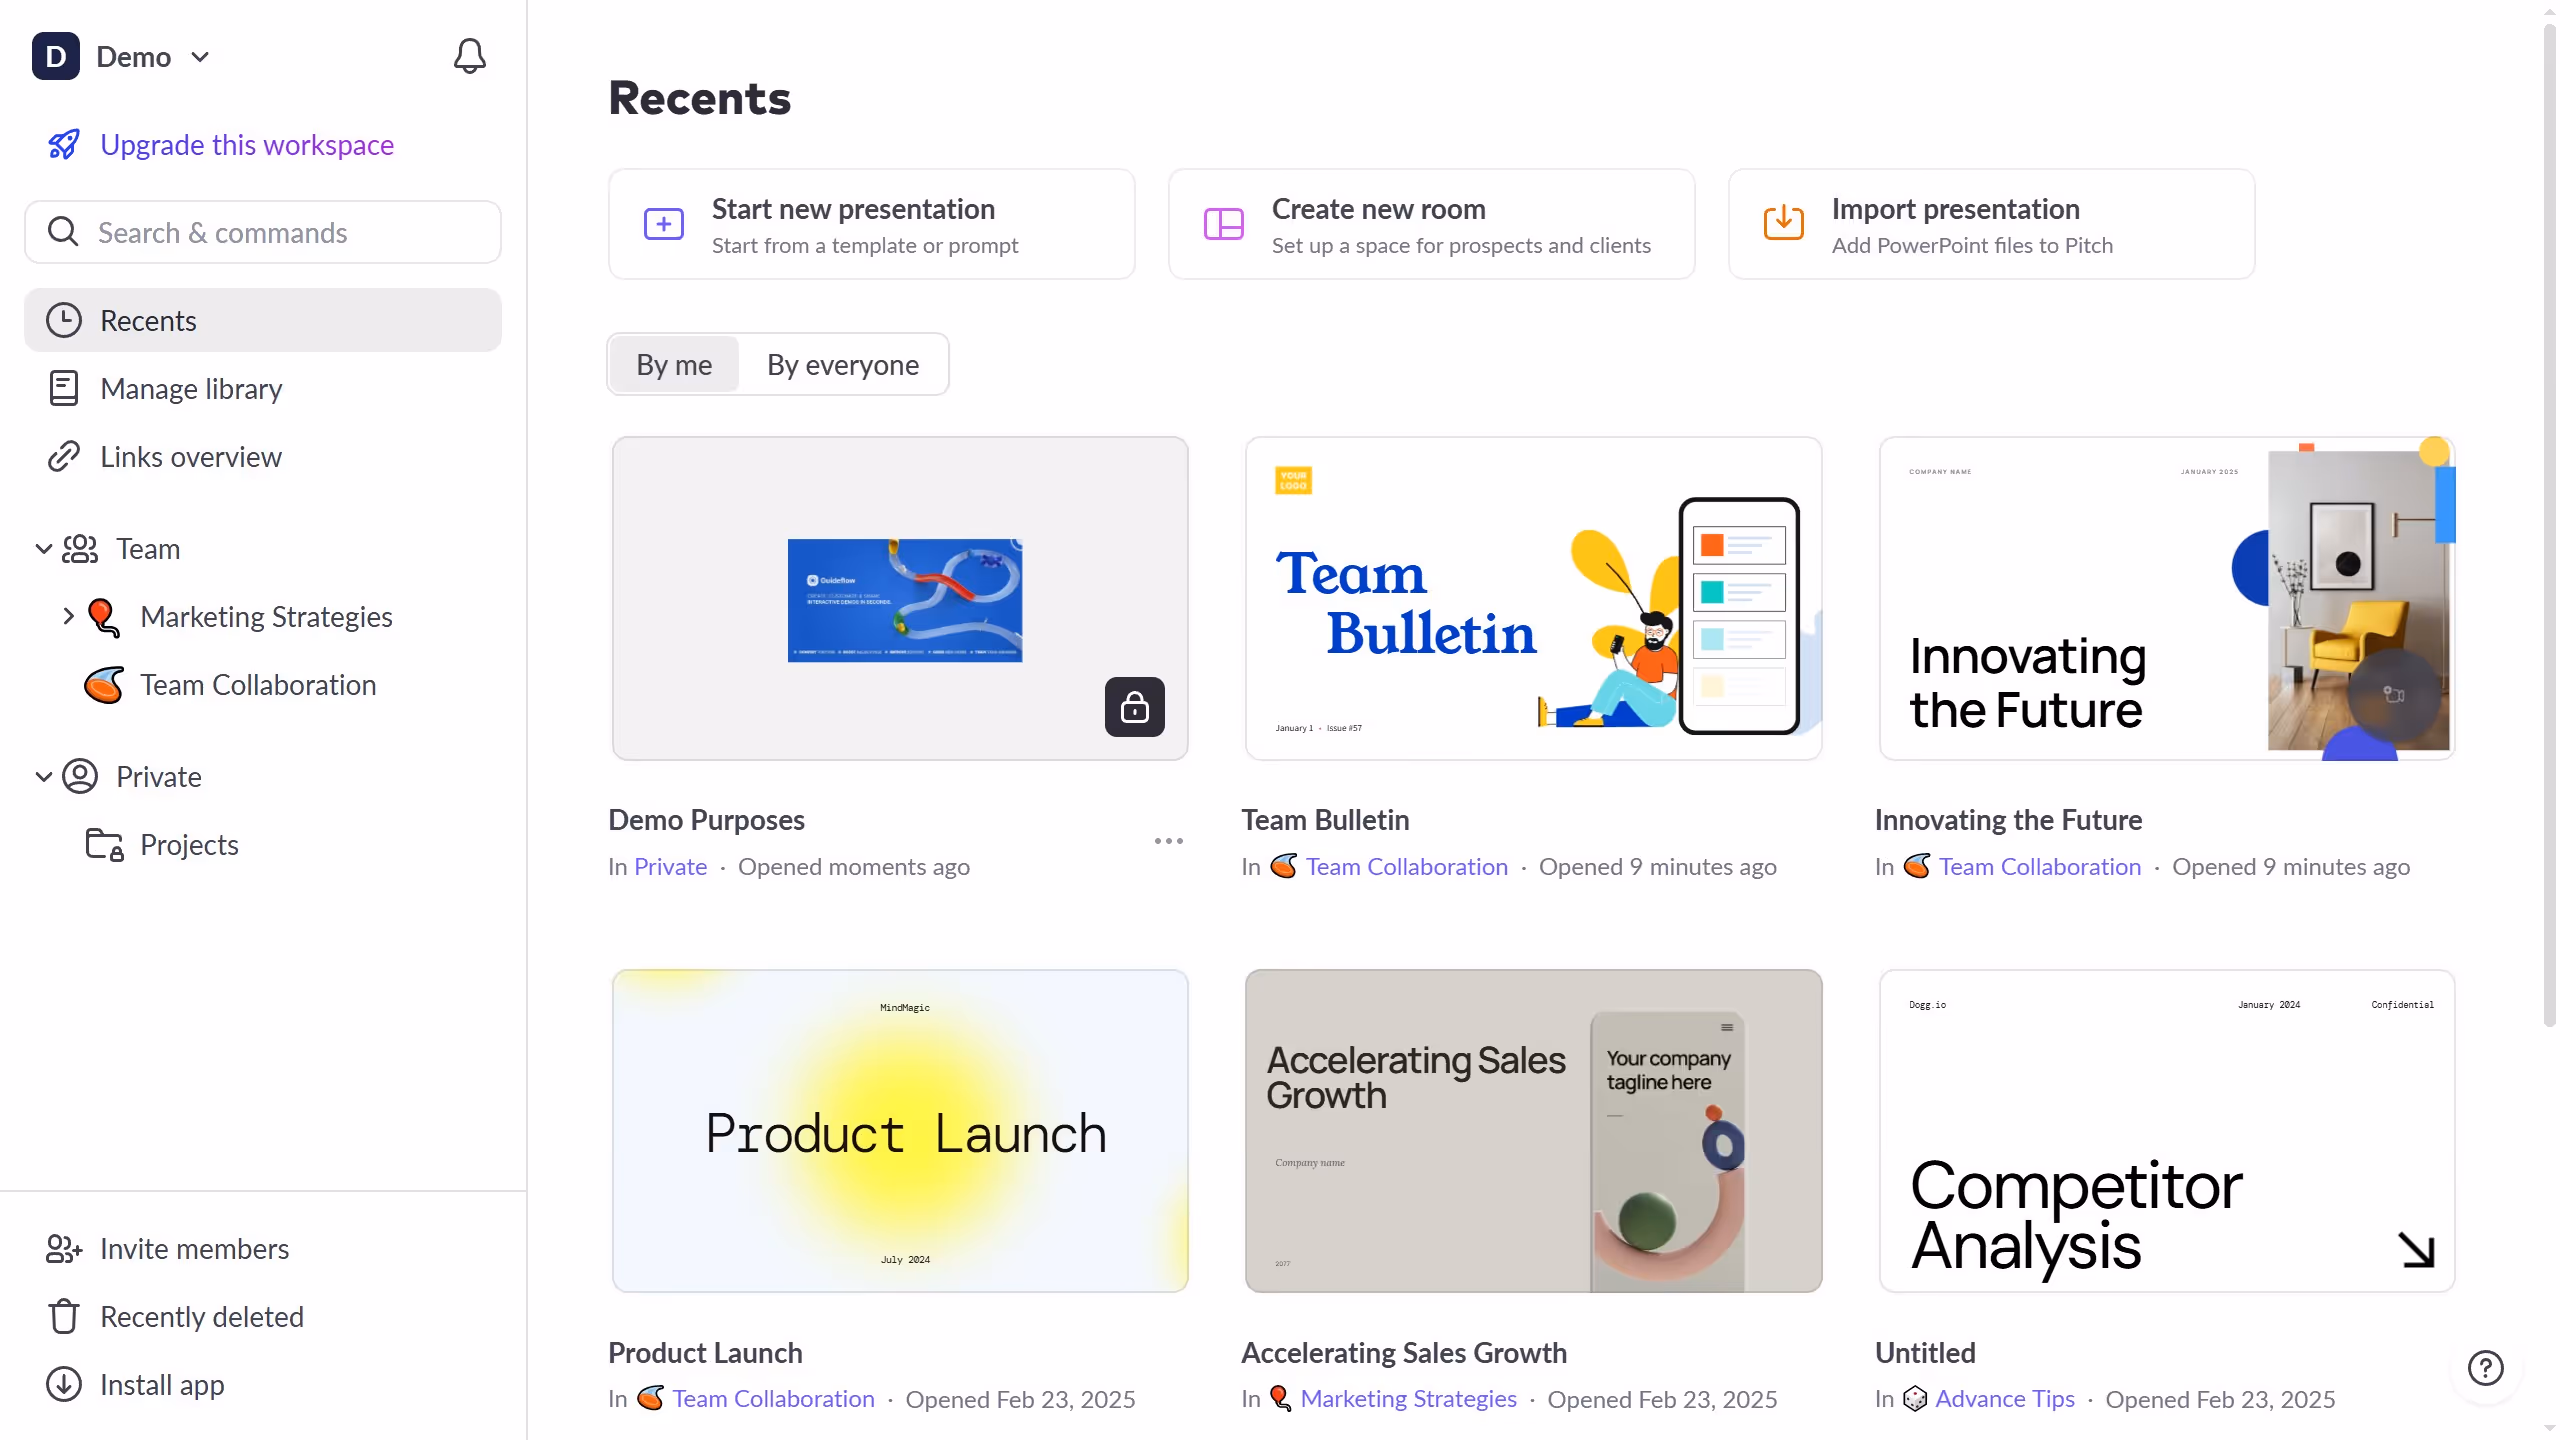
Pitch is a dynamic platform designed to revolutionize presentations with ease and creativity.
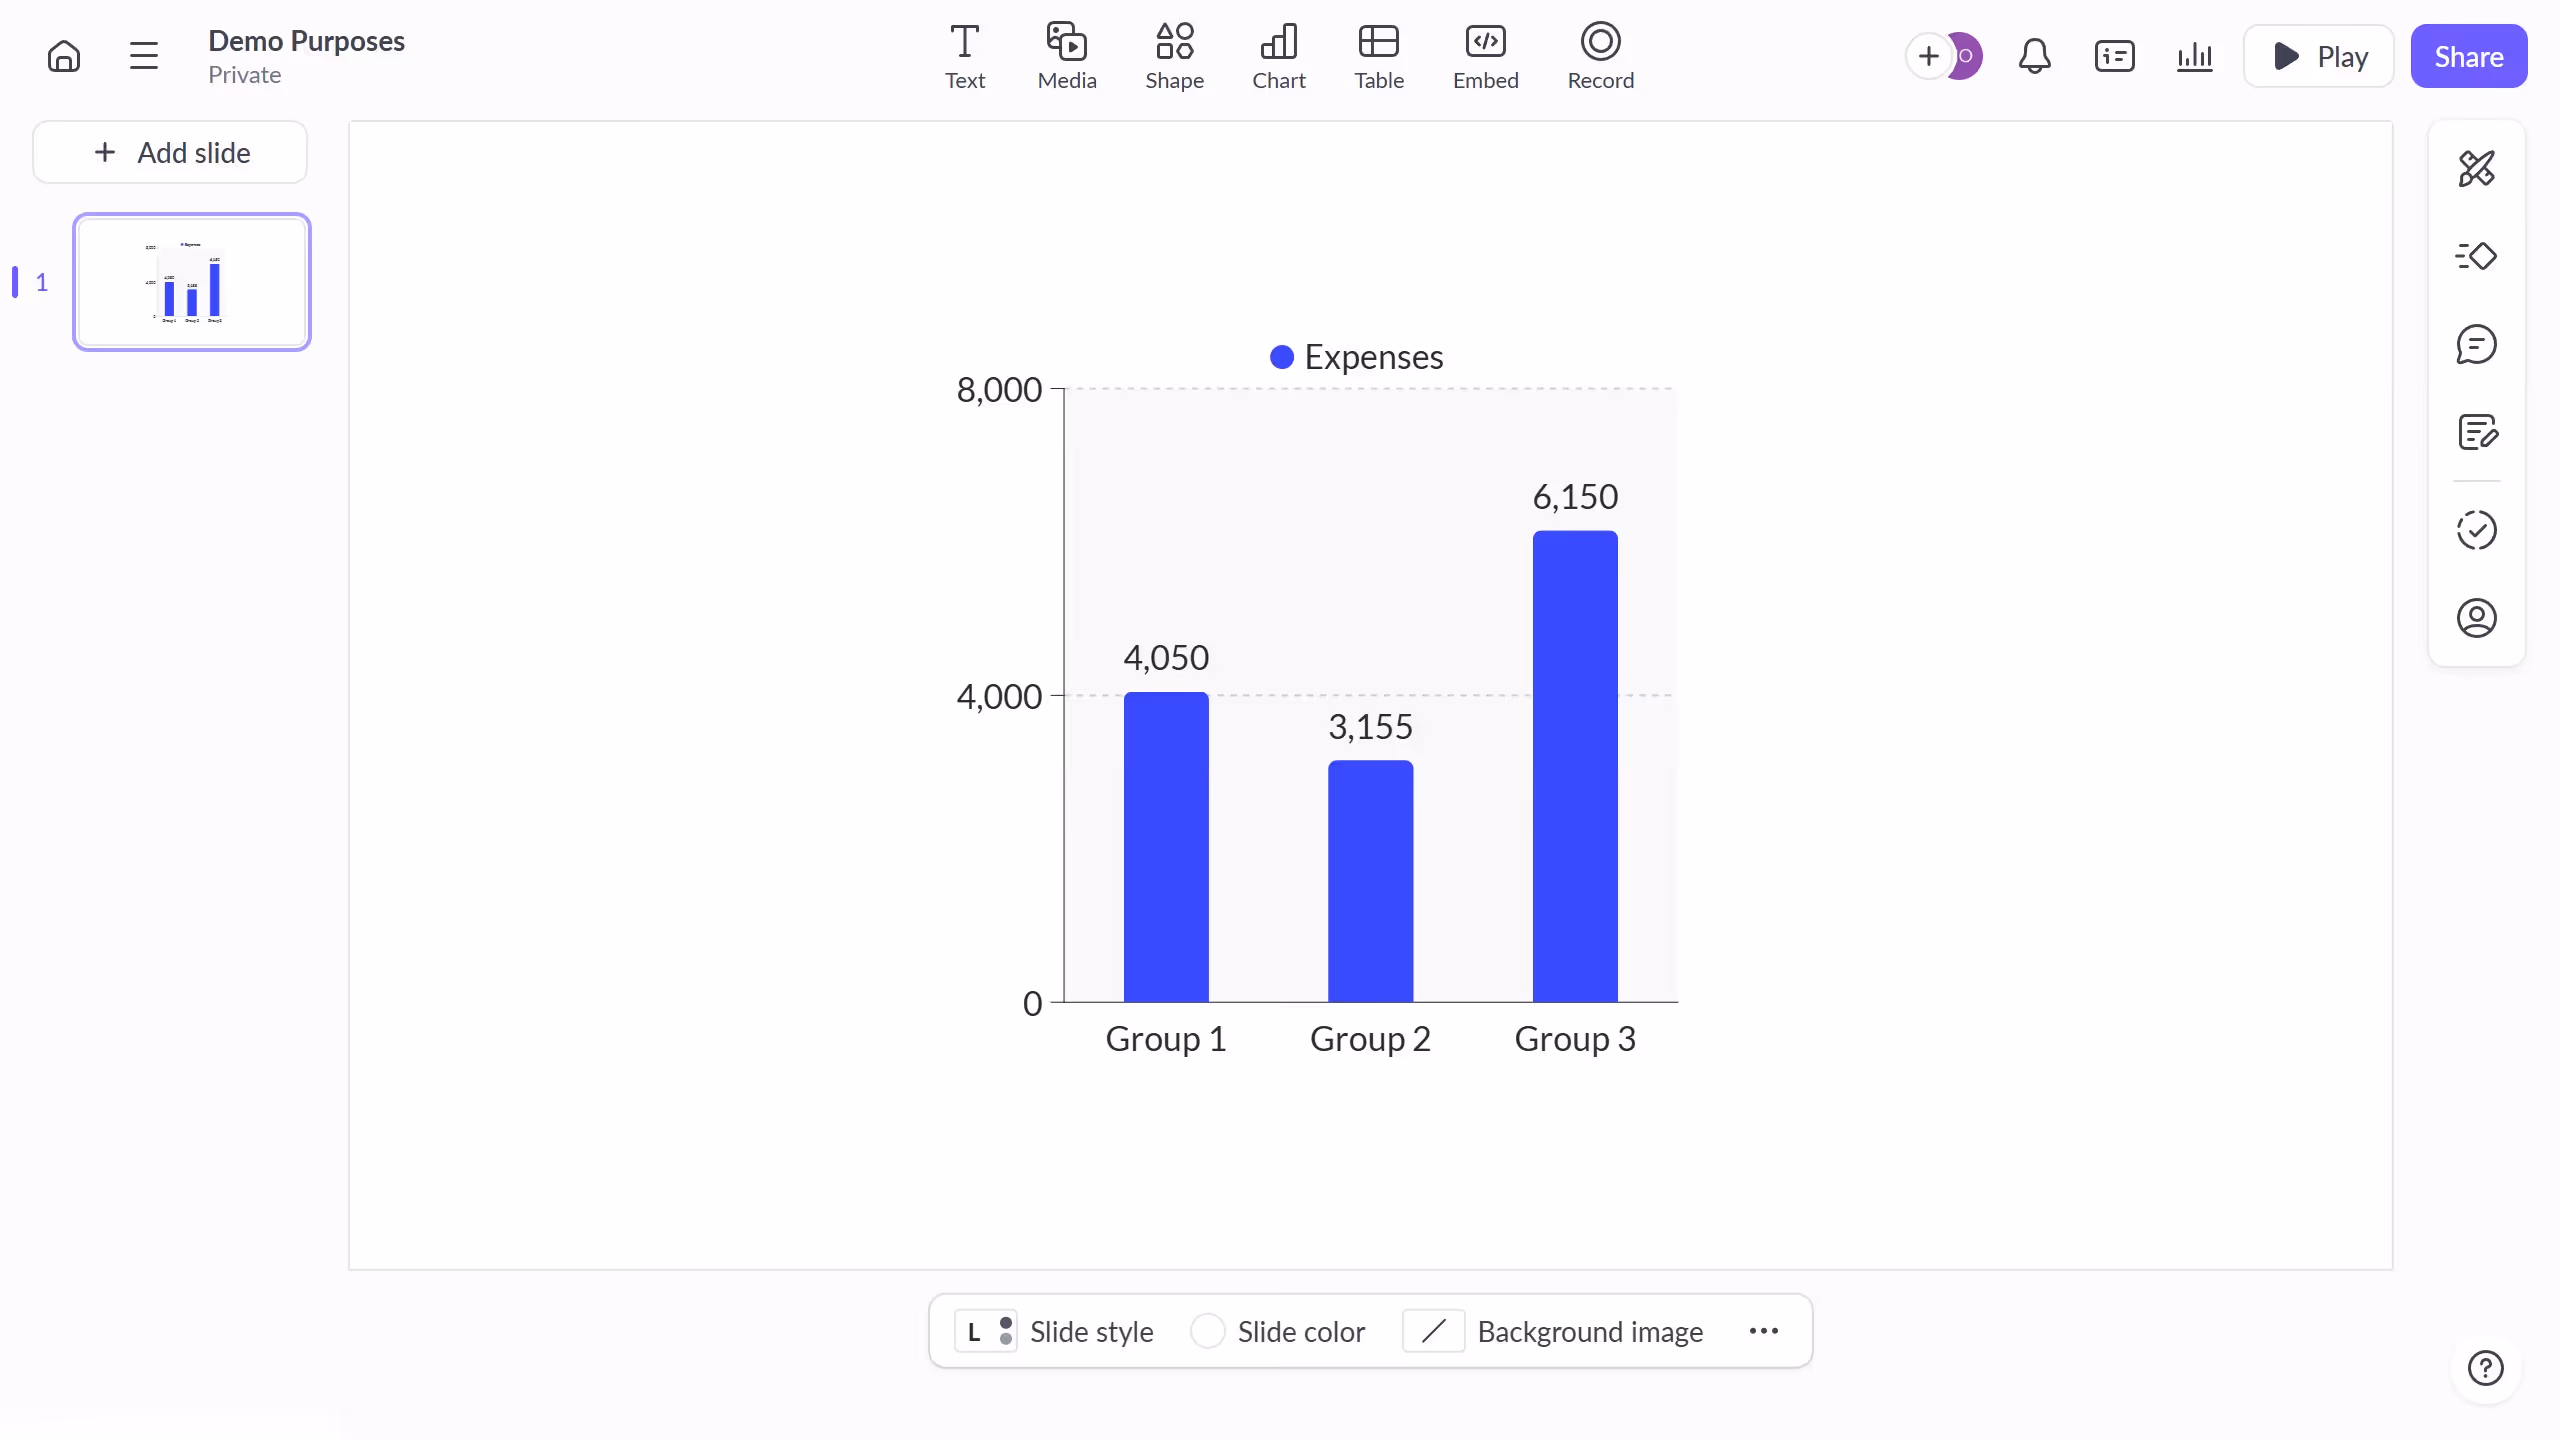
Creating a pie chart in Pitch is a streamlined process that combines simplicity with design excellence. This feature allows users to visually represent data efficiently, making it easier to communicate complex information at a glance.
Using a pie chart in Pitch highlights key insights, helping viewers quickly understand proportions and relationships within data sets. This not only enhances engagement but also aids in decision-making by offering clear visual cues.
Overall, integrating pie charts into your Pitch presentation enriches content clarity, promotes enhanced comprehension, and optimizes audience interaction.