Pitch stands as a modern platform that empowers teams to create stunning presentations effortlessly.
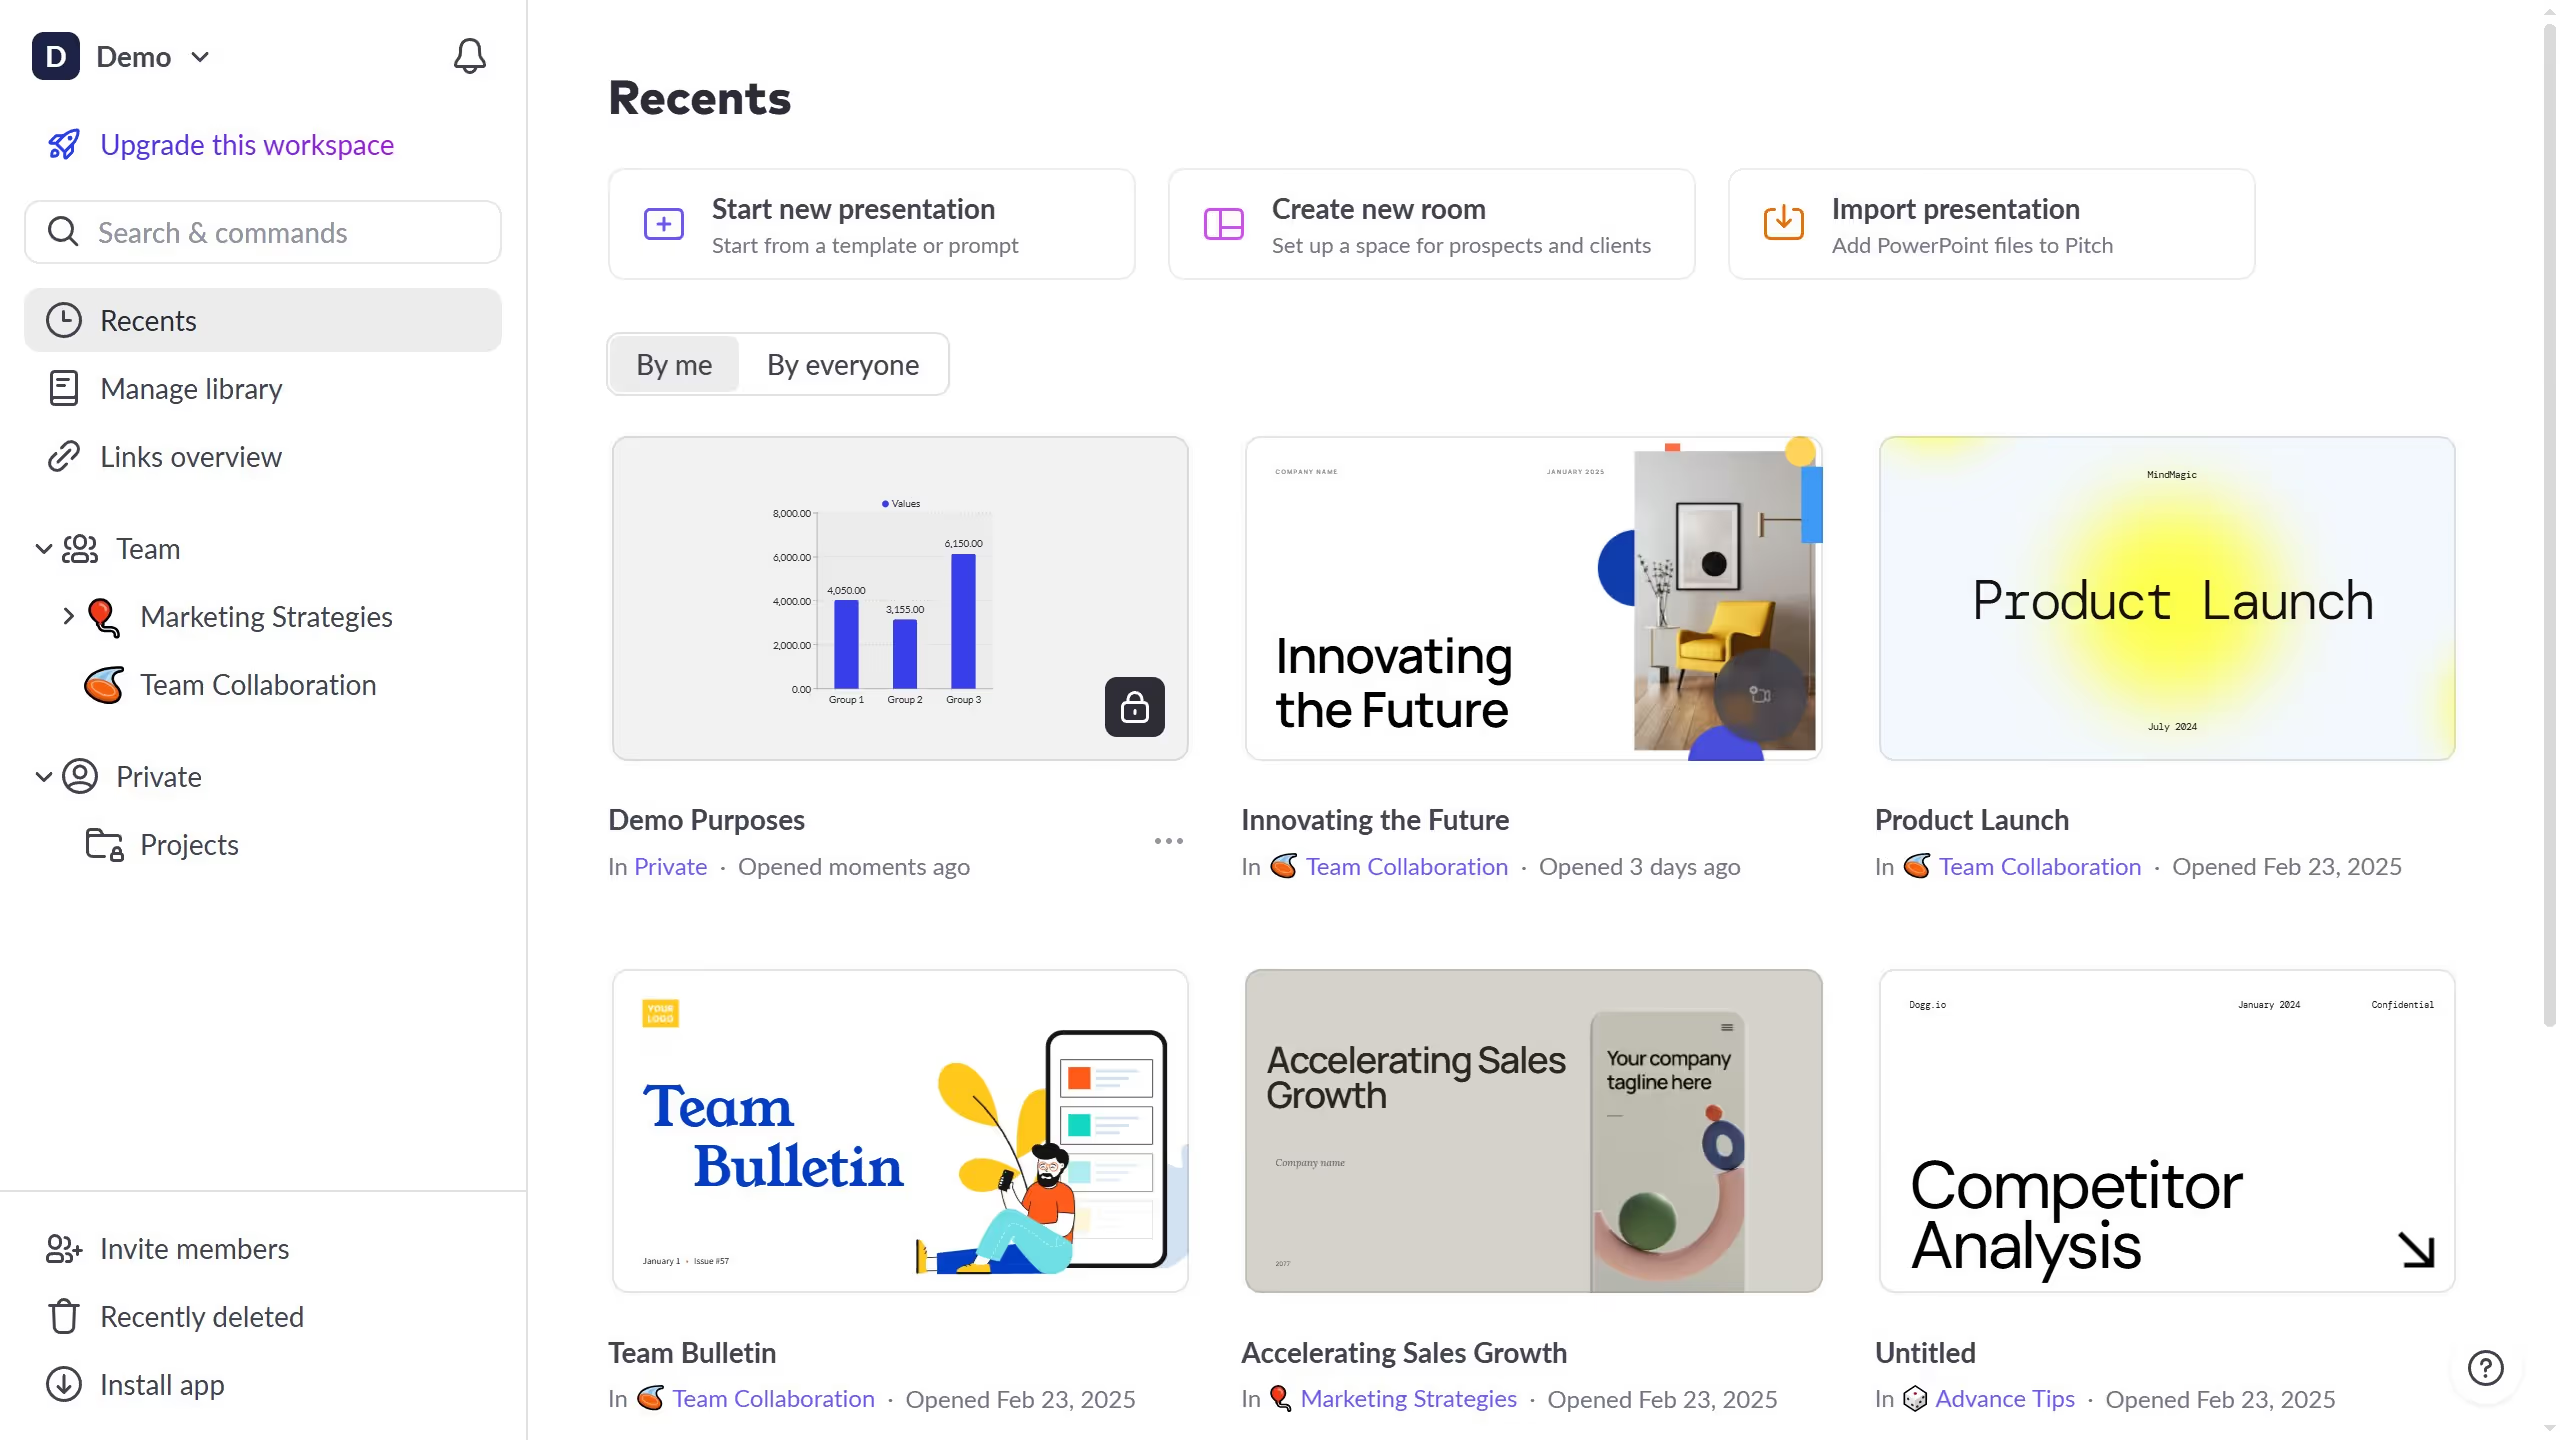
With the feature to format numbers in charts, Pitch allows users to present data more clearly and effectively, enhancing the understanding of complex figures.
The ability to customize number formats assists in maintaining consistency and professionalism, reinforcing the visual appeal and coherence of your presentations.
By using this feature, teams can ensure their insights are communicated with precision, making data-driven decisions more accessible and impactful.