How to show scale labels on a chart on Pitch
Here is how to show scale labels on a chart on pitch
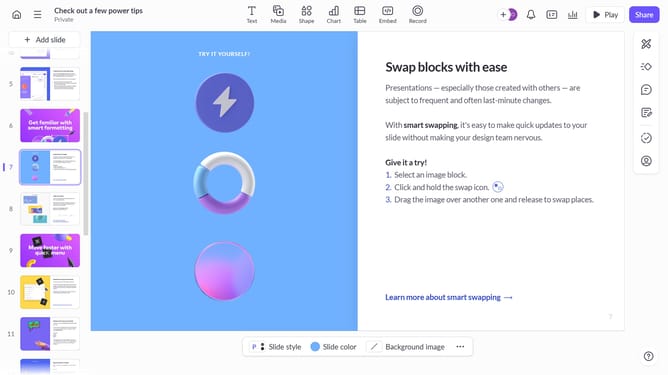
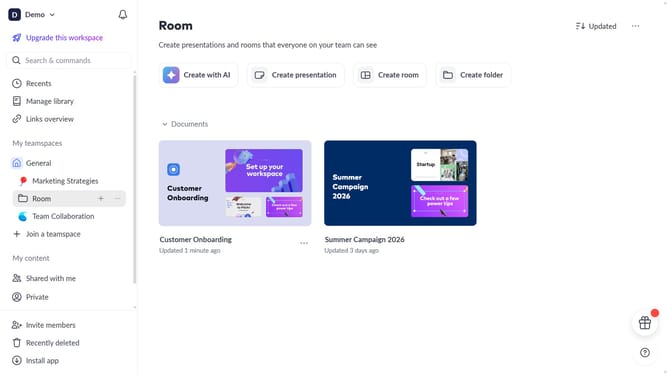
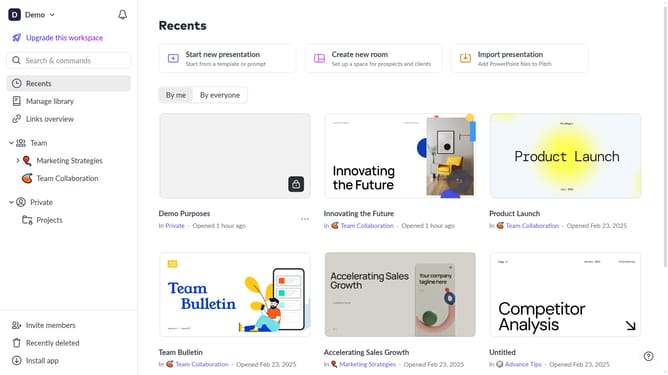
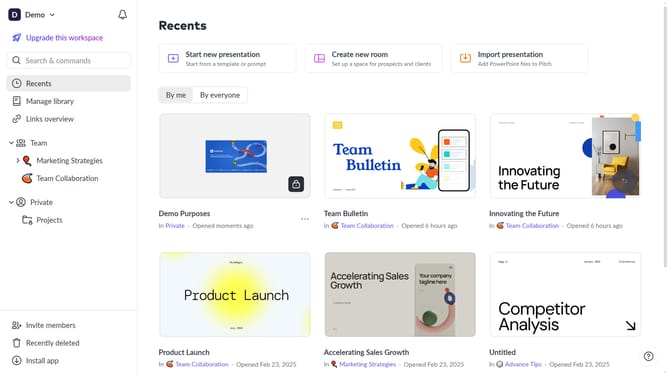
- First, open the presentation containing the chart you want to edit
- Select the slide containing the chart in the slide navigator
- Next, click on the chart to select it
- After that, click on the "More options" button in the toolbar that appears
- Next locate the "Scale labels" option in the right-hand panel
- Then, toggle on the switch next to "Scale labels"
- Finally, customize the scale labels font
Why should you show scale labels on a chart on Pitch
Pitch is a dynamic presentation platform designed to make collaboration easy and inspiring.
Among its array of powerful features, Pitch allows you to show scale labels on a chart, enhancing clarity and understanding.
This function ensures that every data point you present is easily digestible, setting the tone for impactful storytelling.
With scale labels, your audience grasps the nuances of your data, transforming complex figures into accessible insights that captivate and inform.
Last update