Pitch
Pitch.com is a modern presentation software that combines design, collaboration, and storytelling.
Website
Industry
Collaboration
Share this article:

How to switch chart types in Pitch

How it works

  1. First click the presentation that contains the chart you want to modify
  2. Then click the chart you want to change
  3. In the top toolbar click the "Chart type" dropdown
  4. Finally select your preferred chart type from the list

Create your own interactive guide with Guideflow

Why should you use this feature?

Pitch is an innovative platform that elevates your presentation game by transforming complex data into visually captivating stories.

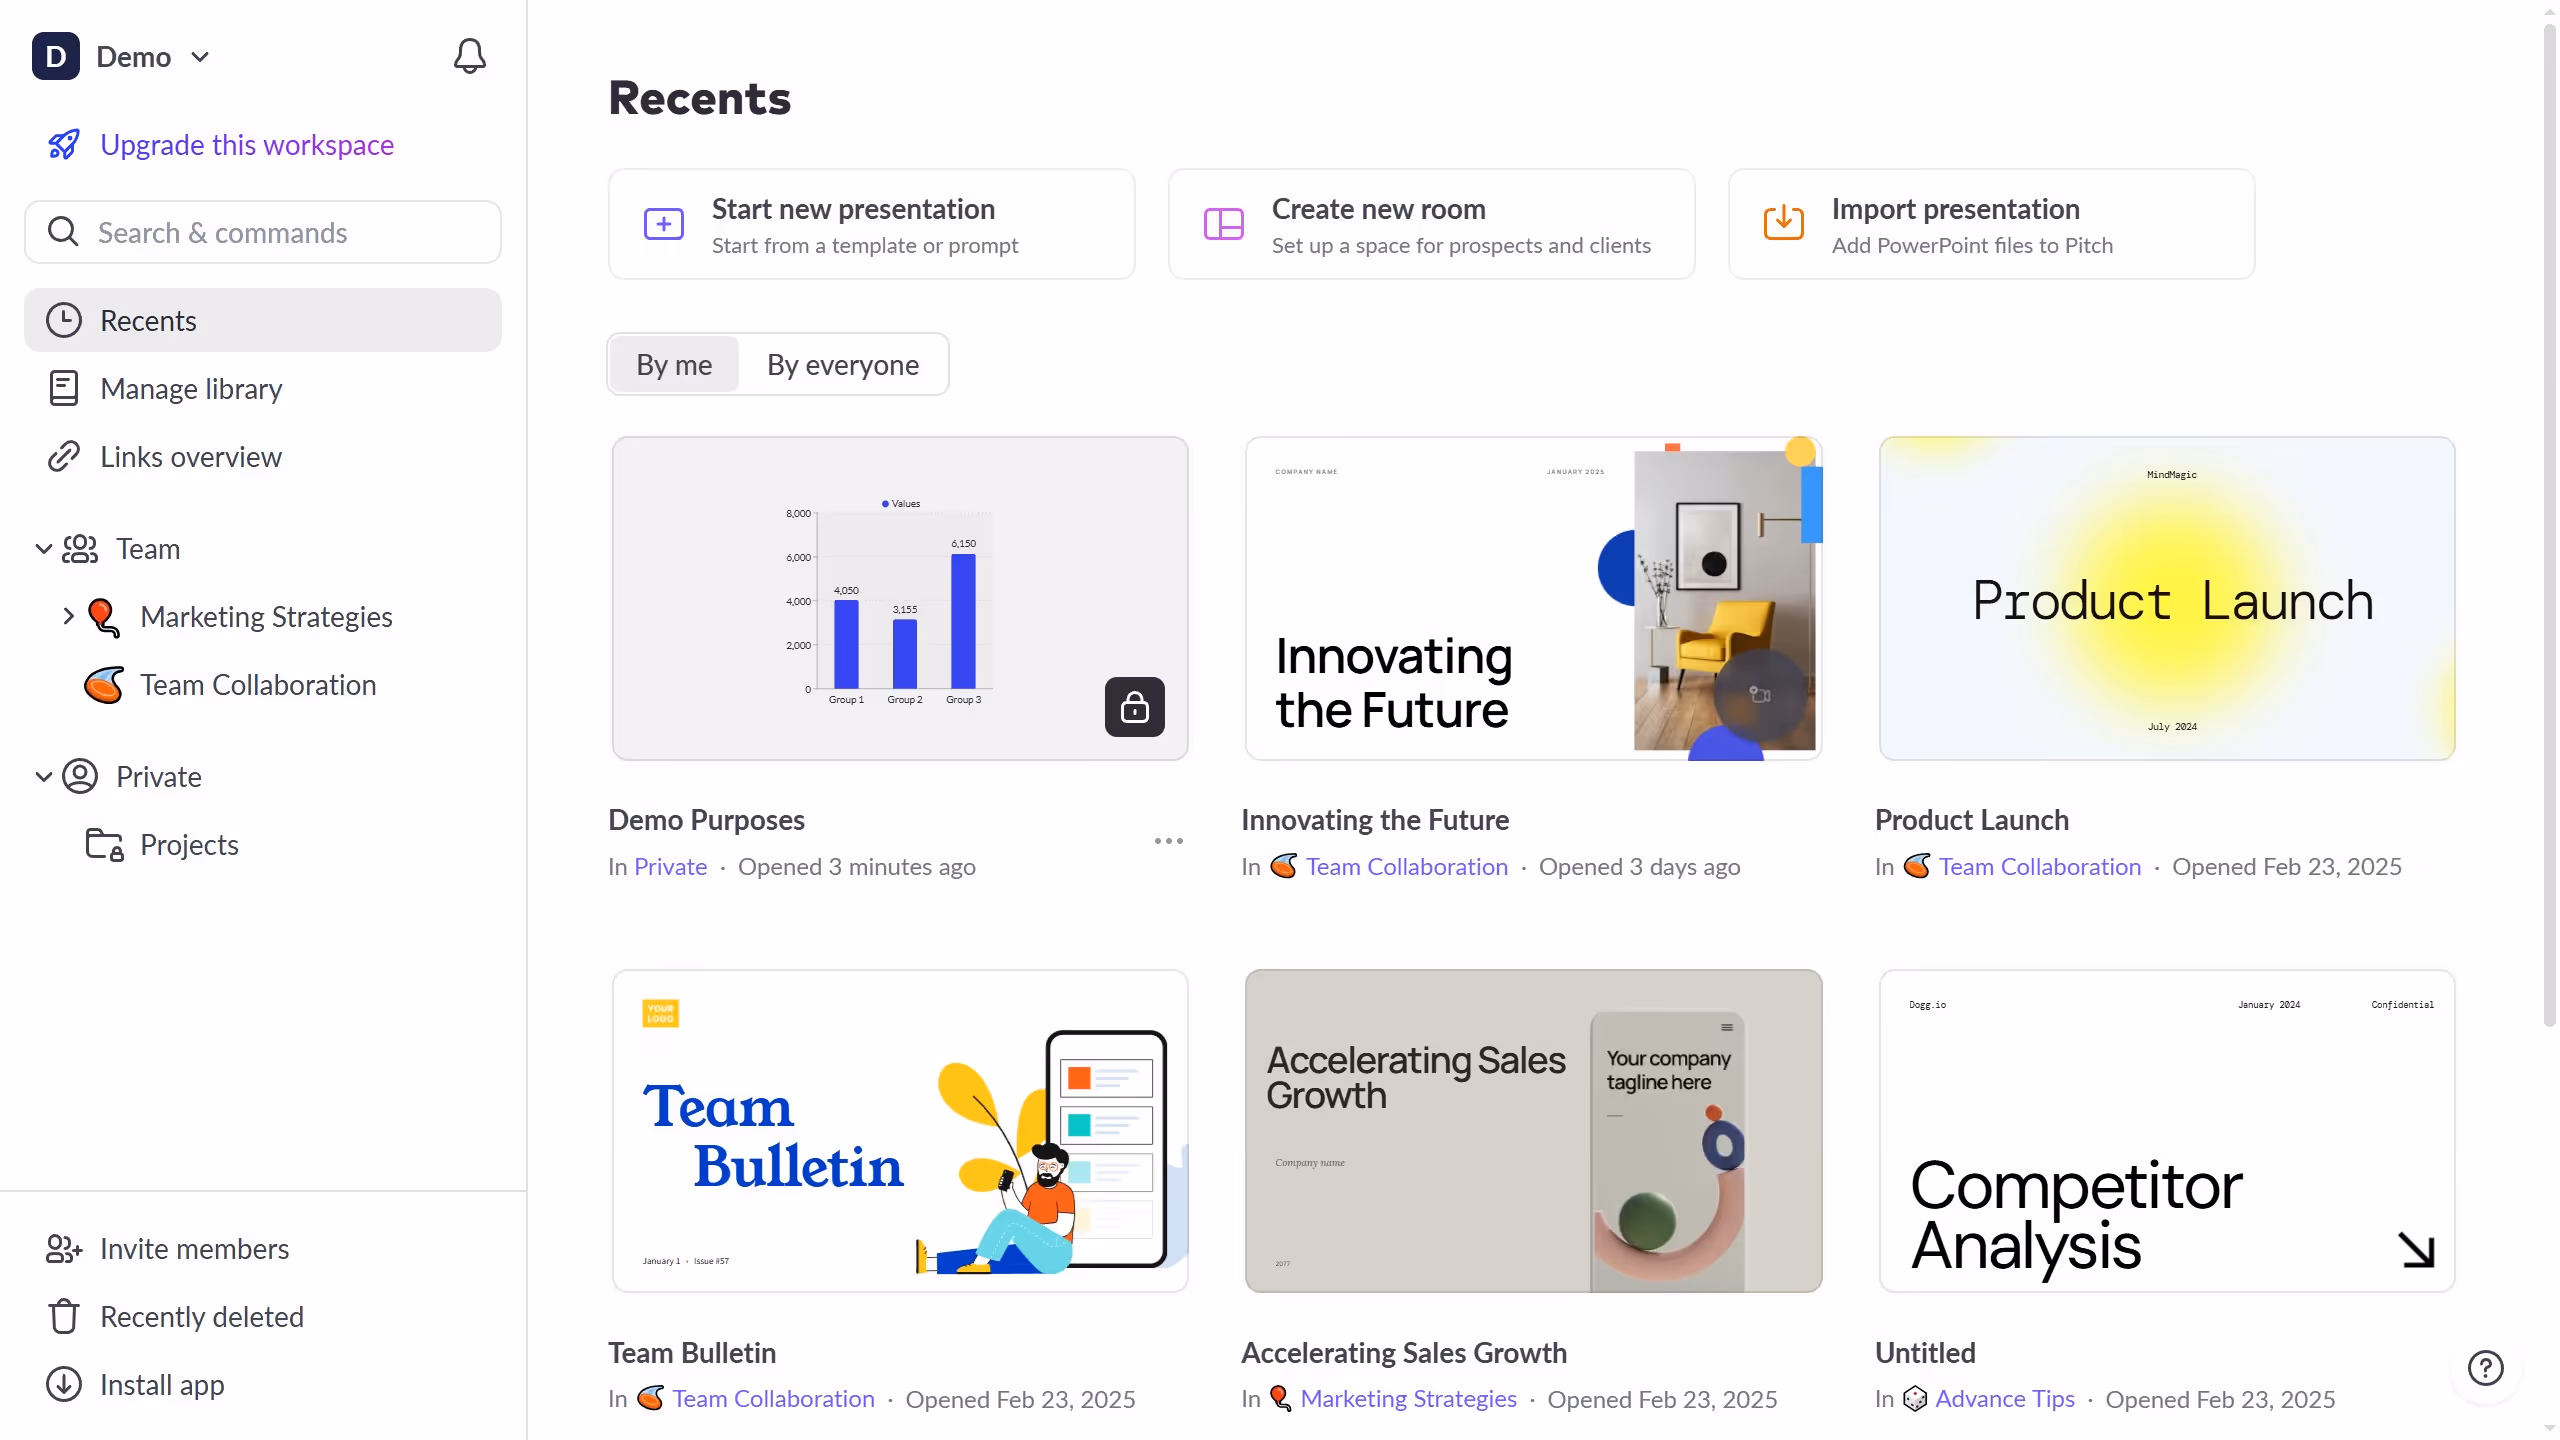
The ability to switch chart types in Pitch allows users to tailor their data presentation, making it more impactful and easier to understand.

This feature is ideal for adapting your visuals to various audiences, ensuring that the data story resonates with viewers. By effortlessly switching chart types, users can enhance comprehension and maintain audience engagement.

Ultimately, this flexibility empowers you to communicate data-driven insights more effectively.

Last update
December 19, 2025
Cursor MariaA cursor points to a button labeled "James."

Create your first demo in less than 30 seconds.