Pitch
Pitch.com is a modern presentation software that combines design, collaboration, and storytelling.
Website
Industry
Collaboration
Share this article:

How to customize axis labels in a chart in Pitch

How it works

  1. First click the presentation that contains the chart you want to update
  2. Then click the chart to open the top toolbar
  3. Click the "Edit data" button
  4. Click the axis label in the categories column and enter the new name
  5. Finally click on the "Done" button in the chart toolbar to complete the edits

Create your own interactive guide with Guideflow

Why should you use this feature?

Pitch is a modern presentation software that transforms ideas into visually captivating presentations.

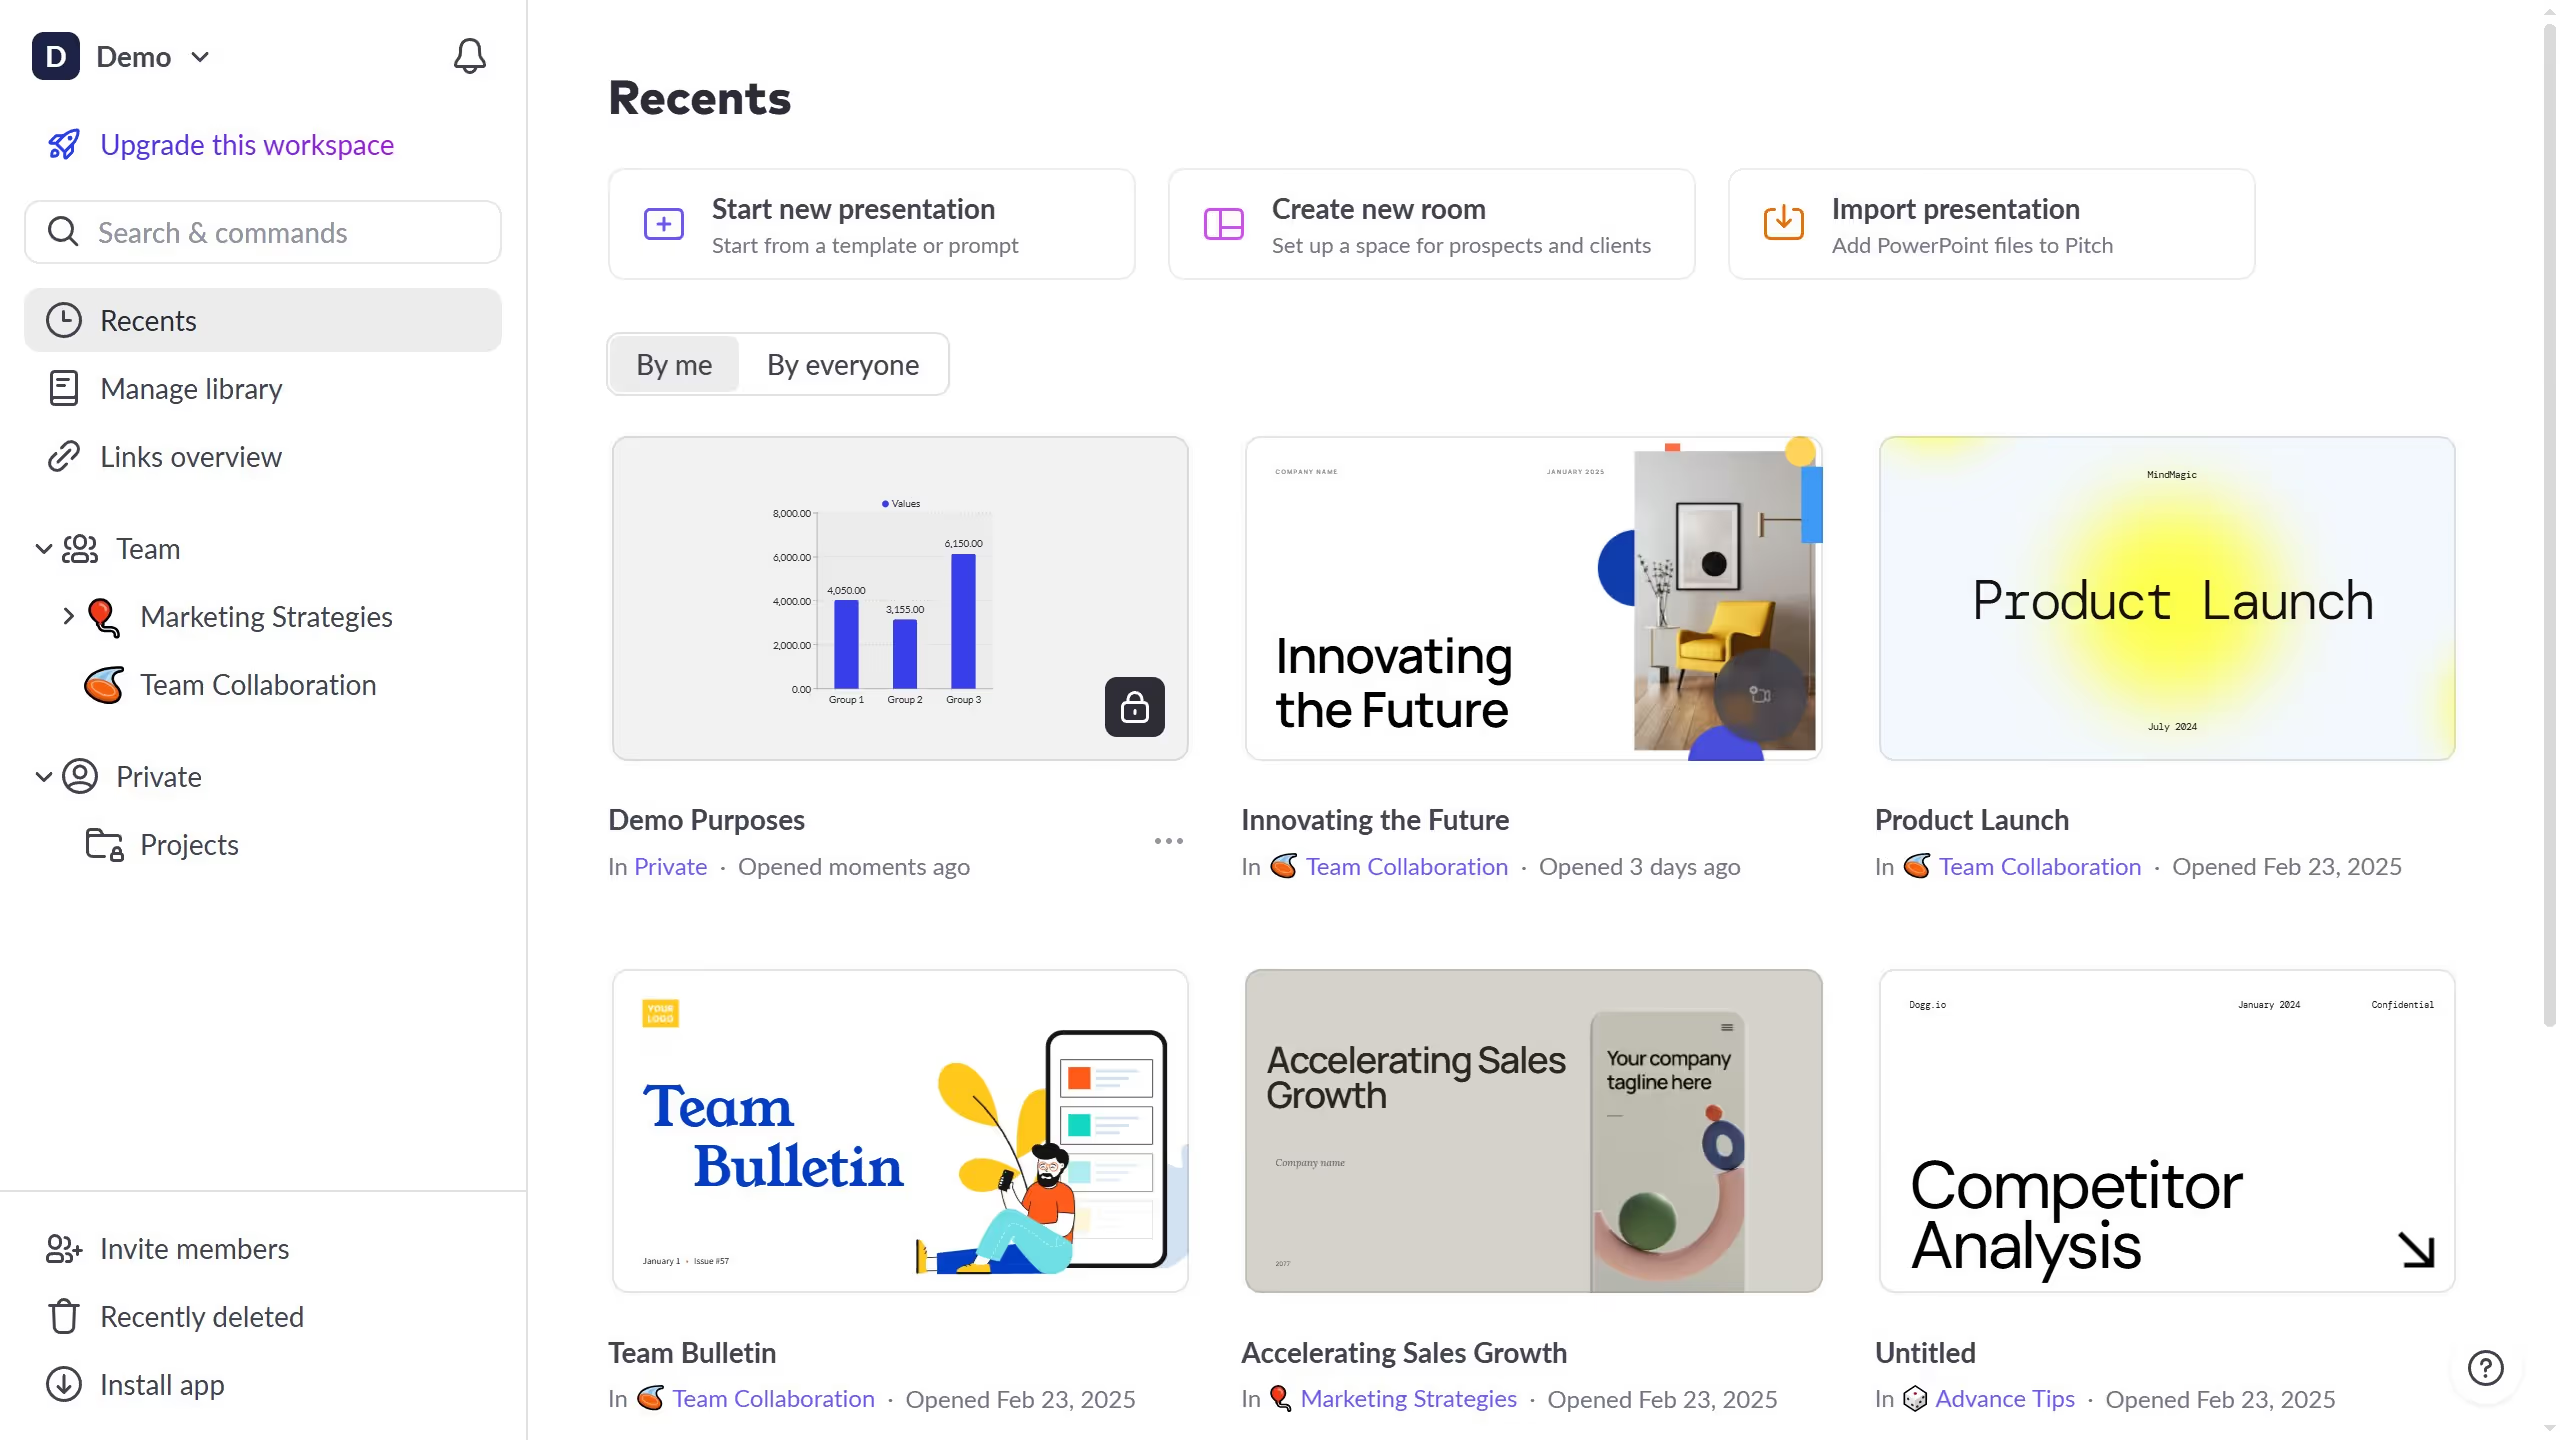
An often underutilized feature in Pitch is the ability to customize axis labels in a chart. This feature allows users to tailor their data visualization, ensuring clarity and relevance tailored to their audience.

By adjusting axis labels, you can make charts more intuitive and accessible, helping to enhance the effectiveness of your presentations. This helps in clear communication of complex data points and trends.

Customizable axis labels offer a personalized touch that aligns perfectly with the message you aim to convey, significantly enhancing your storytelling and data presentation capabilities.

Last update
December 19, 2025
Cursor MariaA cursor points to a button labeled "James."

Create your first demo in less than 30 seconds.