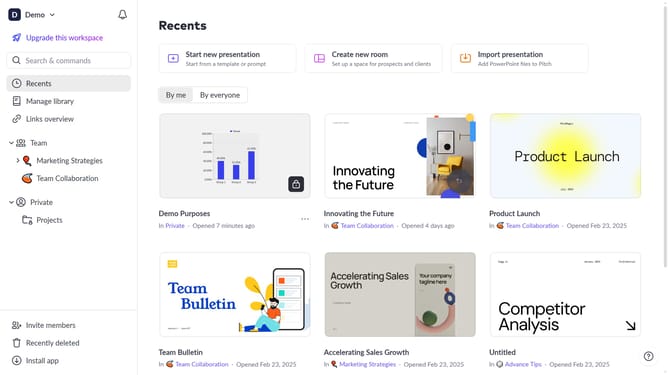
How to create a chart in a presentation on Pitch
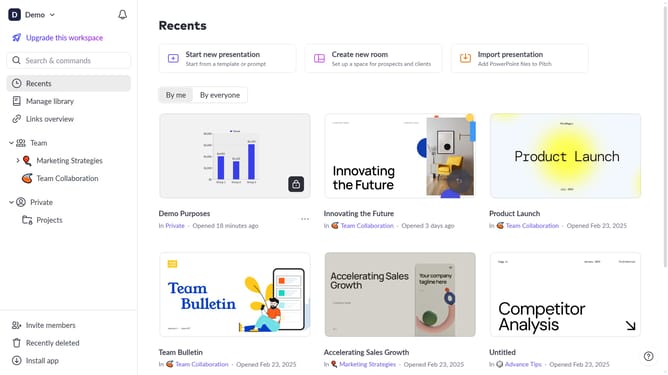
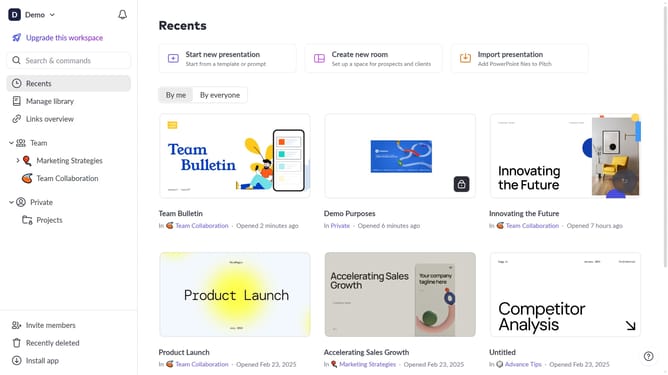
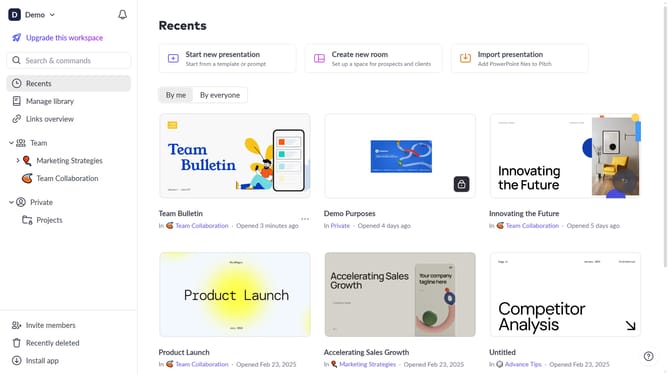
Here is how to create a chart in a presentation on pitch
- First, open the presentation where you want to add a chart
- Select the slide where you want to insert the chart
- Next click on the "Chart" button in the toolbar
- Then, select the type of chart you want to add
- Finally, enter your chart data and customize the chart as needed
Why should you create a chart in a presentation on Pitch
Pitch is a dynamic platform designed to elevate your presentation experience with ease and creativity.
Creating a chart within Pitch allows you to visually communicate data insights effectively, catering to diverse audience needs. This feature ensures clarity in conveying complex information, making presentations more engaging and understandable.
Using this feature, you can captivate audiences and emphasize key points, providing a professional and polished look that enhances your overall message.
The seamless integration of charts enhances storytelling, ensuring your presentations have impact and precision.
Last update