

You shipped the new onboarding flow. Activation dropped. Nobody can say why, because nobody set up a control group before the release went out.
That is the quiet cost of running product on opinion. The loudest stakeholder wins the roadmap fight, the change ships, and six weeks later the retention curve tells a story you cannot untangle. Was it the flow? The pricing test that ran in parallel? Seasonality?
The global product experimentation platforms market was valued at USD 1.2 billion in 2024 and is projected to reach USD 4.8 billion by 2033, a 19.8% CAGR, according to the Global Product Experimentation Platforms Market Outlook (2024). Teams are buying this software because guessing is expensive. A bad launch does not just miss a target. It burns engineering cycles, damages trust, and hides the real signal in noise.
Good product experimentation software turns a launch from a bet into a measured decision. You define a hypothesis, split traffic, watch guardrail metrics, and roll out only what wins. This guide is a buyer's shortlist for product managers choosing that software in 2026.
What's inside
This guide is for product managers, growth PMs, and product ops leaders comparing product experimentation tools before they commit budget.
We picked these seven platforms on four criteria that actually matter for a PM:
- Statistical rigor: control groups, significance, power, and sequential or Bayesian analysis done right
- Workflow fit: whether a PM can design and read experiments without an engineer in the loop
- Stack integration: feature flags, product analytics, session replay, and warehouse sync
- Team adoption: how well it serves PM, engineering, and data teams together
The list spans full experimentation platforms, feature management tools, and analytics-first suites. No single tool wins every category. The right pick depends on your traffic, your rigor needs, and who runs the experiments.
TL;DR
- Best overall for analytics plus experimentation: Amplitude pairs product analytics, session replay, and feature experimentation in one stack, so PMs plan and measure in the same place.
- Best for behavioral-data-first teams: Mixpanel ties experiments directly to funnels, retention, and activation reports teams already live in.
- Best for engineering-led product teams: Statsig combines feature flags, experimentation, and analytics with warehouse-native options and advanced methods.
- Best for enterprise experimentation depth: Optimizely offers a mature, governed testing suite across web and product surfaces.
- Best for CRO-oriented programs: VWO covers A/B, multivariate, and split testing alongside heatmaps and session recordings.
- Best for safe rollouts plus flags: LaunchDarkly leads on feature management, targeting, and progressive delivery with experimentation attached.
- Best for statistical rigor: Eppo runs warehouse-native analysis with sequential, fixed-sample, and Bayesian frameworks.
What is product experimentation software?
Product experimentation software is a platform for running controlled, hypothesis-driven tests on product changes so teams can measure causal impact before rolling a change out to everyone.
The mechanics are consistent across tools. You write a hypothesis ("moving signup to a single screen increases activation"). You split users into a control group and one or more variants. The platform assigns traffic, tracks the metrics you care about, and tells you whether the difference is real or noise. That last part is where statistical significance, power, and sample size come in. Without them, you are looking at random variation and calling it a result.
Modern product experimentation platforms bundle several capabilities that used to live in separate tools:
- Feature flags: turn features on or off per segment, and use the flag as the experiment's assignment mechanism
- Product analytics: measure activation, retention, conversion, and funnel behavior tied to each variant
- Segmentation: target experiments by role, plan, channel, cohort, or use case
- Statistical analysis: run A/B testing, multivariate testing, and split testing with significance, power, and confidence controls
- Rollout controls: ship winners gradually with canary releases, staged rollouts, and kill switches
- Session replay: watch how users in each variant actually behaved, not just what the aggregate numbers say
The distinction worth holding onto: product analytics describes what happened, and an experimentation platform tests why it happened. Analytics tells you activation fell. An experiment tells you the new flow caused it.
When to use product experimentation software
Validate a risky product change
Some changes are hard to reverse and easy to get wrong. A pricing page redesign, a new onboarding path, a change to a core workflow. Rolling those out to 100% of users on a hunch is how you find out about the damage from a churn spike. A controlled test on a slice of traffic lets you see the effect first, confirm it clears your guardrail metrics, and expand only when the data holds. That is launch risk management, not perfectionism.
Improve activation or conversion
This is the bread and butter. You have a signup funnel with a known drop-off, or a trial that converts below target, or a feature nobody adopts. Experimentation lets you test one change at a time against a control group and attribute the lift to the change, not to the calendar. Teams use it to move activation rate, time to first value, and trial-to-paid conversion with evidence instead of debate.
Resolve competing opinions with data
Design wants one flow. Sales wants another. Your head of product has a strong opinion about the CTA copy. Everyone is confident. A hypothesis-driven test ends the meeting. You ship both, measure the outcome that matters, and let the result decide. This is often the highest-leverage use, because it replaces politics with a shared standard for what counts as proof.
Comparison table
Read this table by your primary decision variable. If you want analytics and experimentation together, look at the analytics-first tools. If safe rollout is the priority, weight feature management. If statistical depth is non-negotiable, weight the warehouse-native platforms. Pricing reflects publicly listed entry tiers as of 2026, and G2 ratings reflect current listings.
| # | Product | Best for | Key differentiator | Pricing | G2 rating |
|---|---|---|---|---|---|
| 1 | Amplitude | Product and growth teams wanting analytics, replay, and experimentation together | Full behavioral analytics stack with experimentation built in | Free tier; paid custom | 4.5/5 |
| 2 | Mixpanel | Teams that live in funnels and retention data | Experimentation tied directly to product analytics reports | Free tier; Growth from $0 | 4.5/5 |
| 3 | Statsig | Engineering-led product teams needing scale | Flags, experimentation, and analytics in one, warehouse-native | Free tier; Pro from $150/mo | 4.7/5 |
| 4 | Optimizely | Enterprise teams wanting a mature suite | Governed experimentation across web and product | Custom | 4.2/5 |
| 5 | VWO | CRO and website experimentation programs | A/B, multivariate, and split testing plus heatmaps | Free trial; custom plans | 4.4/5 |
| 6 | LaunchDarkly | Engineering teams needing safe rollouts | Feature management and progressive delivery at scale | Free tier; usage-based | 4.5/5 |
| 7 | Eppo | Teams that prioritize statistical rigor | Warehouse-native analysis with sequential and Bayesian methods | Custom | 4.7/5 |
Best 7 product experimentation tools for 2026
1. Amplitude

Amplitude is an AI analytics platform for product and digital behavior insights, and it folds experimentation into the same environment where you already analyze behavior. For a PM, that matters. You plan a test against the same funnels and retention curves you use to spot the problem, then measure the result without exporting data to a second tool. Product analytics, session replay, and feature experimentation sit under one roof.
Best for: Product and growth teams that want analytics, replay, and experimentation in a single platform.
Key strengths
- Product analytics for activation, retention, and funnel analysis
- Session replay to see behavior behind the numbers
- Feature experimentation tied to behavioral cohorts
- Unlimited seats across every plan tier
Why choose Amplitude: If your team already leans on behavioral analytics to find problems, running the experiment in the same place removes the handoff where context gets lost. It fits PMs who want to go from insight to hypothesis to result without switching tools.
Amplitude pricing: Free plan includes 2M events per month, forever. The Plus plan starts at $0 with the first 2M events per month free. Growth and Enterprise tiers use event-based custom pricing. All plans include the full platform and unlimited seats.
2. Mixpanel

Mixpanel is a product analytics platform built around funnels, retention, and flows, with experimentation and feature flags added on top. Teams that already run their day-to-day in Mixpanel reports get to connect an experiment straight to the activation, retention, and funnel metrics they track. There is no separate mental model for "the analytics tool" and "the testing tool."
Best for: Teams that need self-serve product analytics with experimentation in one platform.
Key strengths
- Insights, funnels, retention, and flows reports
- Mixpanel Agent for AI-assisted analysis
- Built-in experimentation and feature flags
- Self-serve exploration without a data-team ticket
Why choose Mixpanel: The strength here is proximity. When your experiment result lands in the same funnel report you use to measure activation, the analysis loop is short. It suits PMs and growth teams who want to read causal results in the language of the metrics they already report on.
Mixpanel pricing: Free plan is capped at 1M monthly events. Growth starts at $0 with 1M monthly events free, then $0.28 per 1,000 events after. Enterprise is contact sales.
3. Statsig

Statsig is a unified platform for feature flags, experimentation, and product analytics, with warehouse-native and no-ETL options. Engineering-led product teams shortlist it because the flag that ships the feature is the same flag that runs the experiment. That tight coupling between rollout strategy and measurement is what a PM working closely with engineering wants. It scales to high experiment volume without turning each test into a project.
Best for: Teams that want feature flags, experimentation, and product analytics in one platform.
Key strengths
- Feature flags as the experiment assignment layer
- A/B testing and advanced experimentation methods
- Product analytics in the same platform
- Warehouse-native, no-ETL analysis option
Why choose Statsig: It fits teams where engineering owns the rollout and PMs own the hypothesis, and both need one system. The warehouse-native path appeals to data teams that want experiments computed on their own tables.
Statsig pricing: Developer Tier is $0 per month and includes gates, configs, experimentation, and analytics with 2M metered events per month. Pro Tier starts at $150 per month with 5M metered events. Enterprise is custom with volume discounts.
4. Optimizely
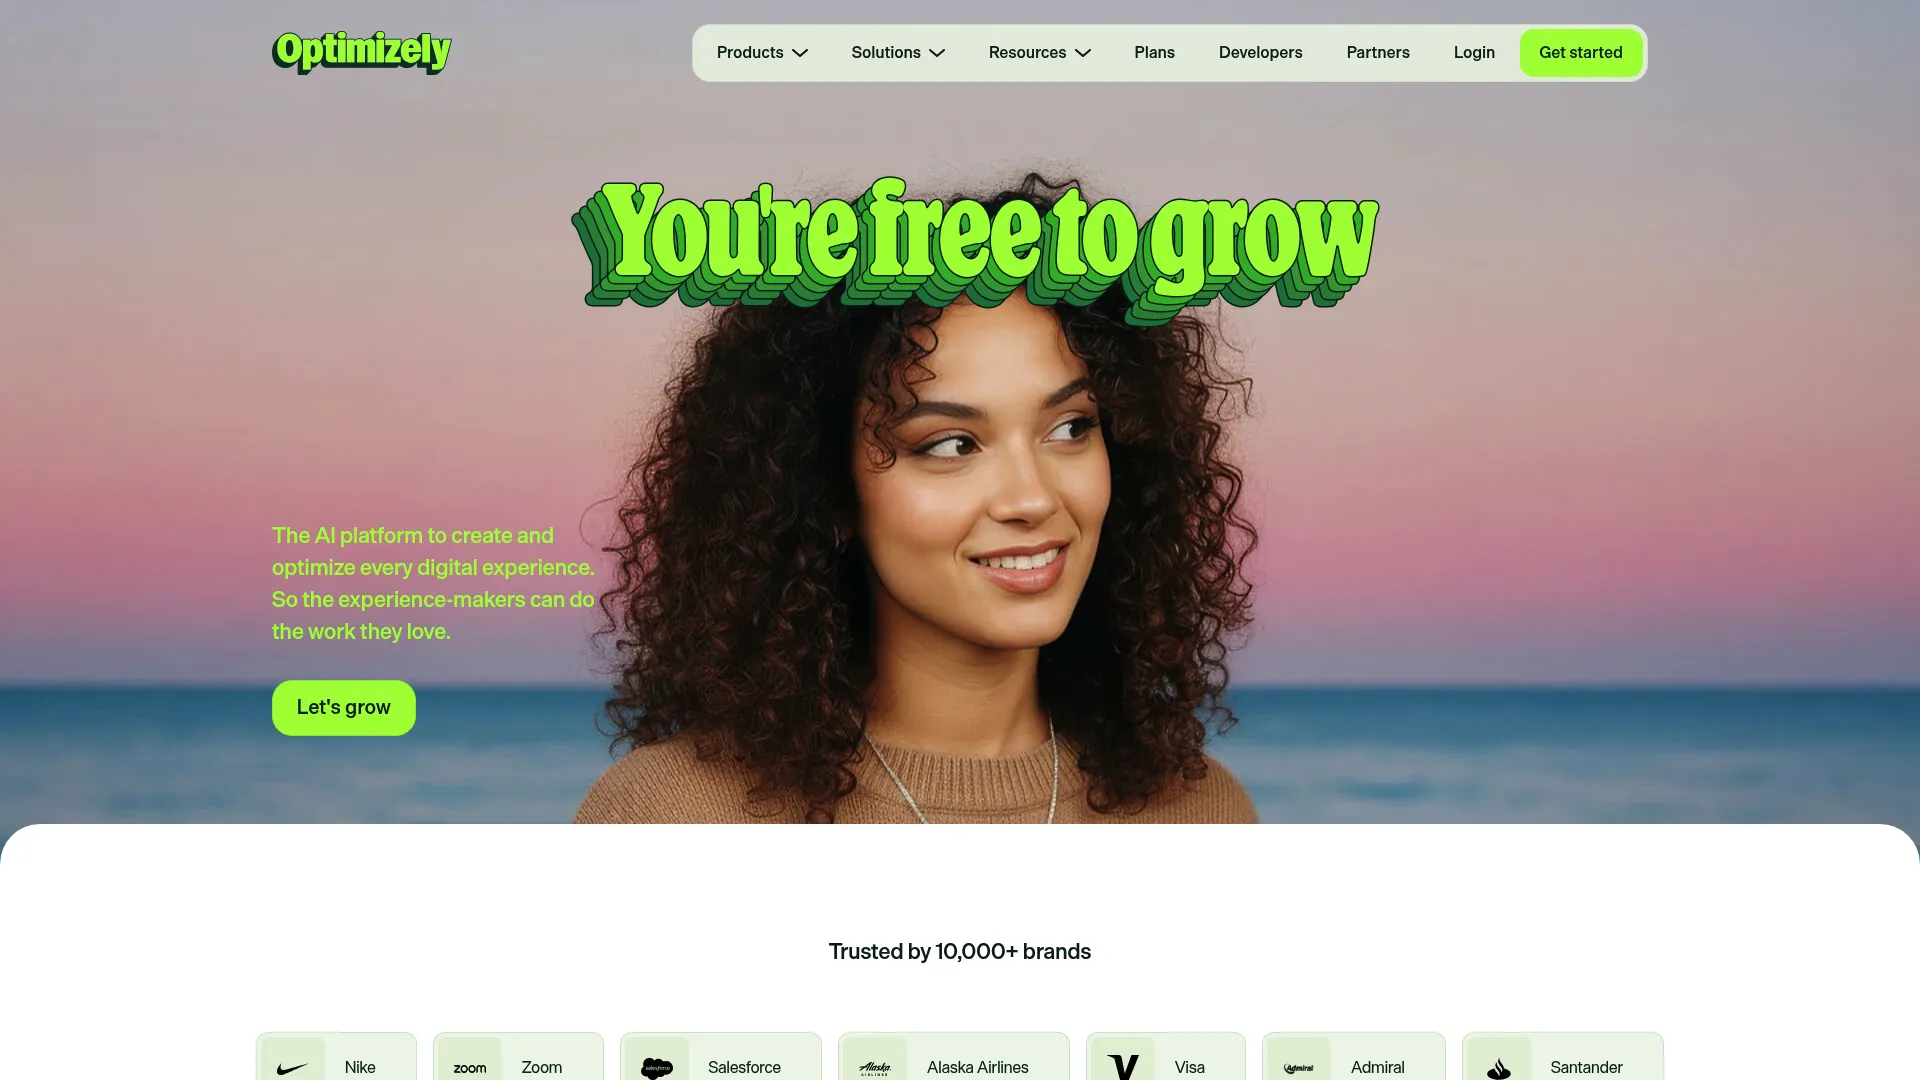
Optimizely is an AI platform for creating and optimizing digital experiences, with a mature experimentation layer spanning A/B, multi-page, feature, and server-side testing. Organizations that need governed, auditable experimentation across both web and product surfaces gravitate here. The suite pairs experimentation with a CMS, personalization, and workflow tooling, which matters when experimentation is a company-wide practice rather than a single team's tool.
Best for: Enterprise teams needing an integrated CMS, experimentation, personalization, and AI workflow platform.
Key strengths
- A/B, multivariate, feature, and server-side testing
- Governance and approval workflows for experiments
- Personalization tied to experiment results
- Coverage across web and product experimentation
Why choose Optimizely: The case for Optimizely is depth and control at scale. Enterprise teams with many stakeholders, compliance needs, and a high experiment cadence get governance that keeps a large program from fragmenting.
Optimizely pricing: Optimizely packages every plan individually and builds pricing after learning your requirements. No public numeric pricing is listed; contact sales for a tailored plan.
5. VWO

VWO is a digital experience optimization platform covering experimentation, personalization, analytics, and feature management. It leans toward conversion rate optimization, so teams testing product pages, signup flows, and site changes find a full toolkit here. Alongside A/B, multivariate, split URL, and bandit testing, it includes heatmaps, session recordings, and form analytics, so you see both the result and the behavior that produced it.
Best for: Teams running website and app experimentation plus feature rollout programs.
Key strengths
- A/B, multivariate, split URL, and bandit testing
- Feature flags, rollouts, and runtime control
- Heatmaps, session recordings, and form analytics
- Personalization across segments
Why choose VWO: If a large share of your experiments target conversion on pages and flows, VWO's CRO tooling and behavioral recordings put testing and diagnosis in one place. It suits growth and product teams optimizing the funnel end to end.
VWO pricing: VWO offers Growth, Pro, and Enterprise plans plus a 30-day full-featured free trial. Public plan pricing is not listed on the pricing page; request a quote for exact figures.
6. LaunchDarkly
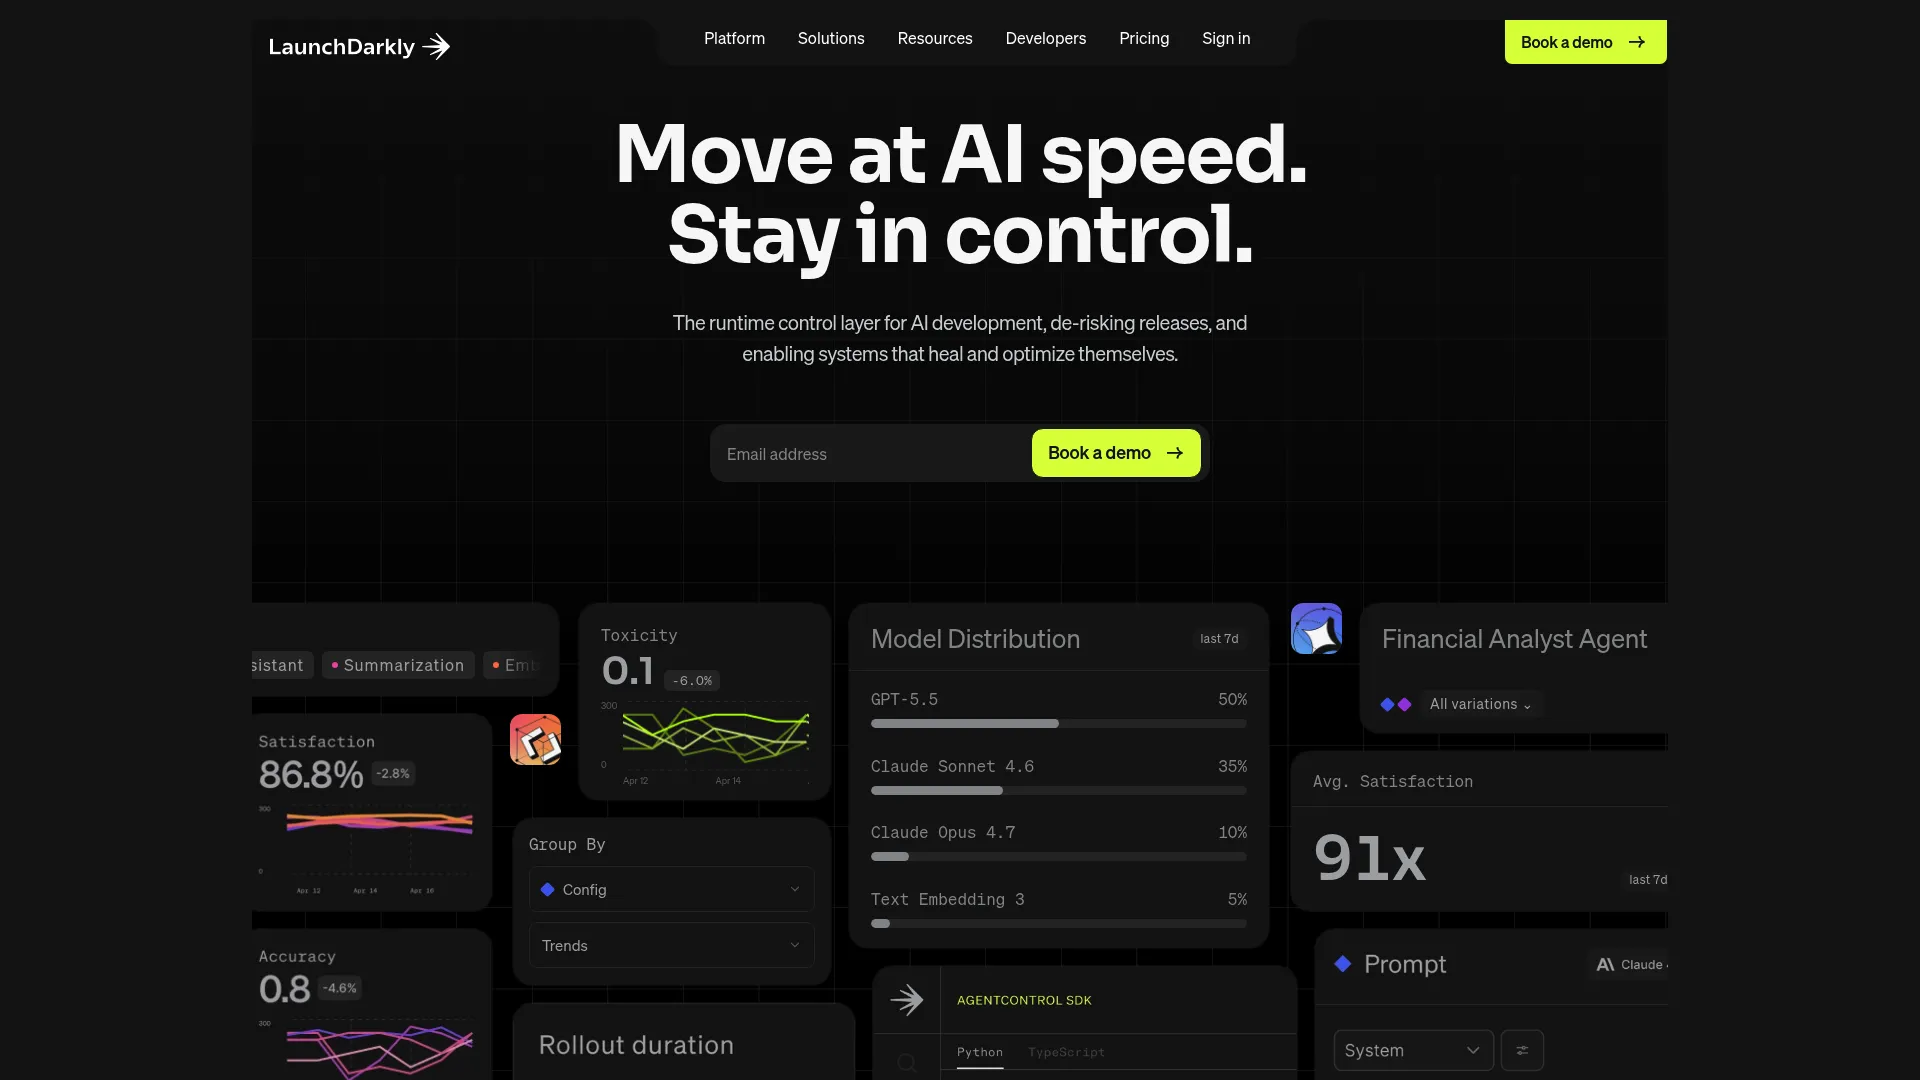
LaunchDarkly is a feature management platform for controlling feature releases, experimentation, and AI behavior in production. PMs and engineering teams use it to ship safely first and test progressively second. You wrap a feature in a flag, roll it out to a small segment with a canary release, watch the guardrail metrics, and expand or kill the flag based on what you see. Experimentation sits on top of that release-control foundation.
Best for: Engineering teams needing feature flags, release control, and experimentation at scale.
Key strengths
- Feature flags with real-time updates
- Targeting rules by segment, plan, or cohort
- A/B testing and experimentation on flags
- Audit logs and flag organization tools
Why choose LaunchDarkly: The strength is operational safety. If your first concern is shipping without breaking production, and experimentation is the layer you add once rollout is controlled, LaunchDarkly is built for that order of operations.
LaunchDarkly pricing: Developer is free to start. Foundation is usage-based at $10 per service connection per month, $8.33 per 1,000 client-side MAU per month, and $5 per 1,000 AI runs past 5,000, billed yearly. Enterprise is custom.
7. Eppo
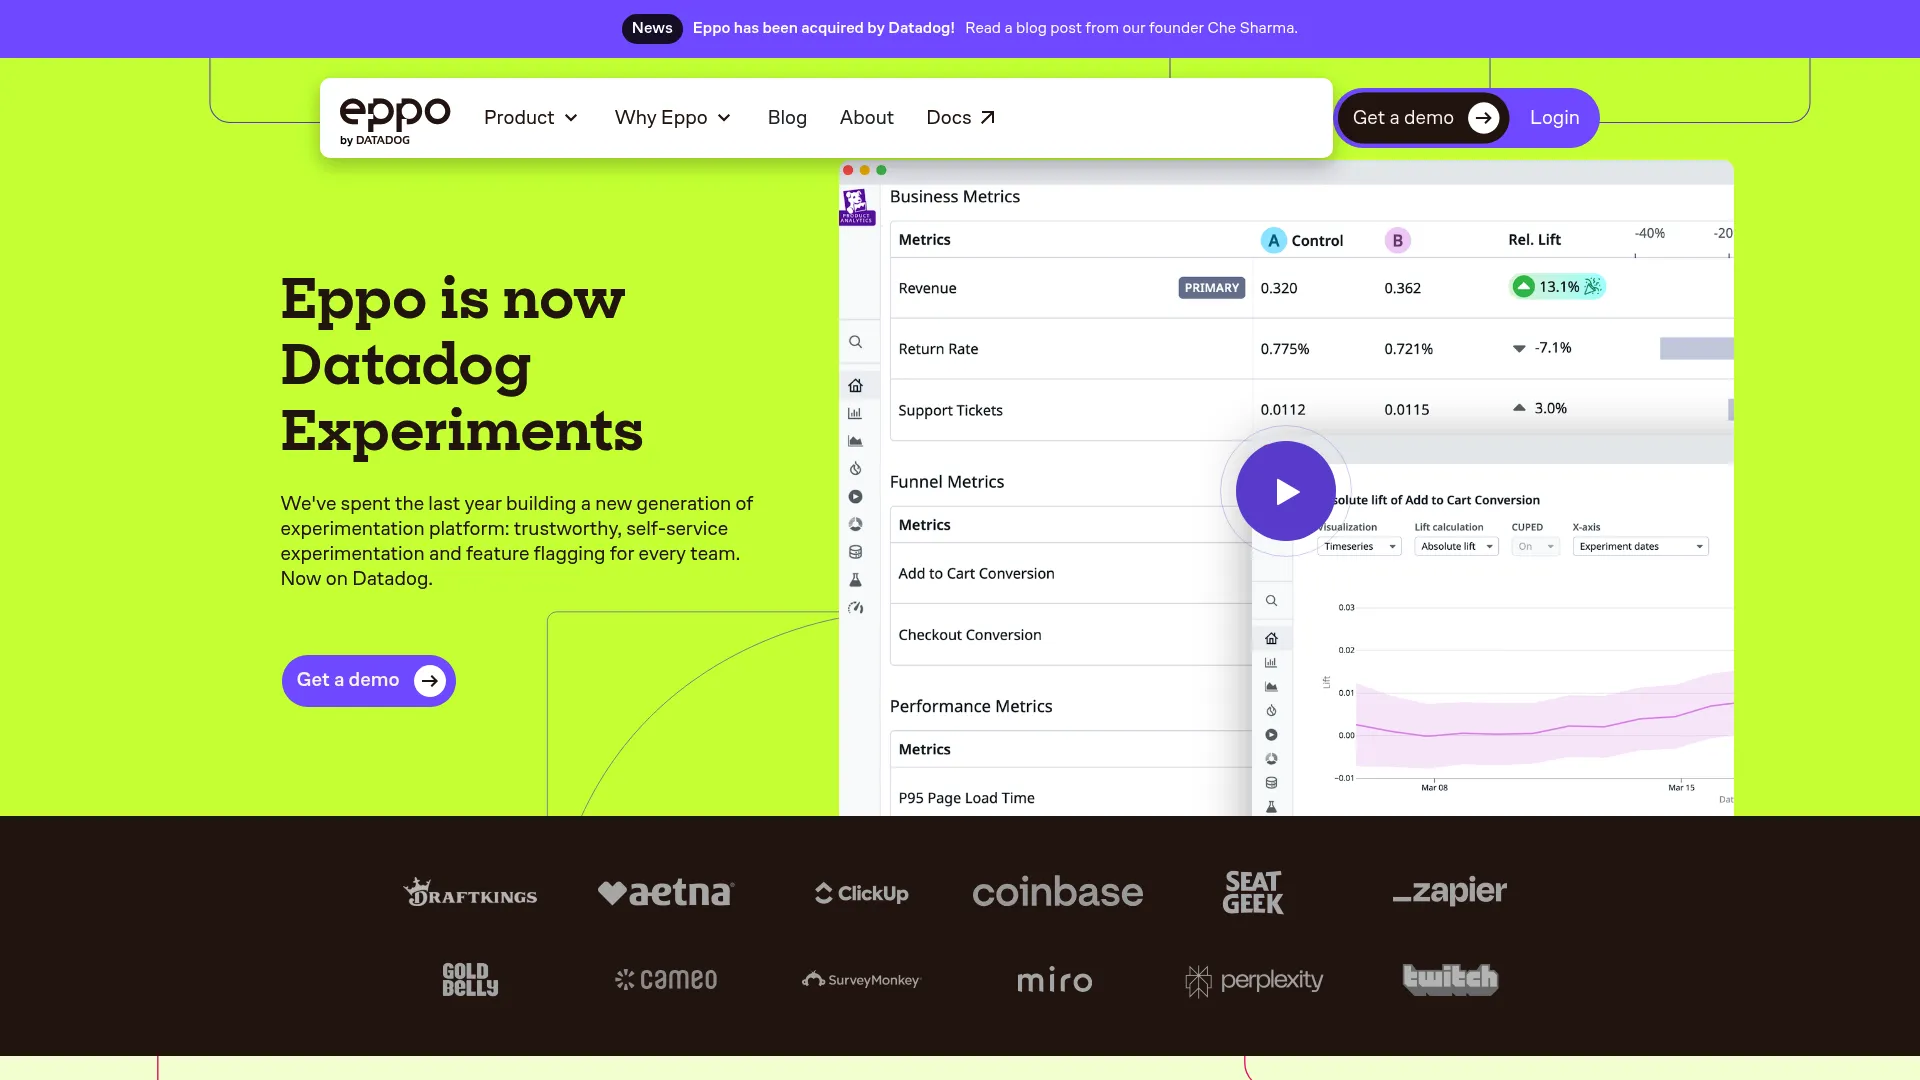
Eppo is a warehouse-native experimentation and feature flagging platform for teams that treat the statistics as a first-class concern. Analysis runs on your own data warehouse, so experiment results are computed on the same tables your data team trusts. It supports sequential testing, fixed-sample, and Bayesian testing, plus CUPED++ variance reduction, which lets you reach a confident decision on less traffic.
Best for: Teams that want warehouse-native experimentation with feature flags and rigorous statistical analysis.
Key strengths
- Warehouse-native experiment analysis, no ETL
- Feature flagging for tests, rollouts, and kill switches
- Sequential, fixed-sample, and Bayesian frameworks
- CUPED++ variance reduction and AI model evaluation
Why choose Eppo: Eppo fits data-mature teams where a data scientist or analyst owns experiment methodology. If your organization already runs on a warehouse and wants results it can audit line by line, the warehouse-native model removes the "trust the vendor's math" problem.
Eppo pricing: Eppo does not publish pricing on its site. Contact the vendor for a quote based on your usage and requirements.
Considerations
Statistical rigor
The number that matters is whether a result is real. Check how each tool handles significance, statistical power, and sample size, and whether it defaults to a control group you can trust. Some platforms lean frequentist, some Bayesian, and some offer sequential testing so you can peek at results without inflating false positives. Before you buy, ask how the tool prevents you from calling a random fluctuation a win. That is the whole job.
Data and integrations
Your experiments are only as good as your event data. Evaluate how the platform ingests events, whether it syncs with your data warehouse, and how it fits your existing product analytics. If a tool computes results on your warehouse tables, your data team can verify them. Check feature flag compatibility too, since flags often serve as the assignment mechanism. A tool that fights your stack will sit unused.
Team workflow
Experimentation lives or dies on adoption. A platform an engineer loves but a PM cannot read will not spread. Look at whether PMs can design and interpret experiments self-serve, whether data teams get the depth they need, and whether engineering can wire it in without a quarter of work. For larger programs, approvals, governance, and collaboration keep dozens of concurrent tests from colliding.
Scale and maintenance
Match the tool to your reality. A team running 3 experiments a quarter has different needs than one running 30 a week. Consider experiment volume, your release cadence, and how much maintenance each test carries. Event-based pricing scales with usage, so model your volume before committing. The goal is a system that supports more experiments over time, not one that gets harder to run as you grow.
Conclusion
There is no single best product experimentation software, only the best fit for your traffic, your rigor needs, and who runs the tests.
If you want analytics and experimentation in one place, Amplitude and Mixpanel put testing next to the behavioral data you already read. If engineering owns rollout and you need scale, Statsig ties flags to experiments cleanly. For a governed enterprise program, Optimizely brings depth and control. VWO covers CRO and website testing end to end. LaunchDarkly leads when safe, progressive rollout comes first. And Eppo is the pick when statistical rigor and warehouse-native analysis are non-negotiable.
Your next step is simple. Pick the two or three that match your stack, then run one real experiment through each against a hypothesis you actually care about. The tool that lets your PM design it, your data team trust it, and your engineers ship it without friction is the one to buy.
For teams also rethinking how they show product value, tools like Guideflow sit in a different category, turning product experiences into interactive demos, sandboxes, and demo centers rather than running controlled tests.
FAQs
A/B testing is one type of experiment: you compare two variants and measure which performs better. Product experimentation is the broader operating practice around it. It includes A/B testing, multivariate testing, and split testing, plus the hypotheses, control groups, guardrail metrics, rollout strategy, and decision process that turn a single test into a repeatable way of running product.
Not strictly, but flags make experimentation safer and easier to manage. A feature flag is often the mechanism that assigns users to a control group or variant, and it doubles as the switch for a canary release or an instant rollback. Most modern experimentation platforms include feature management for exactly this reason: it links the rollout strategy to the measurement in one place.
Track a primary metric tied to the hypothesis, usually activation, retention, or conversion, and pair it with guardrail metrics that catch harm. If you are testing a signup change, activation is the primary metric, while churn, latency, or support tickets act as guardrails. The point of guardrail metrics is to stop a "win" on one number that quietly damages another.
It depends on your baseline conversion, the effect size you want to detect, and your desired confidence. Small effects on low-traffic surfaces need large samples to reach statistical significance. Most platforms include a sample size or power calculator; use it before you launch. If the math says you need more traffic than you have, sequential testing or variance-reduction methods can help you decide sooner.
PMs tend to get the most from analytics-friendly platforms with self-serve workflows. Amplitude and Mixpanel let a PM design and read an experiment inside the same reports they use for activation and retention, without waiting on a data-team ticket. If your team leans engineering, Statsig couples flags and experiments cleanly while still surfacing analytics a PM can act on.
Skip the experiment when a change is irreversible, when traffic is too low to reach significance, when compliance or legal constraints rule out splitting users, or when the decision is strategic rather than measurable. Some calls are about direction, not conversion lift. Running a control group on a foundational bet you have already committed to just delays the work without adding signal.
Product analytics describes behavior: it tells you what users did, where they dropped off, and how cohorts retain. Experimentation software tests causality: it tells you whether a specific change caused the difference. Analytics might show activation fell after a release. An experiment with a control group tells you the release caused it, which is the difference between a clue and a decision.