

Your Stories are getting views. What you cannot tell leadership is what those views actually did for the business.
Screenshots disappear. Native data expires. Someone asks in the weekly meeting why Story engagement is down, and the best answer you have is "I'll check the app." That gap between views and business outcomes is where most Story reporting breaks down.
Instagram now reaches 3 billion monthly active users, according to Reuters (2025), and Stories remain one of the platform's highest-reach formats. But the reporting tools that come with the app were designed for creators checking vanity metrics, not for growth teams running attribution-driven campaigns and reporting to revenue-focused leadership.
The global social media analytics market hit $13.0 billion in 2026 according to Grand View Research, and tools in this space have matured significantly. The question is which one actually closes the gap between ig story analytics and actionable pipeline data.
This guide helps you choose.
What's inside
This guide compares native Instagram reporting and 12 third-party Instagram Story analytics platforms for 2026.
- Who it's for: Growth marketers, social media managers, and digital marketing teams who need reporting beyond in-app screenshots
- How tools were chosen: Story reporting depth, historical data retention, team and client reporting features, pricing clarity, and G2 ratings
- Selection criteria used: Native versus third-party coverage, attribution and UTM support, agency suitability, and enterprise governance
- What you'll learn: Which metrics matter, what each tool covers, and how to pick one that connects Story performance to revenue
TL;DR
- Best free starting point: Instagram Insights gives small teams native Story metrics without adding another tool to the stack
- Best for multi-channel teams: Hootsuite or Sprout Social combine Story reporting with scheduling and cross-network dashboards
- Best for deeper Instagram analytics: Iconosquare or Socialinsider for benchmarking, historical data, and stakeholder exports
- Best for agencies: Metricool or SocialPilot for multi-account reporting at competitive price points
- Best for enterprise social teams: Emplifi for governance, care workflows, and analytics at scale; Dash Hudson for visual brand performance
- Best for visual content planning plus analytics: Later or Buffer for teams where content calendar workflow matters as much as the data
What is Instagram Story analytics?
Instagram Story analytics is the measurement of how people view, navigate, and interact with Instagram Stories, covering reach, impressions, replies, sticker taps, link clicks, exits, and completion behavior.
Understanding these metrics requires separating them into three distinct groups.
Discovery metrics
- Reach: The number of unique accounts that saw your Story
- Impressions: Total views, including repeat views from the same account
- Profile visits: Accounts that tapped through to your profile from the Story
- Follows: New followers attributed to Story exposure
Reach and impressions are frequently confused. A Story with 1,000 impressions and 800 reach means roughly 200 views came from accounts that watched more than once.
Navigation metrics
Navigation actions describe how people move through your Story sequence.
- Taps forward: Viewer skipped to the next frame in your sequence
- Taps back: Viewer rewatched the previous frame
- Next Story: Viewer swiped to a different account's Stories entirely
- Exits: Viewer left Stories from that frame
Final-frame exits are normal. When exits spike mid-sequence, the content lost relevance before finishing its job.
Interaction metrics
- Replies: Direct messages sent from the Story frame
- Shares: Reposts to other accounts or DMs
- Sticker taps: Interactions with link, location, hashtag, mention, poll, quiz, or question stickers
- Link clicks: Taps on the link sticker
- Product sticker taps: Taps on shoppable product tags
| Metric | What it means | What to do next |
|---|---|---|
| High taps forward | Viewers skipped the frame | Tighten copy or visual pacing |
| High taps back | Viewers rewatched the frame | Study that frame for content cues |
| High exits mid-sequence | Story lost relevance | Rework hook or sequence order |
| High link taps | Clear intent to click | Track with UTM parameters |
When to use Instagram Story analytics tools
Diagnose drop-offs across a Story sequence
Frame-level retention data tells you exactly where people stopped paying attention. Four patterns show up consistently: A gentle decline across all frames (normal), a cliff at a specific frame (fixable), an early drop in the first two frames (broken hook), and a late taps-back spike on a specific frame (strong content signal worth repeating). Native Insights shows exits per frame, but third-party tools help you track these patterns over time and compare them across campaigns.
Connect Story engagement to traffic and sales
A high link sticker click rate is only useful if you know what happened next. Apply UTM parameters to every link sticker, route that traffic to a trackable destination, and connect Story data to sessions, signups, or purchases in your attribution stack. This is how digital marketers prove Story ROI to a CFO, not view counts.
Preserve historical Story performance
Instagram native data has limited retention windows. If you are running quarterly reviews, benchmarking seasonal content, or tracking year-over-year Story performance, native Insights will not give you enough history. Third-party tools capture and store that data continuously, so trend analysis becomes possible.
Instagram Story analytics comparison
The table below reflects pricing and ratings verified from each vendor's live pricing page and G2 listing. Instagram Insights and Meta Business Suite are native Meta tools with no paid tier.
| # | Product | Best for | Key differentiator | Pricing | G2 rating |
|---|---|---|---|---|---|
| 1 | Instagram Insights | Free native Story metrics | Built into Instagram professional accounts | Free | N/A |
| 2 | Meta Business Suite | Cross-Meta organic reporting | Combined Facebook and Instagram reporting | Free | N/A |
| 3 | Hootsuite | Multi-channel social teams | Story reporting with scheduling and dashboards | From $99/user/month | 4.3/5 |
| 4 | Sprout Social | Revenue-aware reporting | Cross-network analytics and team workflows | From $79/seat/month | 4.4/5 |
| 5 | Later | Visual planning plus analytics | Instagram-first publishing with built-in analytics | From $18.75/month | 4.5/5 |
| 6 | Buffer | Lean teams and startups | Simple scheduling with accessible analytics | Free tier; from $5/month/channel | 4.3/5 |
| 7 | Iconosquare | Deep Instagram analytics | Benchmarking, historical reporting, custom dashboards | From €9/month | 4.4/5 |
| 8 | Metricool | Agencies and budget teams | Cross-channel reports with competitive pricing | Free tier; from $20/month | 4.4/5 |
| 9 | Socialinsider | Competitive benchmarking | Competitor analytics and historical social data | From $82/month | 4.7/5 |
| 10 | Emplifi | Enterprise social teams | Advanced social care, governance, and analytics | From $1,249/month | 4.4/5 |
| 11 | Dash Hudson | Visual brands and commerce | AI-powered creative performance insights | Custom pricing | 4.7/5 |
| 12 | SocialPilot | Agencies and multi-account teams | Bulk scheduling with client reporting | From $21/month | 4.5/5 |
Best 12 Instagram Story analytics tools for 2026
1. Instagram Insights
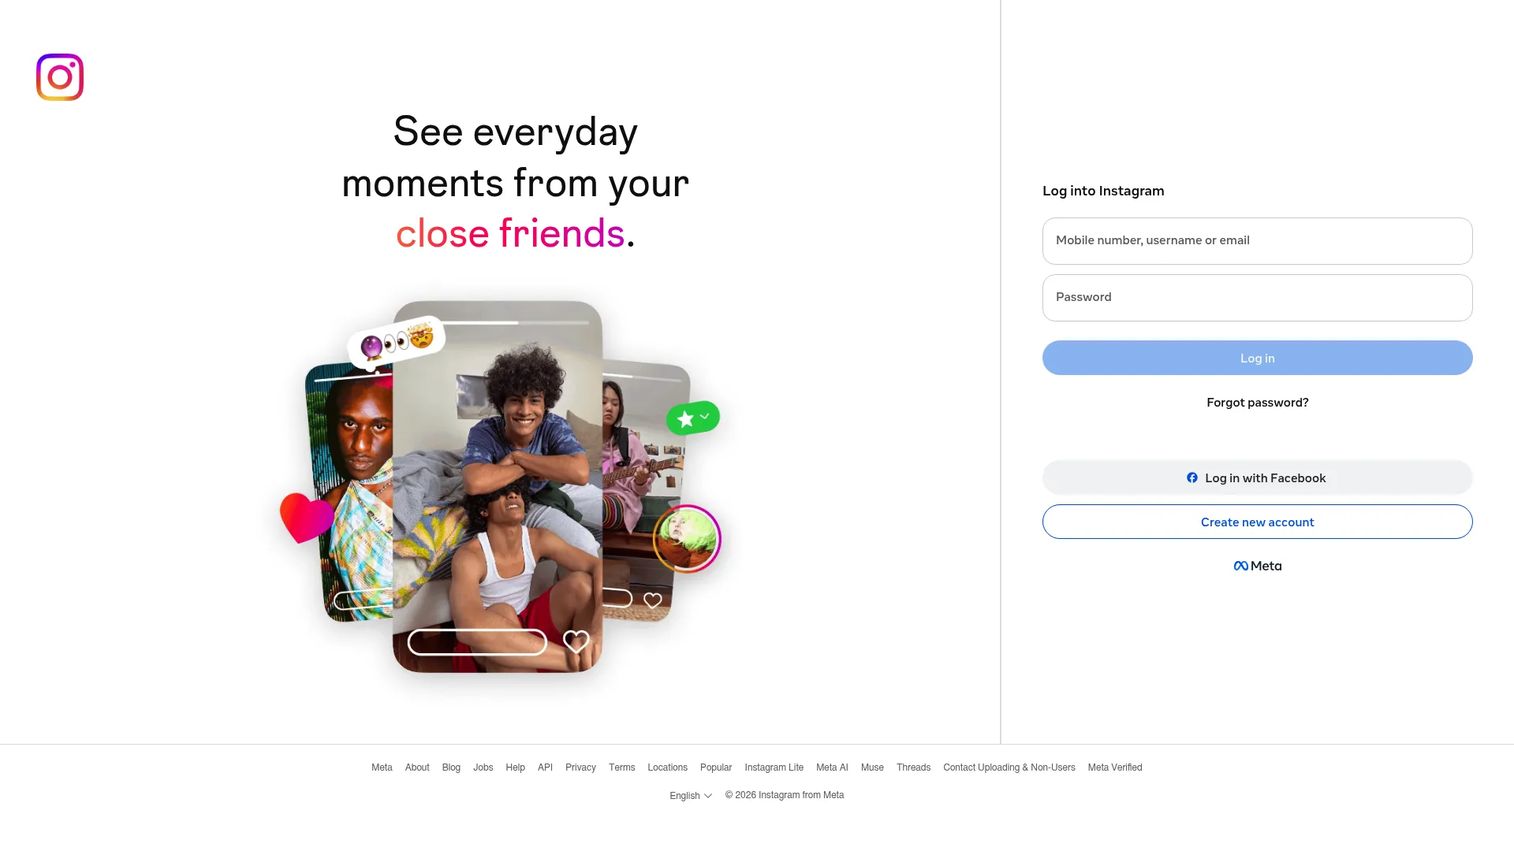
Instagram Insights is Meta's native analytics capability for professional accounts. You access it directly from the app by tapping your profile picture, opening the professional dashboard, or swiping up on an active Story to see performance as it happens. For archived Stories, Insights are accessible through the archive view in settings.
Best for: Solo creators, small businesses, and any marketer who wants first-party Story data without paying for another platform.
Key features
- Native reach and impressions per Story frame
- Navigation metrics: Taps forward, taps back, exits, next Story
- Sticker interactions and link tap counts
- Profile visits and follows attributed to Stories
- Access from active Stories, archive, and professional dashboard
Why choose Instagram Insights: Every marketer should start here. The data is first-party, free, and covers the core metrics you need before deciding whether a paid tool adds enough to justify the cost.
Instagram Insights pricing: Free with an Instagram professional account (business or creator). No paid tier exists for Insights itself.
2. Meta Business Suite
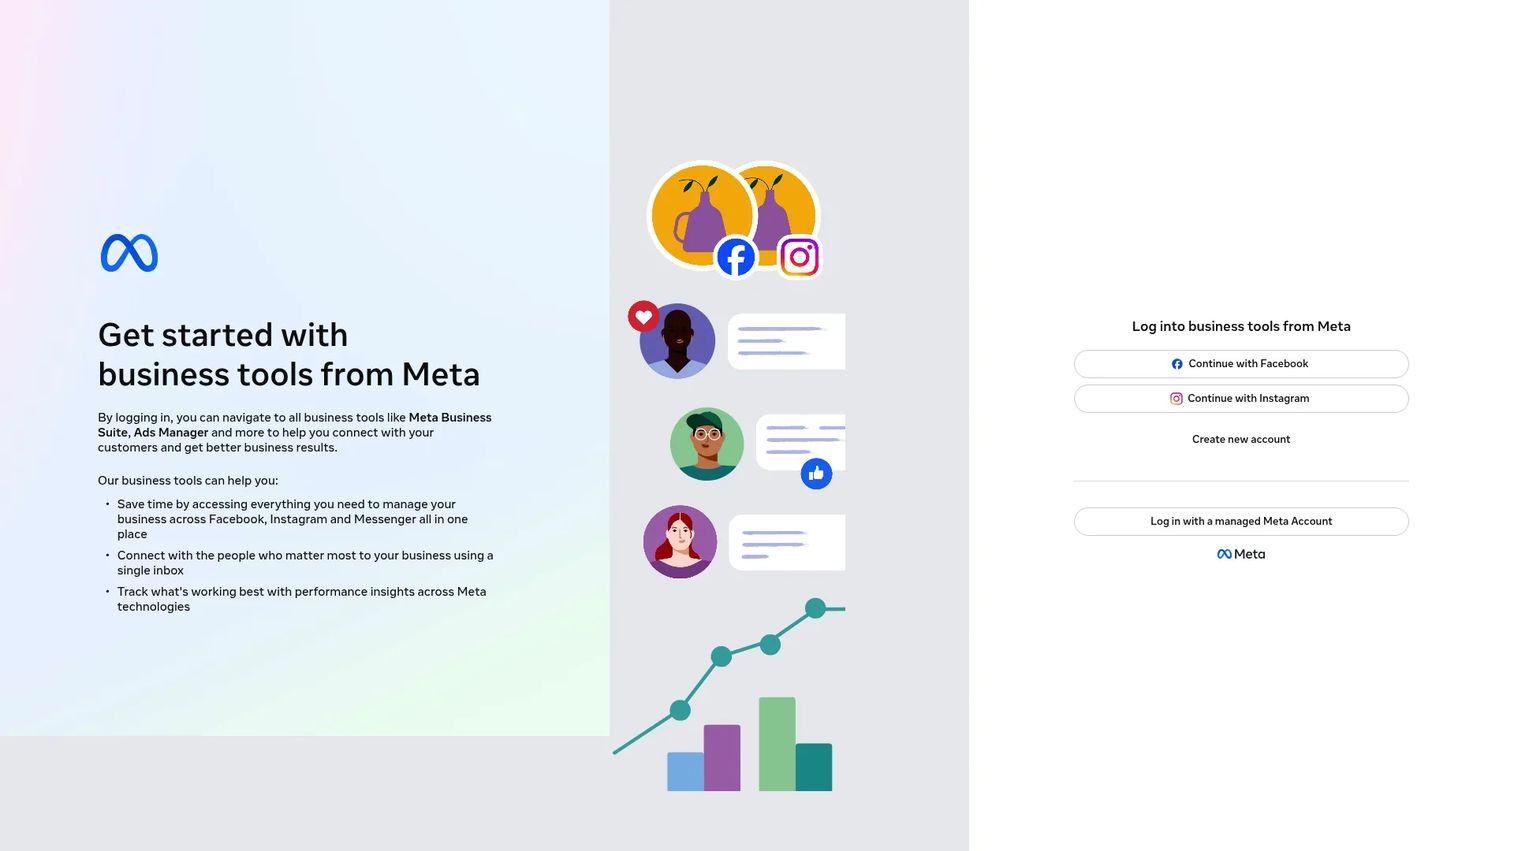
Meta Business Suite consolidates Facebook and Instagram management into a single desktop and mobile interface. When you need to compare Story performance on Instagram alongside Facebook post reach, this is the tool that keeps both in one view without switching platforms.
Best for: Small teams managing both Facebook and Instagram who want organic cross-Meta reporting without a paid analytics subscription.
Key features
- Cross-Meta content performance views
- Audience insights across Facebook and Instagram
- Unified inbox for messages and comments
- Basic post and Story scheduling
- Performance summaries for posts and Stories
Why choose Meta Business Suite: It is a practical step up from checking each platform's native app separately. The consolidated view helps teams report on both channels with less manual work, without paying for a third-party tool.
Meta Business Suite pricing: Free. Access requires a Facebook Page connected to an Instagram professional account.
3. Hootsuite
Hootsuite is a social media management platform combining publishing, engagement, listening, and analytics across multiple networks. For teams running Instagram alongside LinkedIn, X, Facebook, and other channels, Hootsuite keeps Story reporting in the same dashboard as the rest of the content calendar.
Best for: Marketing teams that want Instagram Story analytics inside a multi-channel management platform, particularly when scheduling and approvals are part of the same workflow.
Key features
- Multi-network analytics dashboards
- Instagram Story performance reporting
- Scheduled publishing and content calendar
- Team workflows and approval routing
- Custom report builder and exports
Why choose Hootsuite: The consolidation argument is real for teams already paying for a scheduling tool. If Story analytics, publishing, and monitoring are currently split across separate platforms, Hootsuite can replace two or three of them.
Hootsuite pricing: Plans start at $99 per user per month (billed annually). No free tier; a 14-day trial is available. The Standard plan supports up to 10 social accounts.
G2 rating: 4.3/5
4. Sprout Social
Sprout Social is a social media management and analytics platform built for teams that need reporting tied to broader marketing operations. The platform covers cross-network analytics, social listening, campaign reporting, and team collaboration workflows.
Best for: Mid-market and enterprise marketing teams that need social analytics connected to stakeholder reporting and revenue-aware KPIs.
Key features
- Cross-network campaign analytics and reporting
- Social listening and sentiment analysis
- Exportable reports with custom date ranges
- Team collaboration and approval workflows
- Competitive profile tracking
Why choose Sprout Social: When Story performance needs to show up in a leadership dashboard alongside paid social and SEO data, Sprout's export and integration depth makes that reporting defensible. It is more platform than a solo creator needs.
Sprout Social pricing: Starts at $79 per seat per month (billed annually) on the Essentials plan. Standard runs $199/seat/month, Professional $299/seat/month, and Advanced $399/seat/month. A 30-day free trial is offered.
G2 rating: 4.4/5
5. Later
Later is a visual-first social media management platform where content planning and analytics sit together. If the team spends as much time planning the Story calendar as analyzing it, Later keeps both workflows in one interface.
Best for: Creators, ecommerce marketers, and social teams planning Instagram-first content calendars where visual scheduling and analytics overlap.
Key features
- Visual content calendar with drag-and-drop scheduling
- Instagram analytics and performance tracking
- Link in Bio pages with click and traffic analytics
- Best-time-to-post recommendations
- Cross-platform publishing including TikTok, Pinterest, and LinkedIn
Why choose Later: Choose it when the planning workflow is as important as the reporting. Teams that currently use one tool for scheduling and another for analytics may find Later replaces both.
Later pricing: Starts at $18.75 per month (billed annually) on the Starter plan, covering 1 social set and 30 posts per profile monthly. Growth runs $37.50/month, Scale $82.50/month. A 14-day trial is available.
G2 rating: 4.5/5
6. Buffer
Buffer is a social media scheduling and analytics platform built for teams that want less complexity. The interface strips back features to what most small teams actually use: Schedule content, see what performed, adjust the approach.
Best for: Startups and small marketing teams that need social publishing and reporting without an enterprise-weight platform.
Key features
- Simple scheduling and content queue
- Channel-level analytics and engagement tracking
- AI assistant for caption drafts
- Community inbox for comments and replies
- Team permissions and approval workflows
Why choose Buffer: The per-channel pricing model means small teams only pay for what they actually use. When the team is two people managing three channels, Buffer's cost structure makes more sense than a per-seat platform with a minimum seat requirement.
Buffer pricing: A free plan covers up to 3 channels. Paid plans start at $5 per channel per month (billed annually) on Essentials. The Team plan runs $10 per channel per month. Monthly billing is available at higher rates.
G2 rating: 4.3/5
7. Iconosquare
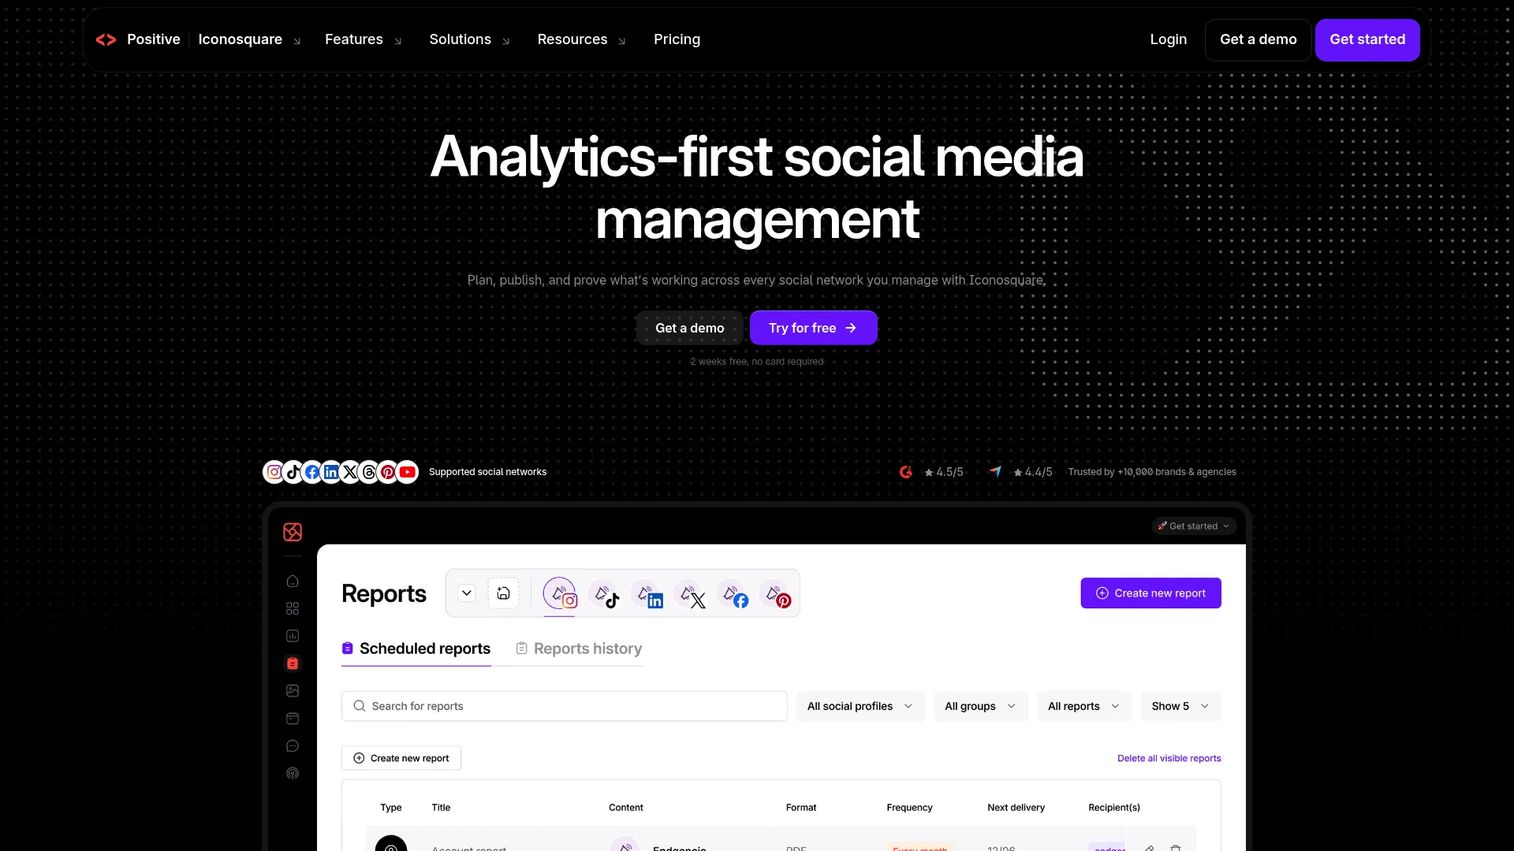
Iconosquare is an analytics-first social media platform with strong Instagram coverage. Where most scheduling-led platforms add analytics as a secondary feature, Iconosquare was built the other way around.
Best for: Instagram-heavy brands that need deeper analytics than native Insights provides, including historical benchmarks and competitor tracking.
Key features
- Instagram analytics with historical data access
- Custom dashboards and automated reporting
- Competitor and industry benchmark tracking
- Unified inbox for comments and DMs
- Approval workflows and team collaboration
Why choose Iconosquare: The benchmark data is the differentiator. When a CMO asks whether the Story engagement rate is good or just average for the category, Iconosquare can answer that question with industry context, not just internal history.
Iconosquare pricing: A free plan supports up to 2 social profiles. Paid plans start from €9 per month (billed annually) on Starter, with Launch at €33/month and Scale at €69/month. Pricing varies by region.
G2 rating: 4.4/5
8. Metricool
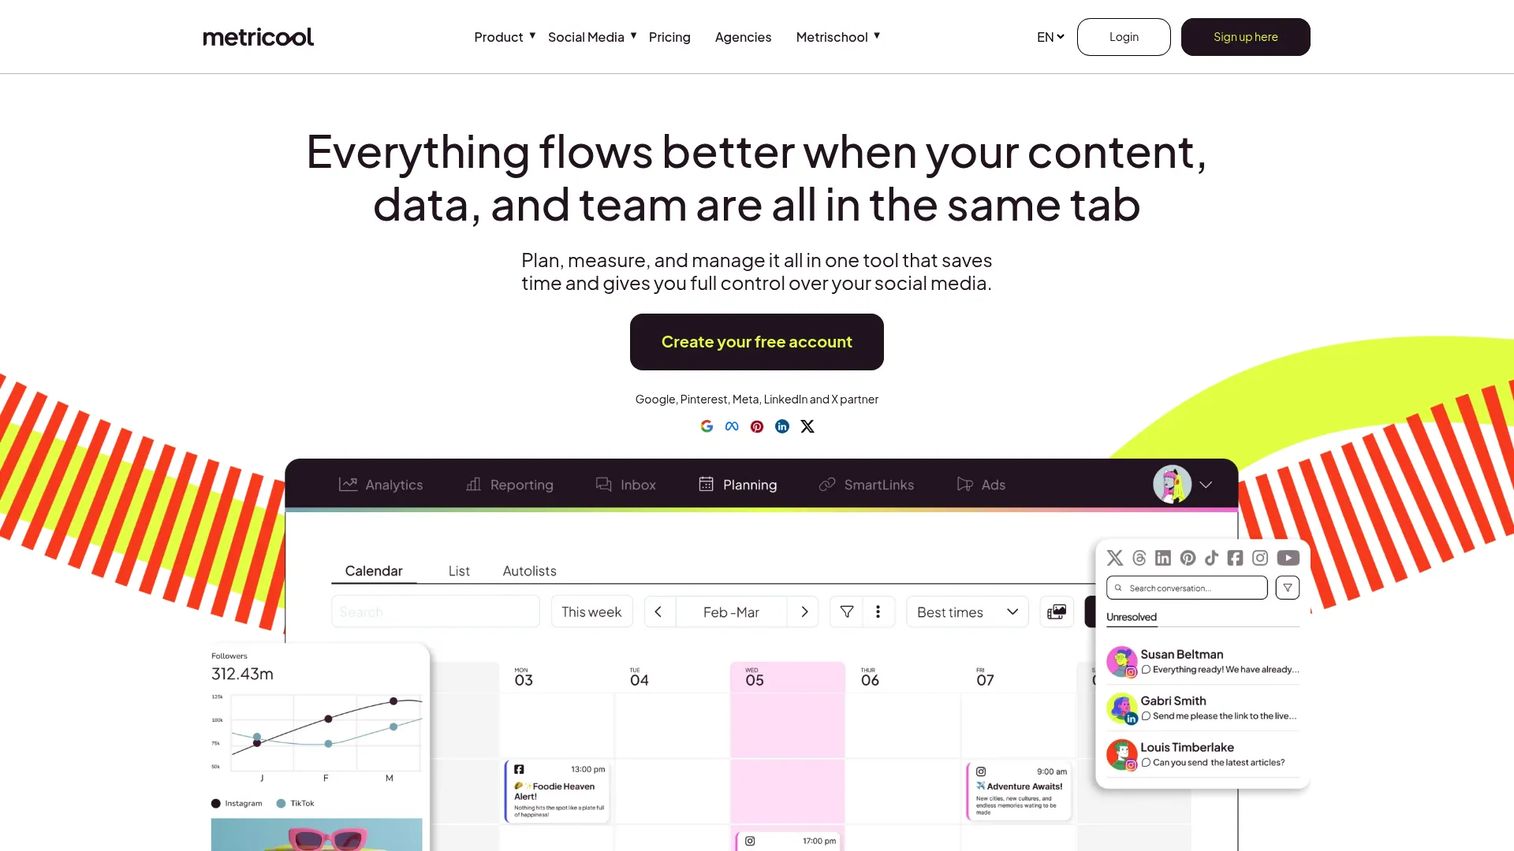
Metricool combines planning, analytics, ads reporting, and competitor tracking across Instagram, TikTok, Facebook, LinkedIn, and other channels. Its pricing model structures around brands rather than seats, which makes it attractive to agencies managing multiple client accounts.
Best for: Agencies and budget-conscious teams that need multi-channel reporting with client-ready exports and competitive monitoring.
Key features
- Multi-channel analytics and competitor tracking
- Automated report exports
- Ads reporting alongside organic analytics
- Unified inbox for messages and comments
- AI social assistant for content drafts
Why choose Metricool: For agencies, the brand-based pricing is the practical reason to choose it. Managing 10 client brands under one Starter plan costs $20 per month total, not per seat.
Metricool pricing: A free plan covers 1 brand. Starter starts at $20 per month and supports up to 10 brands. Advanced starts at $53 per month for up to 50 brands. Custom plans are available for higher volumes.
G2 rating: 4.4/5
9. Socialinsider
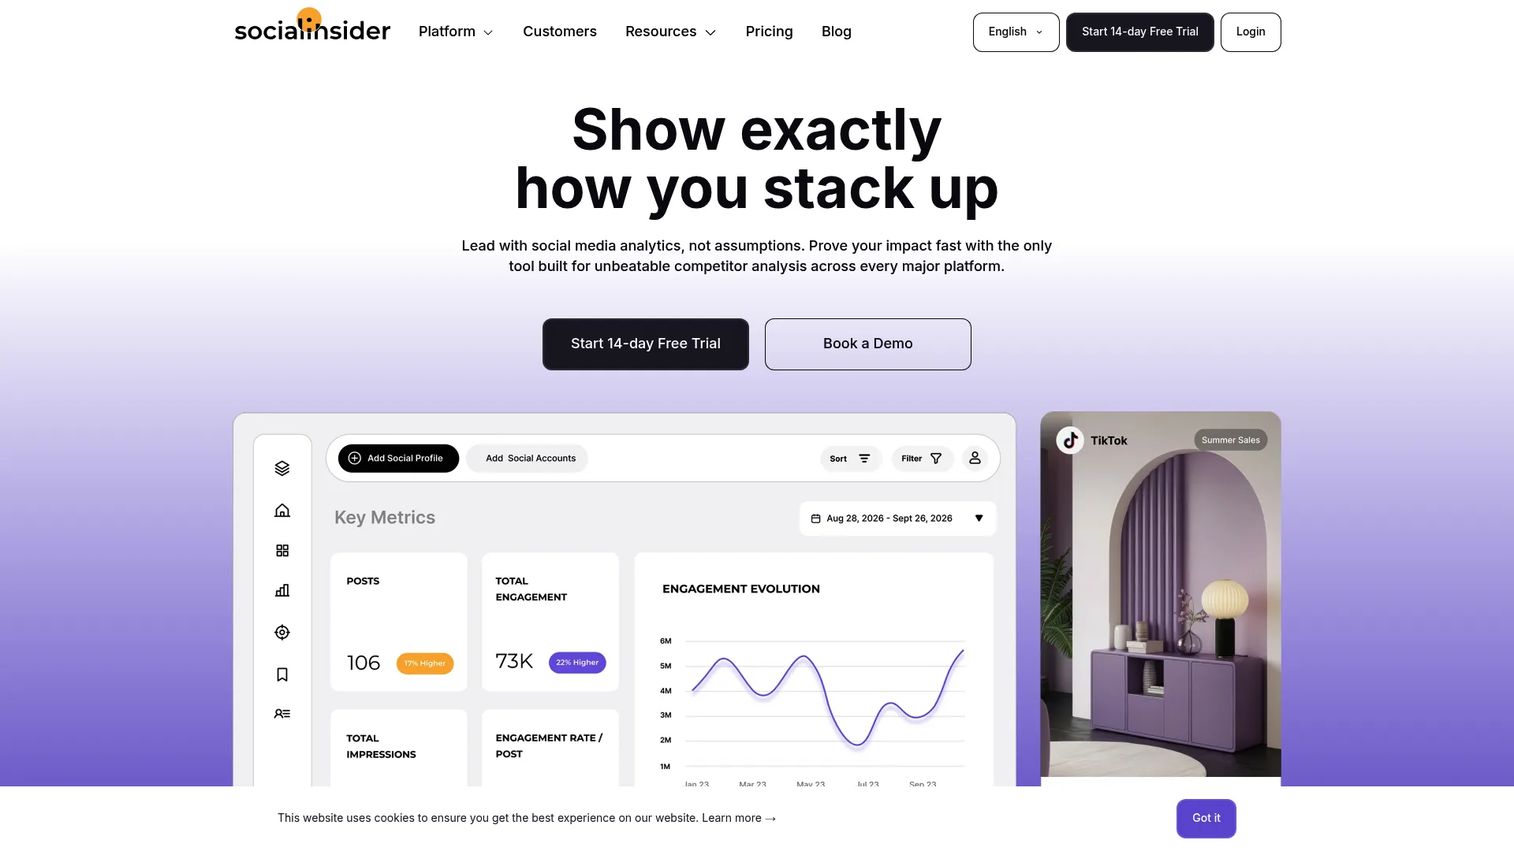
Socialinsider focuses on social analytics and competitive benchmarking. It answers a question most other tools leave unanswered: How does your performance compare to competitors running the same type of content?
Best for: Teams that need competitive Instagram analytics and category benchmarking alongside their own Story performance data.
Key features
- Cross-network analytics with historical data
- Competitor benchmarking and content analysis
- Automated reports with unlimited exports
- Campaign and event post tagging
- AI-powered content pillar segmentation
Why choose Socialinsider: The benchmarking depth is where this tool earns its price. If the reporting question is "are we above or below category average on Story exits?" Socialinsider can answer it. Research from Socialinsider (2025) shows Instagram Stories see a 23.8% exit rate on the first frame, dropping to around 12.5% by the 15th, which gives a concrete baseline to measure against.
Socialinsider pricing: Starts at $82 per month on the Adapt plan, covering up to 20 social accounts. Optimize runs $124/month, Predict $199/month. A 14-day trial is available.
G2 rating: 4.7/5
10. Emplifi
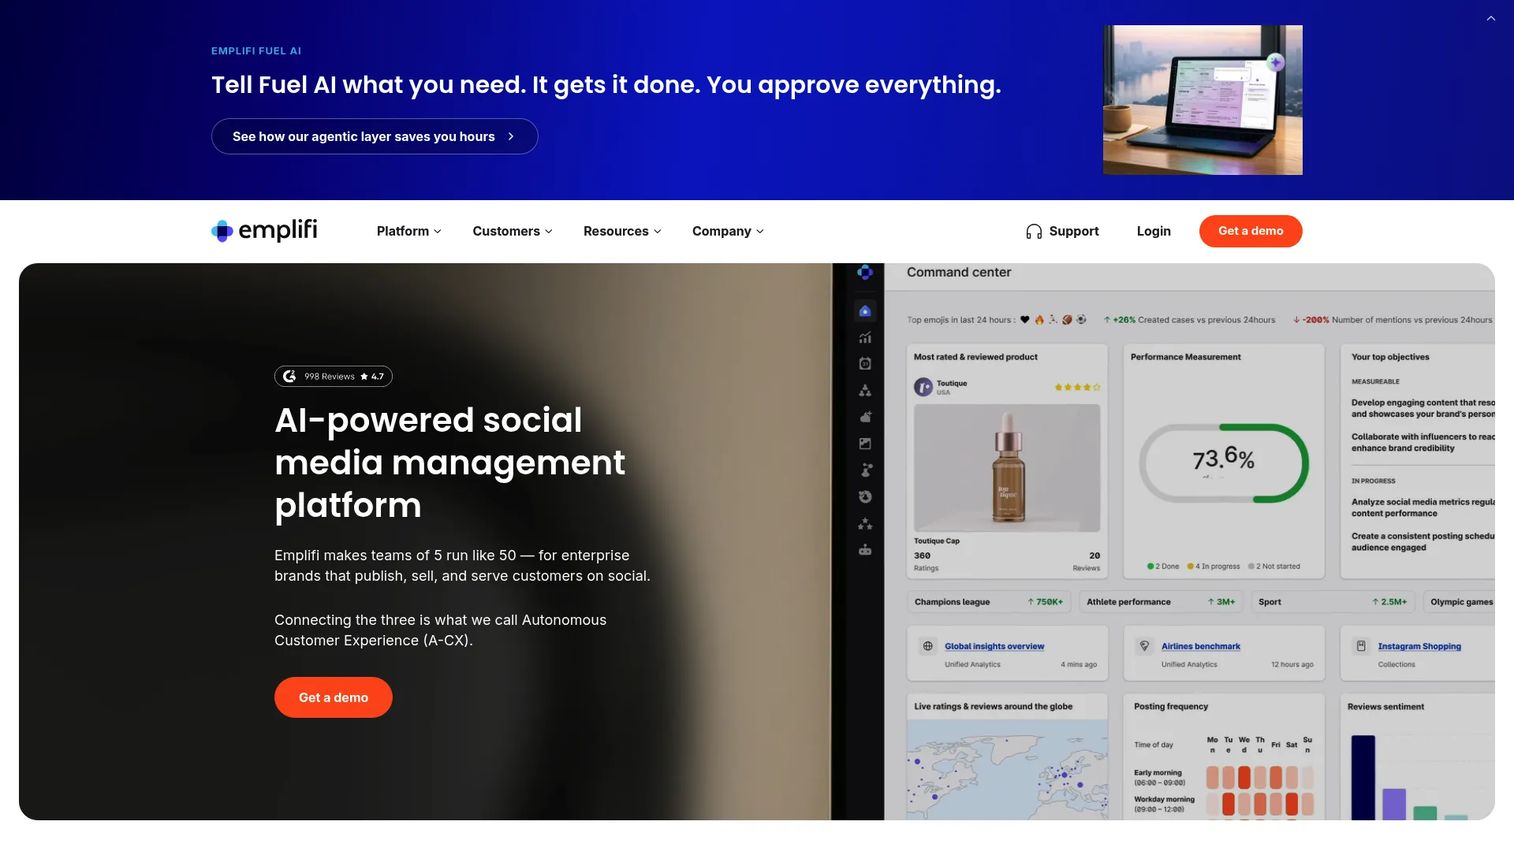
Emplifi is an enterprise social platform that spans analytics, publishing, community management, and customer care. For organizations where social reporting sits alongside care workflows and brand governance, Emplifi connects those functions in one system.
Best for: Enterprise social teams managing analytics, community engagement, and approvals across multiple regions or business units.
Key features
- AI-powered social publishing and content orchestration
- Unified analytics and social listening
- Community management and customer care workflows
- Influencer management and user-generated content tools
- Governance controls and team permissions
Why choose Emplifi: The business case is consolidation at enterprise scale. Replacing separate tools for publishing, care, and analytics with one governed platform matters when procurement, compliance, and cross-functional reporting are all in play.
Emplifi pricing: Social Marketing Essential starts at $1,249 per month. Advanced starts at $1,249 per month on the Essential plan and $2,499 per month on Advanced. The Intelligent tier requires a custom quote. No free tier is available.
G2 rating: 4.4/5
11. Dash Hudson
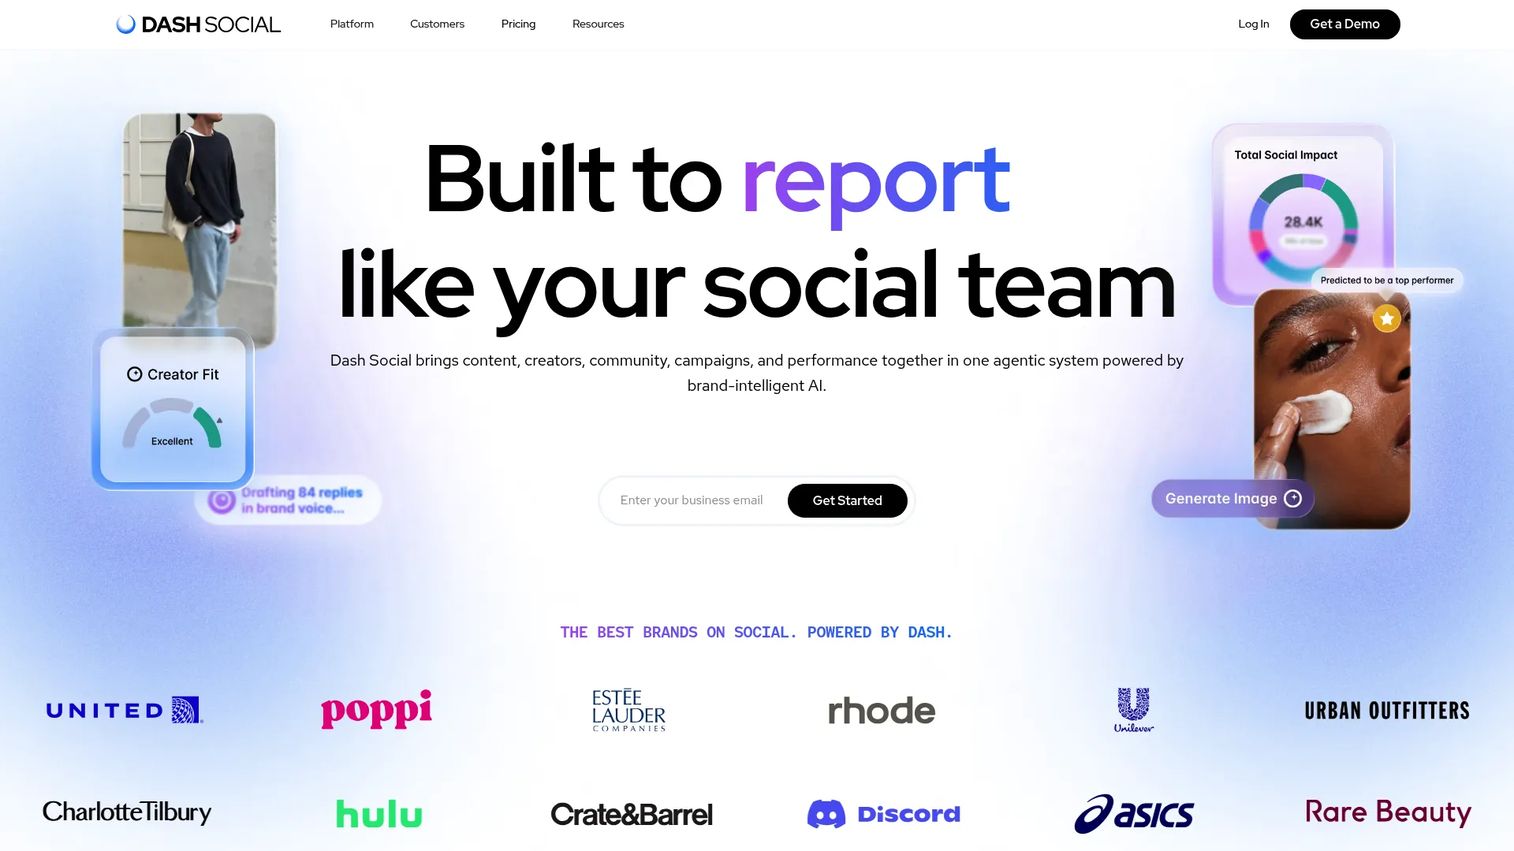
Dash Hudson (also accessible via Dash Social) is a social media management platform with a strong focus on creative performance. The Vision AI capability predicts how content will perform before you post it, which matters for brands where visual creative is the primary competitive lever.
Best for: Retail, ecommerce, beauty, fashion, and visual-first brands where creative performance drives Story and feed growth.
Key features
- Cross-channel analytics and customizable reporting
- Vision AI content performance predictions
- Creator management and UGC rights acquisition
- Competitive insights and benchmarking
- Community management and social listening
Why choose Dash Hudson: Choose it when the most important question is not just "how did this Story perform?" but "why did it perform, and what should we make next?" The creative prediction capability is the differentiator for content-heavy brands.
Dash Hudson pricing: Plans are structured as Engage, Advance, and Enterprise, all billed by quote. All plans include unlimited users. A 14-day trial is available. Contact Dash Hudson sales for current package pricing.
G2 rating: 4.7/5
12. SocialPilot
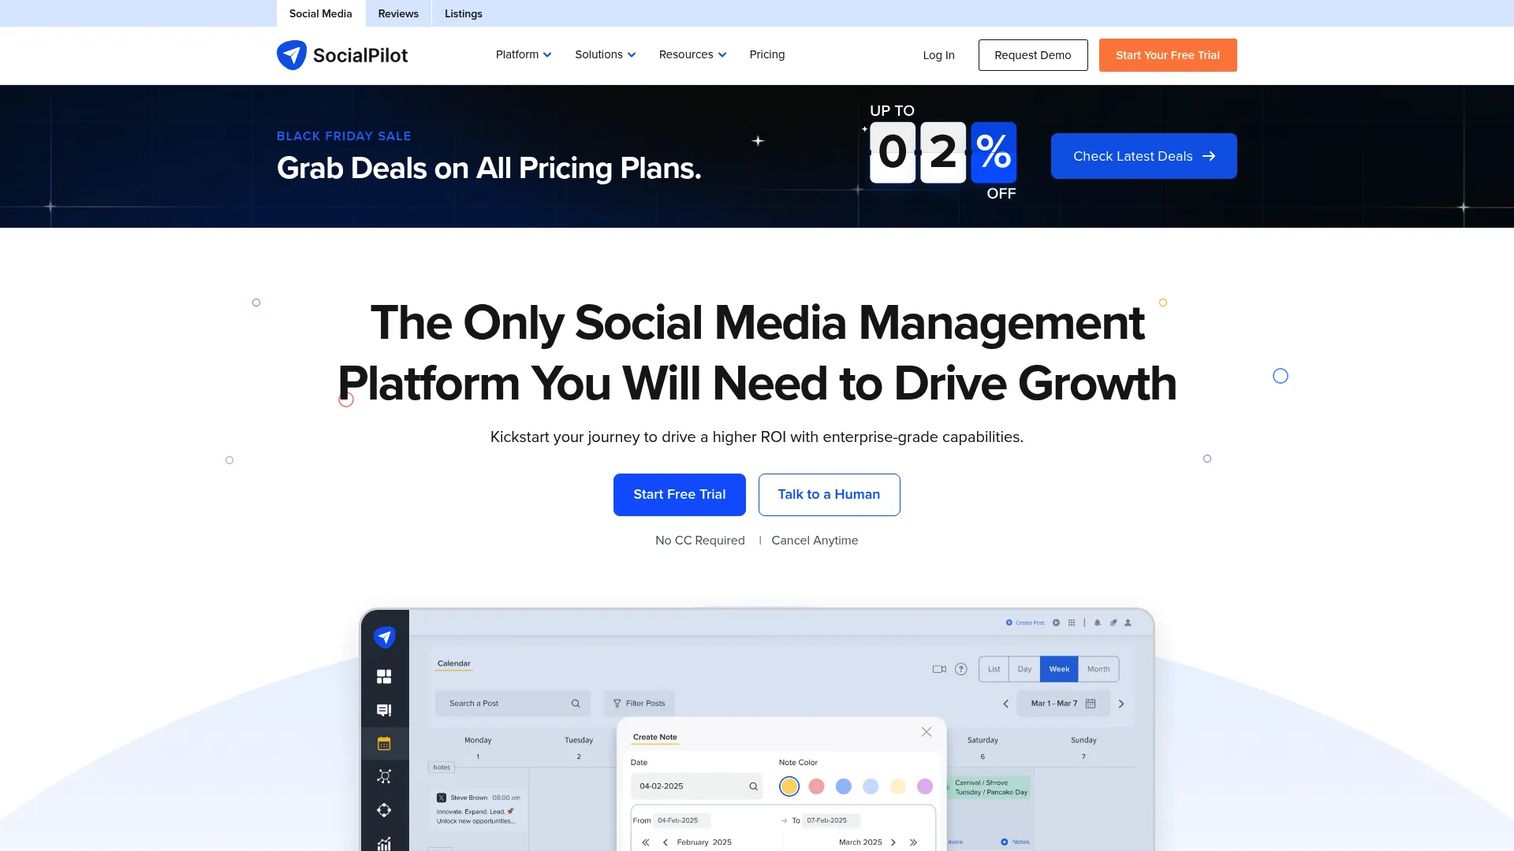
SocialPilot combines social scheduling, analytics, engagement, and client reporting in a platform priced for agencies managing many accounts. The white-label reporting feature is particularly relevant for consultants who need to send branded reports to clients without exposing the underlying tool.
Best for: Agencies and consultants managing multiple Instagram accounts who need repeatable, client-ready reporting without enterprise pricing.
Key features
- Bulk scheduling and content calendar
- Analytics dashboards and custom reports
- White-label client reporting
- AI Pilot for captions and content variations
- Team collaboration and approval workflows
Why choose SocialPilot: The price-per-volume math works in favor of agencies. At $21 per month (billed annually) on the Essentials plan, the cost per managed account is low relative to the reporting depth available.
SocialPilot pricing: Essentials starts at $21 per month (billed annually; $24/month billed monthly). Standard runs $35/month annually, Premium $70/month, and Ultimate $140/month. A free trial is available; no permanent free tier was confirmed.
G2 rating: 4.5/5
Considerations when choosing Instagram Story analytics tools
Historical data retention
Native Story data in Instagram Insights is accessible for a limited window. If you run quarterly reviews or need to benchmark seasonal campaigns, check exactly how many months each paid tool stores Story metrics and whether you can export the full history. Some platforms offer 12 months on entry plans and longer on higher tiers.
Metric depth and coverage
Not every platform pulls every Story metric from the Instagram API. Before committing, confirm whether the tool surfaces taps forward, taps back, exits per frame, sticker interactions, and link click counts. Platforms strong on feed analytics sometimes cover Story metrics only at the account level, not the frame level.
Attribution and UTM support
Story analytics earns its place in a marketing stack when link taps connect to measurable outcomes. Apply UTM parameters to every link sticker consistently. Then verify whether your analytics tool or CRM receives that traffic data and can tie it to sign-ups, trials, or purchases. Without this loop, Story reporting stays a vanity metric exercise.
Team reporting and client workflows
Solo users need very different output than a seven-person social team or an agency with 20 clients. Look for scheduled report delivery, PDF or CSV exports, role-based permissions, and client-facing dashboards. Some tools offer white-label reporting on mid-tier plans; others gate it to enterprise.
Cost versus tools replaced
The most common objection from digital marketers evaluating analytics tools is consolidation: "does this replace something we already pay for?" A paid social analytics platform that replaces a separate scheduling tool, a reporting spreadsheet process, and manual screenshot capture may cost less than the combined total it replaces.
Conclusion
The right choice depends on where your reporting is actually breaking down.
If the gap is simply having no data at all, start with Instagram Insights and Meta Business Suite. Both are free, and both provide enough to understand reach, navigation, and interaction behavior without spending anything.
When the reporting gap is historical data, benchmarks, or multi-stakeholder dashboards, Iconosquare or Socialinsider close it most efficiently. Socialinsider's 4.7 G2 rating reflects strong user satisfaction with its benchmarking depth; Iconosquare's analytics-first design gives Instagram-heavy teams more context than a scheduling platform with analytics added on.
For agencies, Metricool or SocialPilot give the best pricing-per-account math. For teams already paying for a multi-channel social platform, Hootsuite or Sprout Social consolidate Story analytics into the existing workflow.
Enterprise teams with governance requirements, care workflows, and multi-region operations should evaluate Emplifi. Visual-first brands measuring creative performance should look at Dash Hudson.
Pick the tool that matches your reporting bottleneck, then run the same weekly Story review for four weeks before changing your content strategy.
Start your journey with Guideflow today!
FAQs
Instagram Story analytics is the measurement of how audiences view, navigate, and interact with Stories, covering reach, impressions, exits, taps forward, taps back, link clicks, and sticker interactions. Marketers use this data to improve content pacing, posting cadence, and conversion paths from Story views to website traffic or product interest.
For professional accounts (business or creator), you can access Story metrics by tapping on an active Story and swiping up, or through the professional dashboard on your profile. Archived Stories also retain Insights for a limited window, accessible through the archive view in settings. Third-party tools connect via the Instagram API and preserve data beyond the native retention period.
Forward means someone tapped to skip to the next frame in your Story sequence. A small number of forward taps across a sequence is normal behavior, but a spike on a specific frame suggests the content in that frame lost the viewer's attention before finishing its job.
Back means someone tapped to rewatch the previous frame. It is often a positive signal, particularly when the frame contains a product detail, a price, an offer, or any visual element worth a second look. Study high taps-back frames closely because they reveal what your audience finds genuinely worth seeing again.
Exit means a viewer left the Stories experience entirely from that frame, either by swiping down or tapping away from Stories. A final-frame exit is expected and not a problem. Mid-sequence exits, especially on the second or third frame, usually indicate the opening hook did not deliver on what it promised, or the sequence order is not holding attention.
Navigation covers all the actions a viewer takes while moving through a Story sequence: Taps forward to skip ahead, taps back to replay, next Story swipes to leave your content for another account, and exits to leave Stories entirely. Analyzing navigation patterns as a group gives a fuller picture of how well the sequence retains attention across all its frames.
Sticker taps happen when a viewer interacts with an interactive element added to your Story, such as a link sticker, location tag, hashtag, mention, poll, quiz, or question prompt. Each sticker type indicates a different kind of intent. Link sticker taps show traffic intent; poll and question responses show engagement intent. Connecting link sticker taps to UTM-tracked destinations turns that intent data into attributable pipeline.
Instagram Insights is the best free starting point because it is built directly into the app and covers reach, impressions, exits, navigation, and sticker interactions for every professional account. Teams needing historical data, multi-account comparisons, or client-ready report exports will hit limits with native Insights and should evaluate a paid platform based on the reporting gap they need to close.