

Every click, scroll, and signup generates data. The question is whether you're capturing it in a way that actually helps you make decisions.
Digital analytics tools collect and analyze user behavior across websites, apps, and digital touchpoints. This guide covers 14 platforms across web analytics, product analytics, behavioral analytics, SEO, and BI, with pricing and ratings to help you find the right fit for your team.
What's inside
Top digital analytics tools for 2026 include Google Analytics 4 for general traffic, Adobe Analytics for enterprise deployments, and Mixpanel or Amplitude for product behavior tracking. Platforms like Hotjar provide heatmaps and session recordings, while Tableau and Looker handle visualization and reporting. This guide covers 14 tools across web analytics, product analytics, behavioral analytics, SEO, and business intelligence, with pricing and G2 ratings to help you find the right fit.
TL;DR
- Digital analytics tools collect and analyze data from websites, apps, and digital touchpoints to reveal user behavior patterns.
- Google Analytics remains the default for web traffic, while Mixpanel and Amplitude lead for product and event tracking.
- Hotjar and Fullstory show the "why" behind user actions through heatmaps and session recordings.
- Match your tool to your primary use case before comparing features.
What are digital analytics tools
Digital analytics tools are software platforms that collect, measure, and analyze data from digital interactions. The interactions happen across websites, mobile apps, marketing campaigns, and within products. The goal is to turn raw data into actionable insights about how users behave.
Here's what digital analytics platforms typically track:
One distinction worth noting: "web analytics" focuses on website traffic and marketing attribution, while "product analytics" tracks specific user actions inside an application to measure feature adoption and retention. Most SaaS companies end up using both.
Why digital analytics matters for your business
Understanding user behavior at scale
Analytics platforms reveal patterns you cannot see manually. When you're tracking thousands of sessions simultaneously, trends and friction points emerge that would otherwise stay hidden.
You might notice, for example, that users from paid campaigns bounce at twice the rate of organic visitors. Or that a specific feature drives 40% of your upgrades. Insights like that only surface when you have the data infrastructure to capture and analyze them.
Measuring performance accurately
Attribution connects actions to outcomes. Without it, you're guessing which channels, campaigns, or content actually drive conversions.
Digital analytics tools let you move from gut-feel decisions to data-backed evidence. According to McKinsey, data-driven organizations are 23x more likely to acquire customers and 19x more likely to be profitable. You can see that your LinkedIn campaign generated 200 signups last month, or that users who complete onboarding within 24 hours retain at 3x the rate of those who don't.
Optimizing conversion rates
Identifying specific drop-off points in user funnels is where analytics pays for itself. If 60% of users abandon your checkout at the shipping step, that's a clear signal to investigate.
Features like A/B testing and funnel analysis tie optimization efforts directly to revenue impact. Teams using A/B testing and funnel analysis typically see measurable lifts in conversion rates within weeks of implementation.
Types of digital analytics platforms
Web and traffic analytics platforms
Web and traffic analytics focuses on tracking website visitors, traffic sources, and page performance. Google Analytics and Matomo are the primary examples.
Tools in this category answer questions like: Where do visitors come from? Which pages get the most traffic? How long do people stay? Marketing teams commonly use web analytics for marketing attribution, content performance measurement, and audience demographic analysis.
Product and event analytics platforms
Product analytics platforms are designed for SaaS and mobile apps. Product analytics uses event-based tracking, where an "event" is a specific user action like a button click, feature usage, or signup completion.
Mixpanel and Amplitude excel here. Product analytics measures feature adoption, maps user journeys, and analyzes customer retention. If you're building a product and want to understand how people actually use it, product analytics is the category to explore.
Behavioral and experience analytics platforms
Behavioral analytics tools show the "why" behind the data. Session recordings let you watch real user sessions. Heatmaps visualize where people click, scroll, and hover.
Hotjar and Fullstory lead this space. Behavioral analytics helps teams conduct UX research, identify frustration signals like rage clicks, and understand why users abandon forms or checkout flows.
SEO and marketing analytics platforms
SEO analytics includes tools that track search engine visibility, keyword rankings, and backlink profiles. Semrush and Ahrefs are the primary players.
Marketing teams use SEO analytics for organic traffic growth, competitive analysis, and content optimization. If search is a significant acquisition channel, you'll likely want something in this category.
Business intelligence and visualization platforms
BI tools aggregate data from multiple sources into centralized reports and dashboards. Tableau, Looker, and Power BI are the main options.
BI platforms serve executive reporting, cross-team visibility, and custom dashboard creation. BI tools are particularly valuable when you want to combine data from your analytics tools, CRM, and other systems into unified views.
When to use digital analytics tools
For product teams tracking feature adoption
When launching new features, measuring product stickiness, or identifying power users, product teams want detailed usage data. Product and event analytics platforms are the right choice here.
You'll want to track which features drive retention, where users get stuck, and how adoption varies across segments. Usage data informs roadmap decisions and helps prioritize engineering resources.
For marketing teams measuring campaign ROI
To understand attribution, content performance, and channel effectiveness, marketing teams rely on web analytics and marketing analytics platforms. Web and marketing analytics show which campaigns generate qualified traffic and which content converts.
Without attribution visibility, you're allocating budget based on assumptions rather than evidence. Teams using proper attribution typically find significant opportunities to reallocate spend toward higher-performing channels.
For sales teams understanding buyer intent
Pre-sales teams use analytics to prioritize leads based on engagement signals. Tracking demo views, content interactions, and time spent helps identify the most interested prospects.
When a prospect spends 15 minutes exploring your pricing page and product features, that's a different signal than someone who bounced after 30 seconds. Analytics surfaces engagement differences so sales can focus their time effectively.
For customer success teams reducing churn
To proactively identify at-risk accounts, customer success teams monitor declining usage patterns. Product analytics platforms with health scoring capabilities flag accounts showing warning signs before they churn.
Early intervention based on usage data is significantly more effective than waiting for customers to complain or cancel.
Comparison table
14 best digital analytics tools for user behavior and real-time insights
1. Google Analytics
Google Analytics remains the industry standard for web traffic analytics. The latest version, GA4, uses an event-based model that offers more flexibility than its predecessor. Its generous free tier, deep integration with Google Ads and Search Console, and powerful audience reporting make it a default choice for most businesses.
The learning curve for GA4 is steeper than the previous version. Plan for some ramp-up time to master its advanced features, particularly around custom events and exploration reports.
Key strengths
- Free for most use cases
- Native integration with Google ecosystem
- Audience demographics and interest reports
- Cross-device tracking
- Conversion path analysis
2. Adobe Analytics
Adobe Analytics is an enterprise-grade digital analytics platform designed for large organizations with complex requirements. Adobe Analytics excels at advanced segmentation, sophisticated attribution modeling, and real-time reporting at scale.
Adobe Analytics is not a tool you implement in an afternoon. Adobe Analytics typically requires dedicated resources to implement and maintain, and the pricing reflects its enterprise positioning.
Key strengths
- Advanced multi-touch attribution
- Predictive analytics and anomaly detection
- Deep integration with Adobe Experience Cloud
- Granular segmentation capabilities
- Real-time data processing at scale
3. Mixpanel

Mixpanel is a leading product analytics platform for tracking user actions inside apps and websites. Mixpanel uses event-based tracking to power cohort analysis and retention reports, helping teams understand not just what users do, but how behavior patterns correlate with outcomes.
The self-serve nature and strong focus on product teams make Mixpanel an excellent choice for SaaS companies looking to measure and improve feature adoption. The free tier is generous enough for early-stage companies to get meaningful value.
Key strengths
- Event-based tracking without page view limitations
- Cohort analysis for retention insights
- Funnel builder with conversion tracking
- A/B test analysis
- User-level activity timelines
4. Amplitude
Amplitude is a product analytics platform focused on deep user journey analysis. Amplitude enables teams to perform behavioral cohorting, path analysis, and track complex user flows from start to finish.
Its strengths in retention and engagement analysis make Amplitude a favorite among product-led growth teams. Amplitude is particularly strong when you want to understand the sequences of actions that lead to conversion or churn.
Key strengths
- Behavioral cohorts and user segmentation
- Path and journey analysis
- Retention and engagement tracking
- Collaboration features for product teams
- Data governance and taxonomy management
Once you've set up your retention and journey analyses, here's how to quickly find the dashboards where all that data lives.
5. Hotjar
Hotjar is the go-to tool for understanding the "why" behind user behavior. Hotjar provides visual insights through heatmaps, session recordings, and on-site feedback surveys.
The ease of setup and intuitive visual approach make Hotjar ideal for UX research and conversion rate optimization. You can often identify issues within hours of installation by watching a few session recordings.
Key strengths
- Click, scroll, and move heatmaps
- Session recordings with filtering
- On-site surveys and feedback widgets
- Funnel and form analysis
- Easy installation with no-code setup
6. Fullstory

Fullstory is a digital experience analytics platform with advanced session replay capabilities. Fullstory automatically captures all user interactions and uses AI to flag frustration signals like rage clicks and error clicks.
The ability to search sessions by specific actions makes Fullstory particularly valuable for teams diagnosing UX issues. You can find every session where a user encountered a specific error or abandoned a specific flow.
Key strengths
- Auto-capture of all user interactions
- Frustration detection (rage clicks, dead clicks, error clicks)
- Searchable session replay
- Conversion funnel analysis
- Integration with product and support tools
7. Glassbox
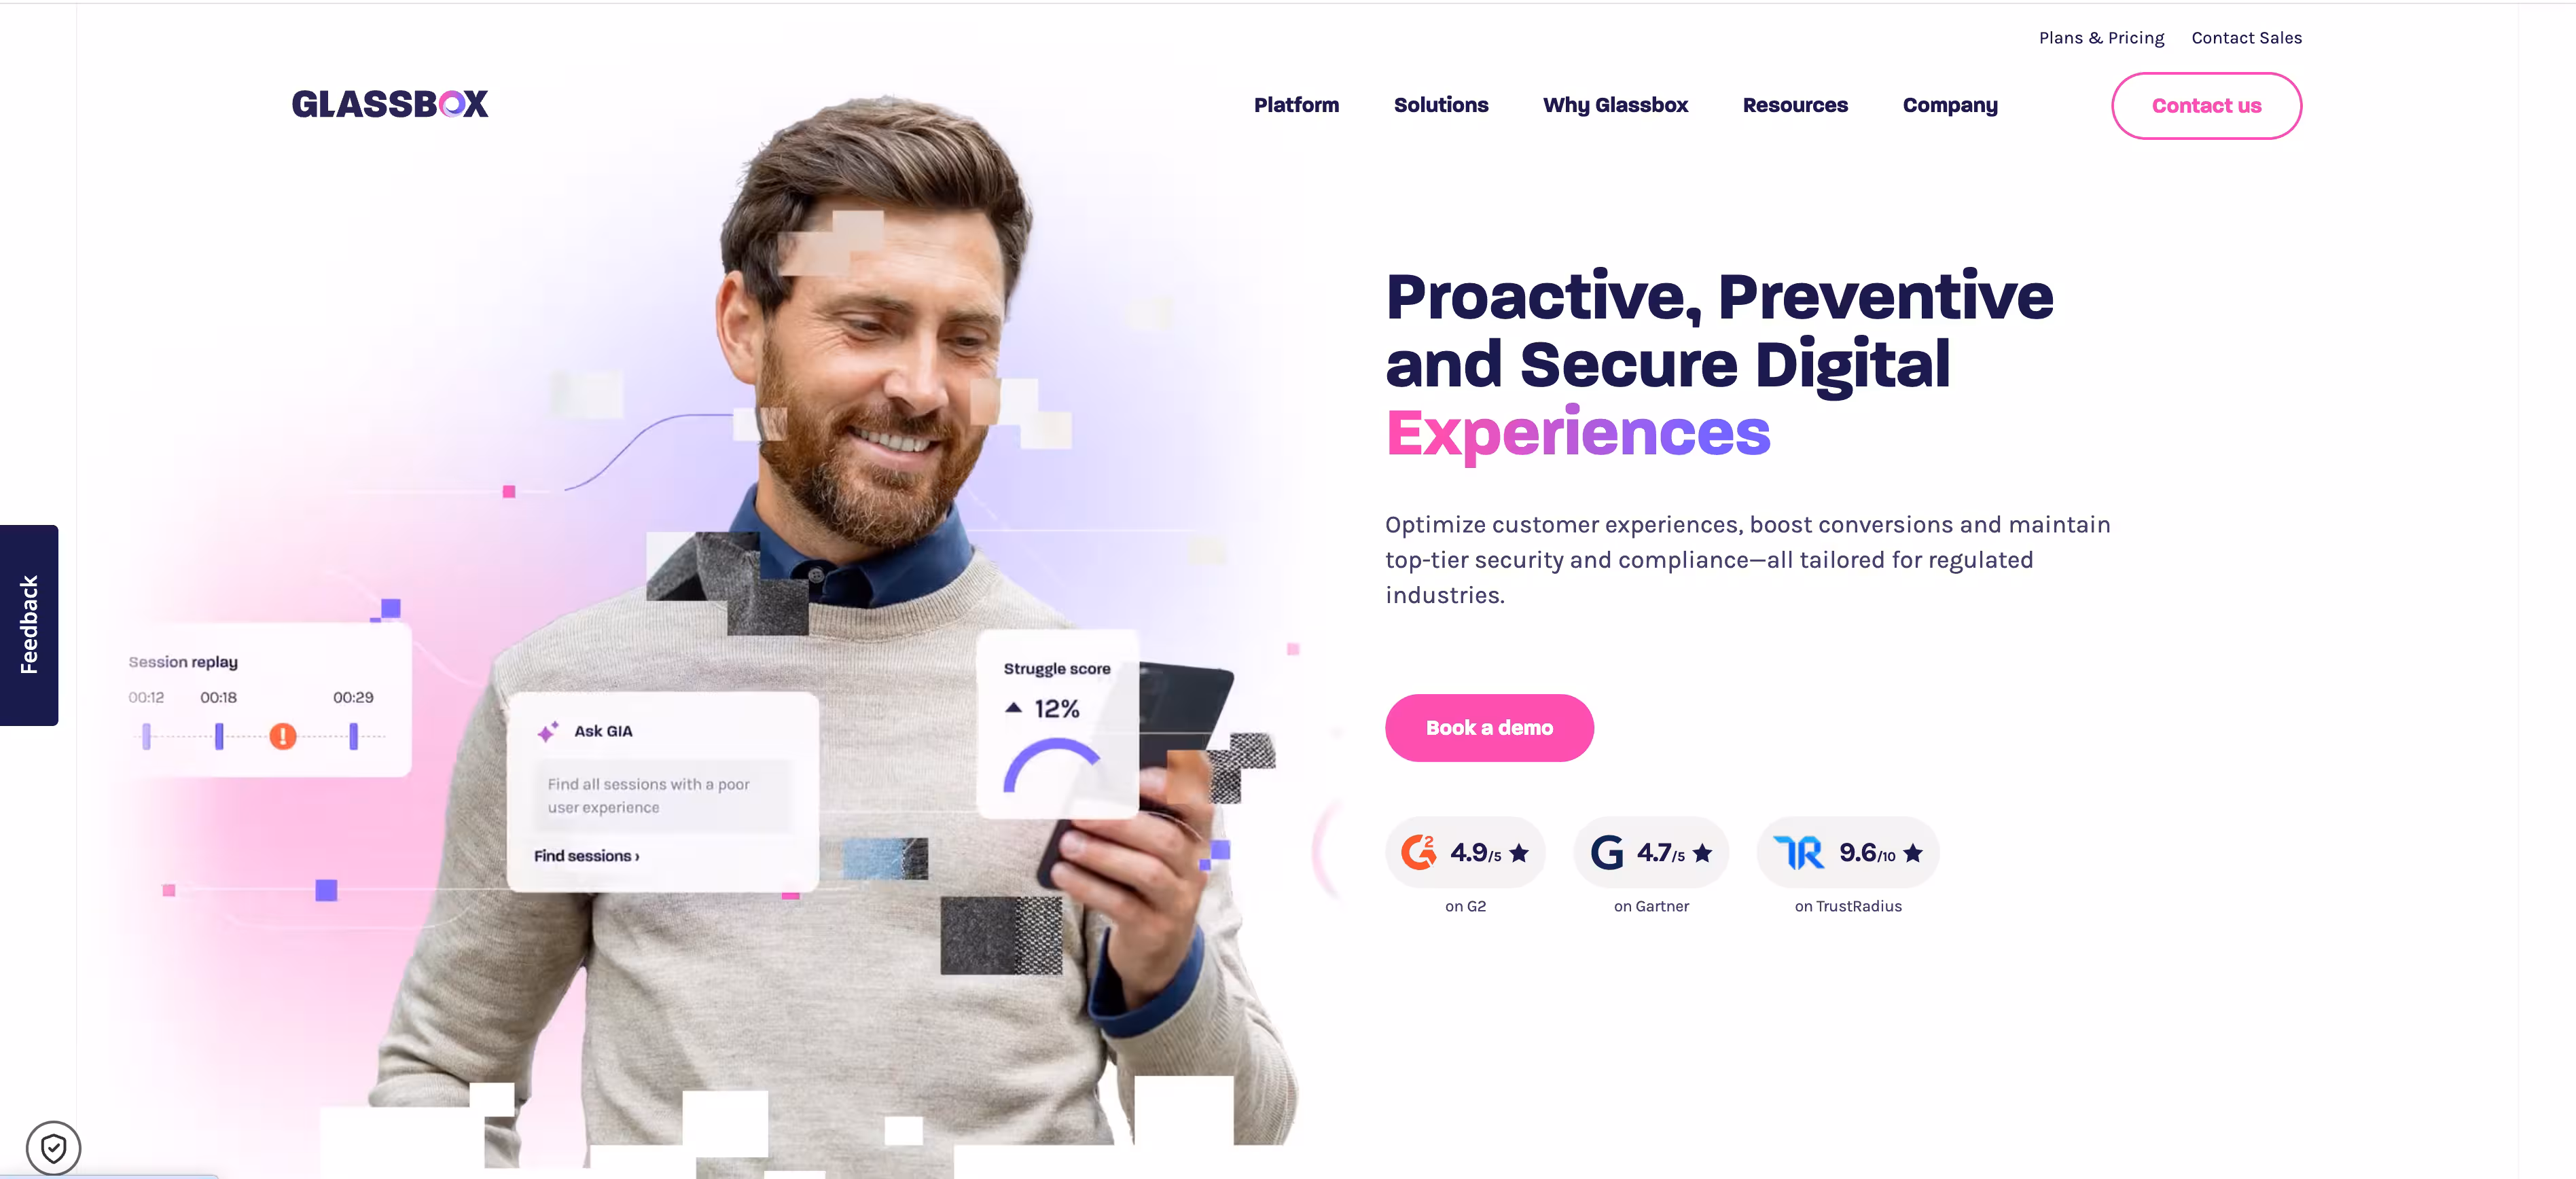
Glassbox is an enterprise digital experience analytics platform focused on web and mobile apps. Glassbox offers session replay, AI-powered struggle analysis, and voice of customer integration.
Glassbox stands out for its strong mobile app support and compliance features, making it a good fit for regulated industries like financial services and healthcare.
Key strengths
- Mobile app analytics with native SDKs
- AI-powered struggle detection
- Voice of customer integration
- Compliance features for financial services and healthcare
- Customer journey orchestration
8. Pendo

Pendo combines product analytics with in-app guidance. Pendo not only tracks feature usage but also enables teams to deploy product tours, announcements, and surveys directly within their application.
Pendo is a strong all-in-one solution for product teams that want analytics plus user communication in a single tool. The combination is particularly valuable for onboarding and feature adoption use cases.
Key strengths
- Feature adoption tracking
- In-app guides and announcements
- NPS and feedback collection
- Roadmap prioritization based on usage data
- Cross-app portfolio analytics
9. Heap

Heap is a product analytics platform known for its automatic event capture. Heap captures all user interactions by default without requiring manual tagging, which allows teams to define events retroactively.
Heap's approach is ideal for teams that want comprehensive data without a heavy initial implementation lift. You can decide what to analyze after the fact, rather than having to instrument everything upfront.
Key strengths
- Auto-capture of all user interactions
- Retroactive event definition
- Funnel and retention analysis
- Session replay integration
- Data science integrations
10. Looker
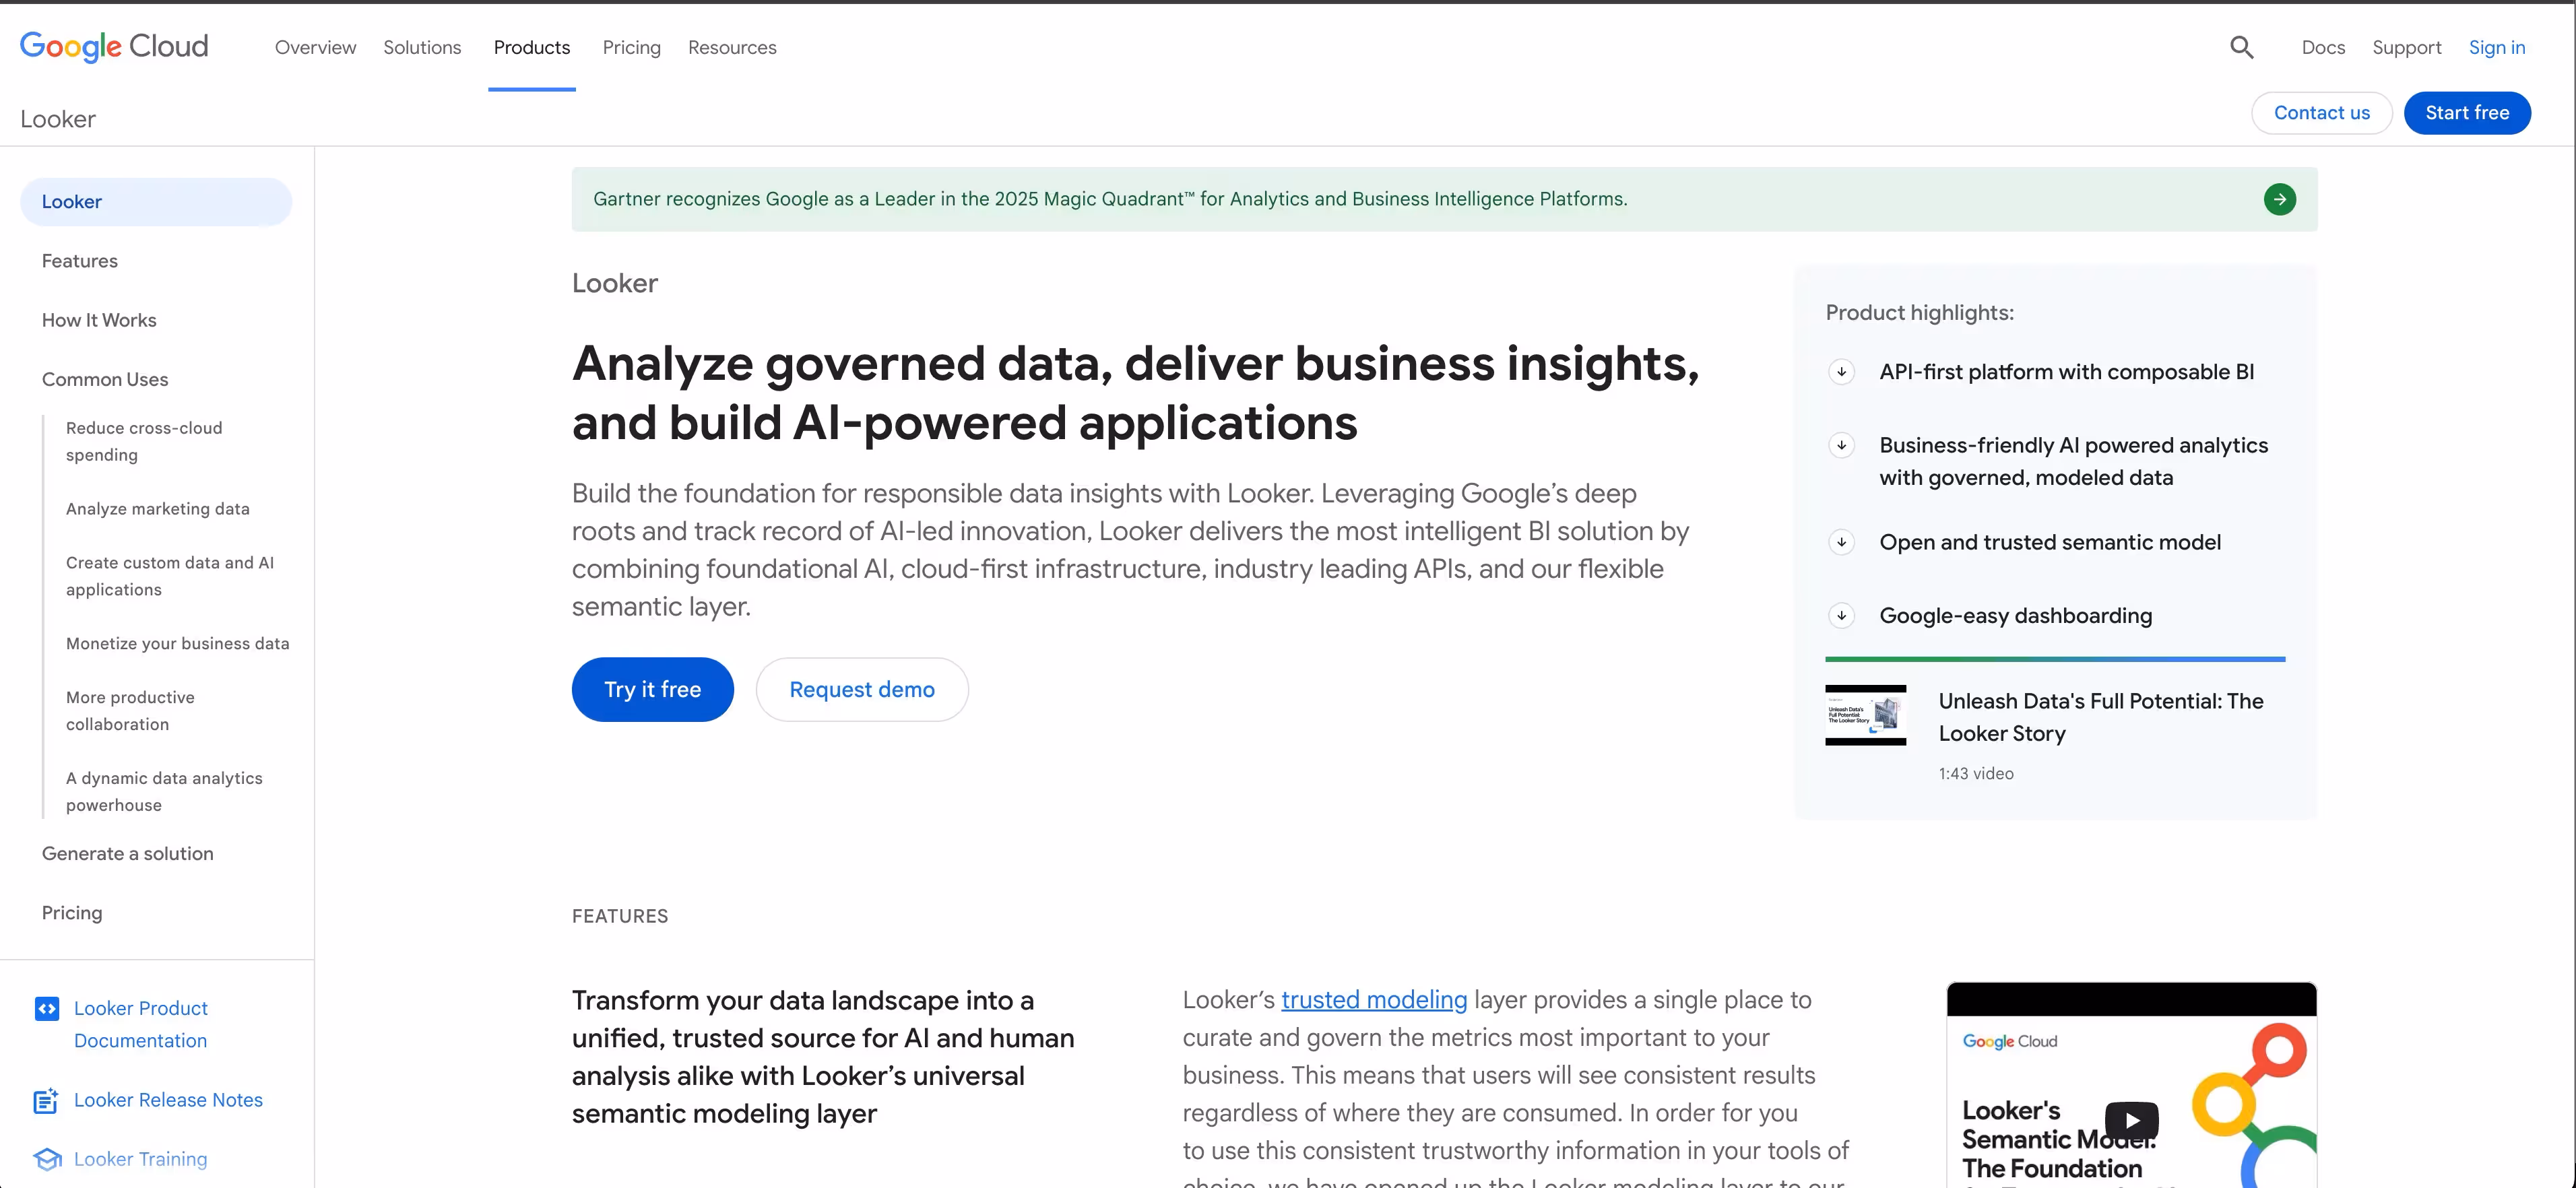
Now part of Google Cloud, Looker is a powerful BI and visualization platform. Its unique semantic modeling layer (LookML) allows for robust, reusable data models that ensure consistency across reports.
Looker is an excellent choice for organizations that want to embed analytics directly into their own products or want highly customized dashboards built on a governed data layer.
Key strengths
- Semantic modeling with LookML
- Embedded analytics for SaaS products
- Real-time data exploration
- Native Google Cloud integration
- Customizable dashboards and reports
11. Tableau

Tableau is the leading data visualization platform for business intelligence. Its intuitive drag-and-drop interface, wide range of data source connectors, and ability to create highly interactive dashboards make Tableau a top choice for teams that want to visualize and share insights.
Tableau excels when you have analysts who want to explore data freely and create compelling visualizations for stakeholders across the organization.
Key strengths
- Drag-and-drop dashboard creation
- Wide data source connectivity
- Interactive visualizations
- Sharing and collaboration features
- Mobile-optimized dashboards
12. Semrush

Semrush is a comprehensive SEO and marketing analytics platform. Semrush offers a full suite of tools for keyword research, competitive analysis, backlink tracking, and content optimization.
For marketing teams focused on growing organic search traffic and understanding competitive positioning, Semrush provides the depth of data to make informed decisions.
Key strengths
- Keyword research and tracking
- Competitive domain analysis
- Backlink auditing and monitoring
- Content optimization recommendations
- PPC and advertising research
Keyword research is where most teams start with Semrush - here's how to use the Keyword Magic Tool to find the right terms for your strategy.
13. Sprout Social
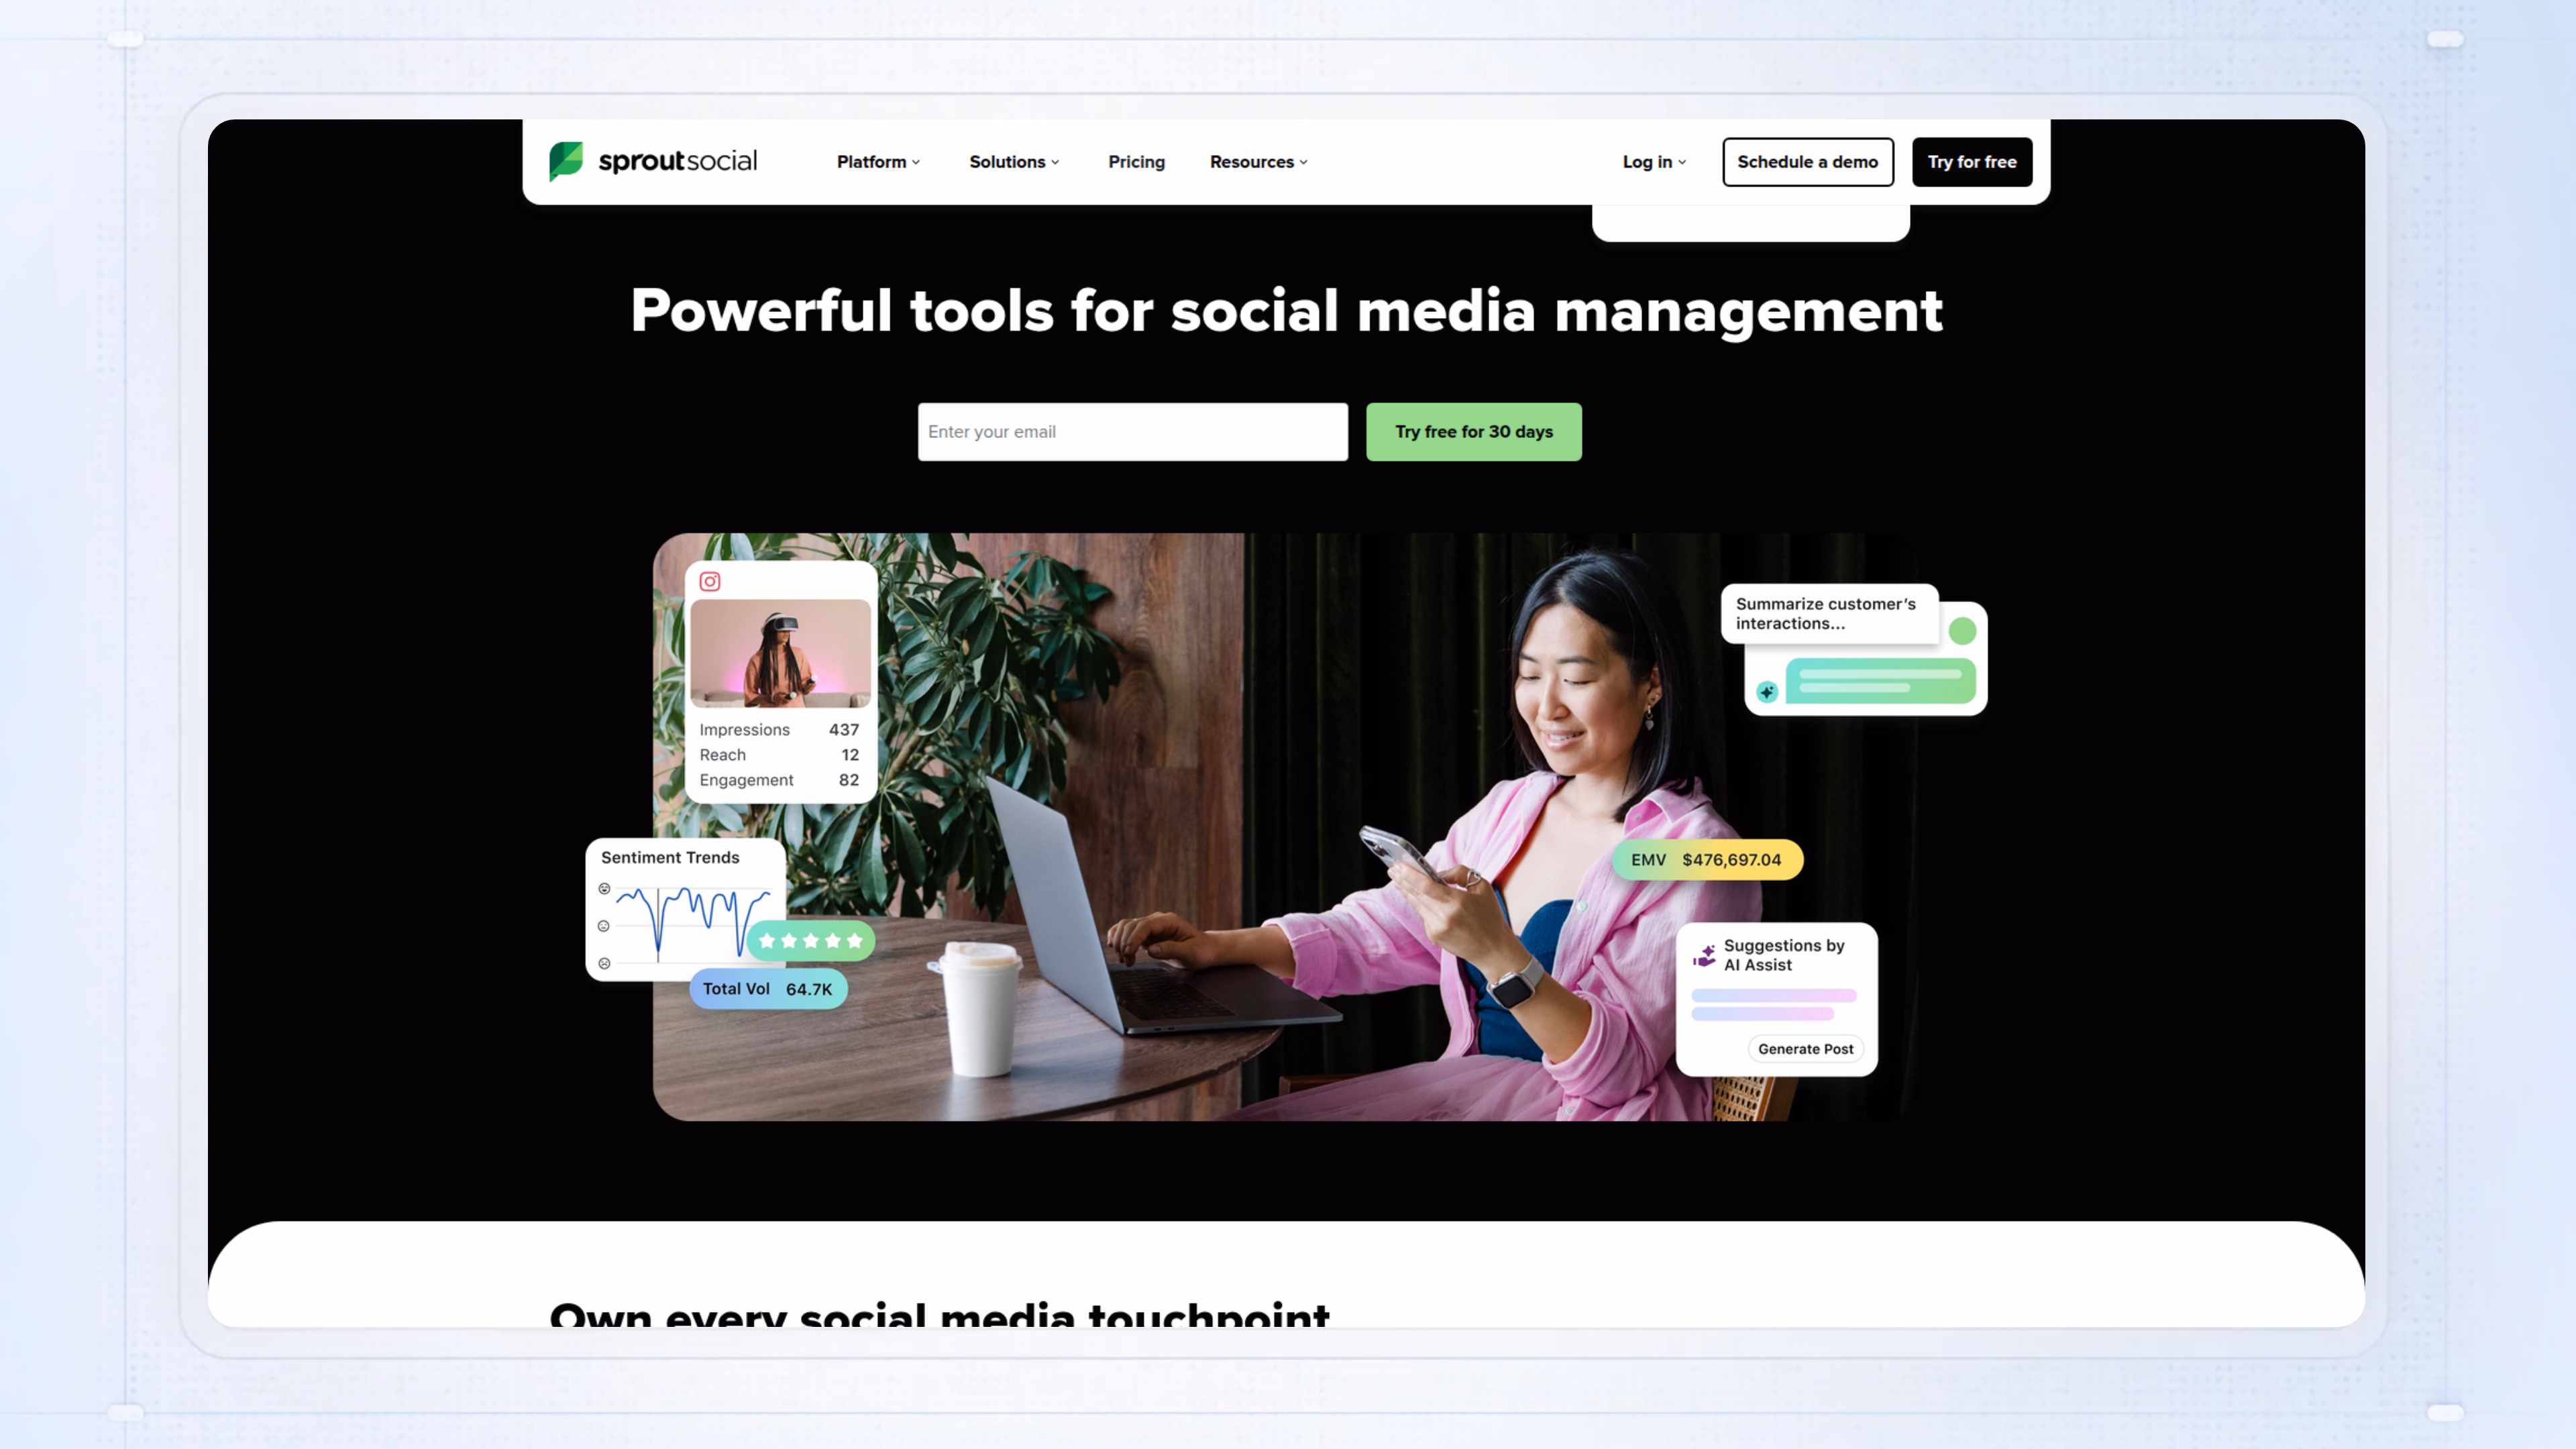
Sprout Social is a social media analytics and management platform. Sprout Social provides cross-platform reporting, engagement tracking, and a unified inbox for managing all social interactions in one place.
Sprout Social is best suited for marketing teams managing multiple social channels who want centralized analytics and engagement capabilities without switching between native platform tools.
Key strengths
- Cross-platform social analytics
- Engagement and audience growth tracking
- Competitor benchmarking
- Unified social inbox
- Scheduled reporting and exports
14. Optimizely
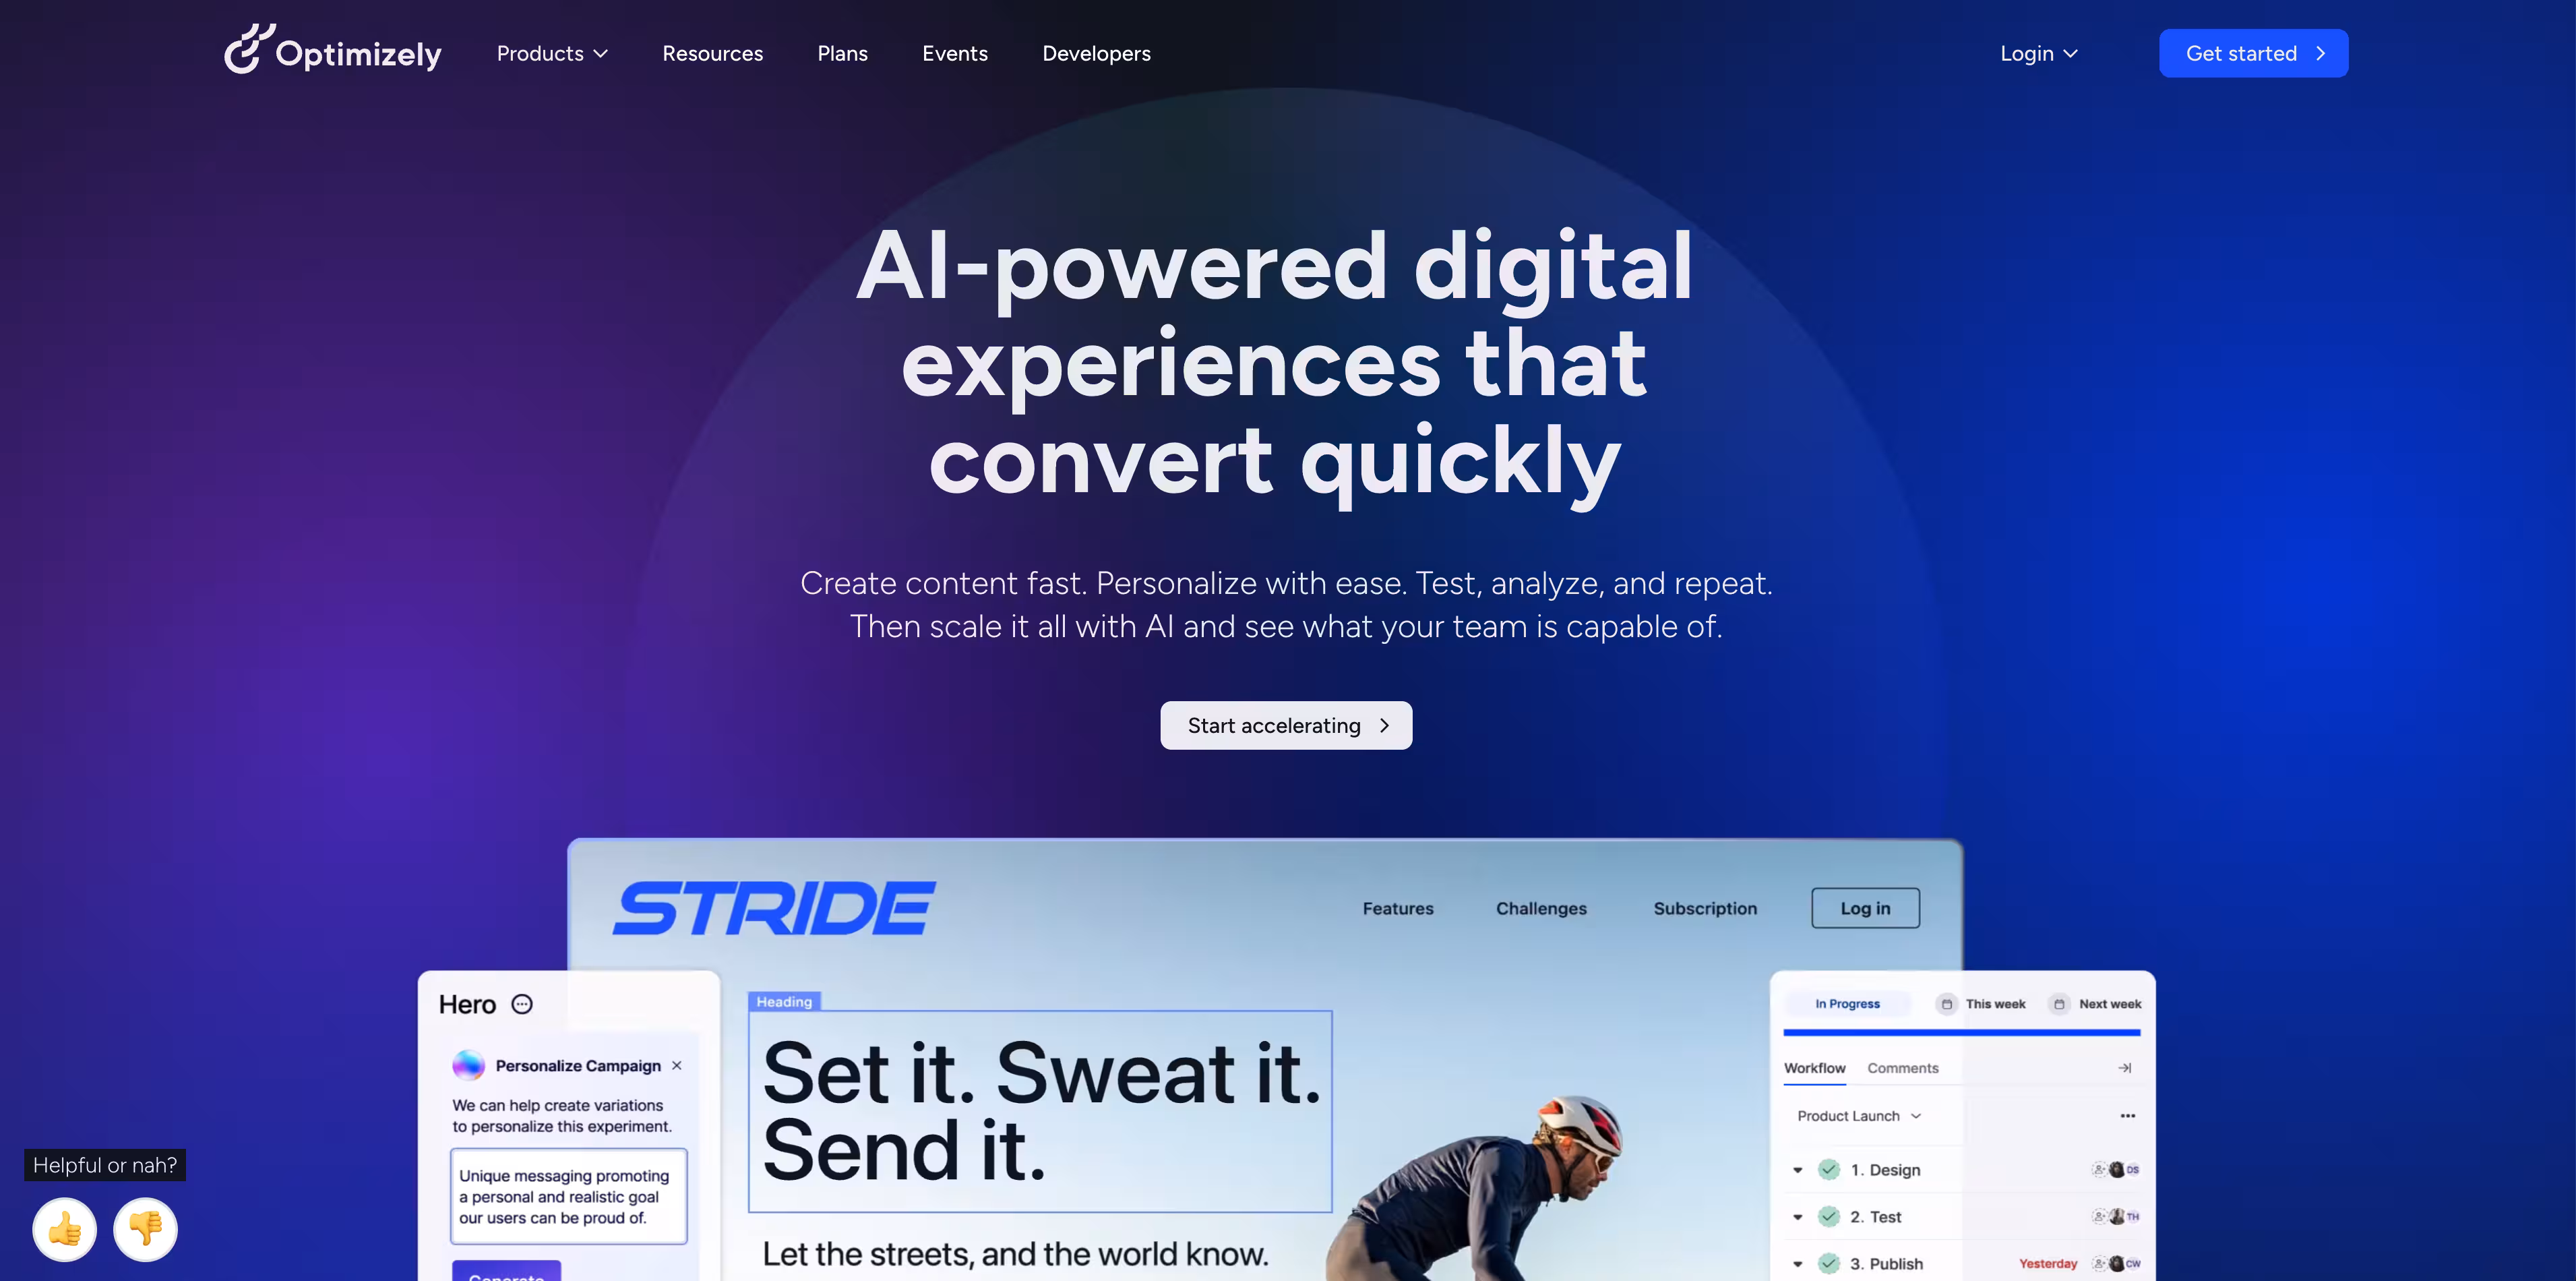
Optimizely is a leading experimentation and A/B testing platform. Optimizely is known for its statistical rigor, feature flagging capabilities, and ability to run experiments across web, mobile, and server-side environments.
Optimizely is best suited for mature teams with an established optimization practice who want confidence in their test results and the ability to progressively roll out features.
Key strengths
- A/B and multivariate testing
- Feature flagging and progressive rollouts
- Statistical significance calculations
- Server-side experimentation
- Content personalization
How to choose the right digital analytics platform
Define your primary use case
Start by clarifying what you actually want to measure. Are you focused on web traffic, product behavior, UX issues, or marketing attribution? Map your requirements to the tool categories outlined above.
Trying to solve every analytics problem with one tool usually leads to compromise. Pick one primary use case to focus on before considering expansion into adjacent categories.
Evaluate integration requirements
Your analytics platform will generate the most value when it connects to your existing tech stack. Look for tools with robust APIs and pre-built connectors to your CRM, marketing automation platform, and data warehouse.
The ability to integrate analytics data with other systems determines whether insights actually drive action or sit in dashboards that nobody checks.
Assess pricing and scalability
Pricing often scales with the volume of events, sessions, or users tracked. Costs can increase significantly as your data volume grows, so understand the pricing model completely before committing.
Some tools offer generous free tiers that work well for early-stage companies. Others start at enterprise price points. Match the pricing structure to your current scale and growth trajectory.
Test before you commit
Take advantage of free tiers or trials to validate that a tool meets your requirements. Pilot the platform with a single team or specific use case before planning an organization-wide rollout.
The best way to evaluate an analytics tool is to use it with your actual data and workflows. Demos and documentation only tell part of the story.
What to evaluate before buying
Use this checklist when comparing digital analytics solutions:
- Data accuracy: Does the tool capture all interactions without sampling at your scale?
- Privacy compliance: Does it support GDPR, CCPA, and cookieless tracking options?
- Ease of implementation: How much engineering work is required to deploy and maintain?
- User interface: Can non-technical users access insights without SQL or support tickets?
- Integrations: Does it connect to your CRM, data warehouse, and marketing stack?
- Support and documentation: What level of support is included? Is documentation comprehensive?
- Total cost of ownership: Beyond licensing, what are implementation and ongoing maintenance costs?
Start tracking what matters today
Choosing the right digital analytics platform depends on your specific use case, team capabilities, and integration requirements. The key is to start with a clear goal, test a few top contenders, and select the tool that provides the most actionable insights for your business. For teams that want to understand how prospects engage with product content before they ever talk to sales, demo analytics fills a gap that traditional tools miss entirely.