Pitch
Pitch.com is a modern presentation software that combines design, collaboration, and storytelling.
Website
Industry
Collaboration
Share this article:

How to enable chart gridlines in Pitch

How it works

  1. First click the presentation that contains the chart you want to edit
  2. Then click the chart to select it
  3. Next click on the "More options" button in the chart toolbar
  4. Finally toggle on the "Grid" option in the chart settings sidebar

Create your own interactive guide with Guideflow

Why should you use this feature?

Pitch is a collaborative presentation software designed to bring ideas to life effortlessly.

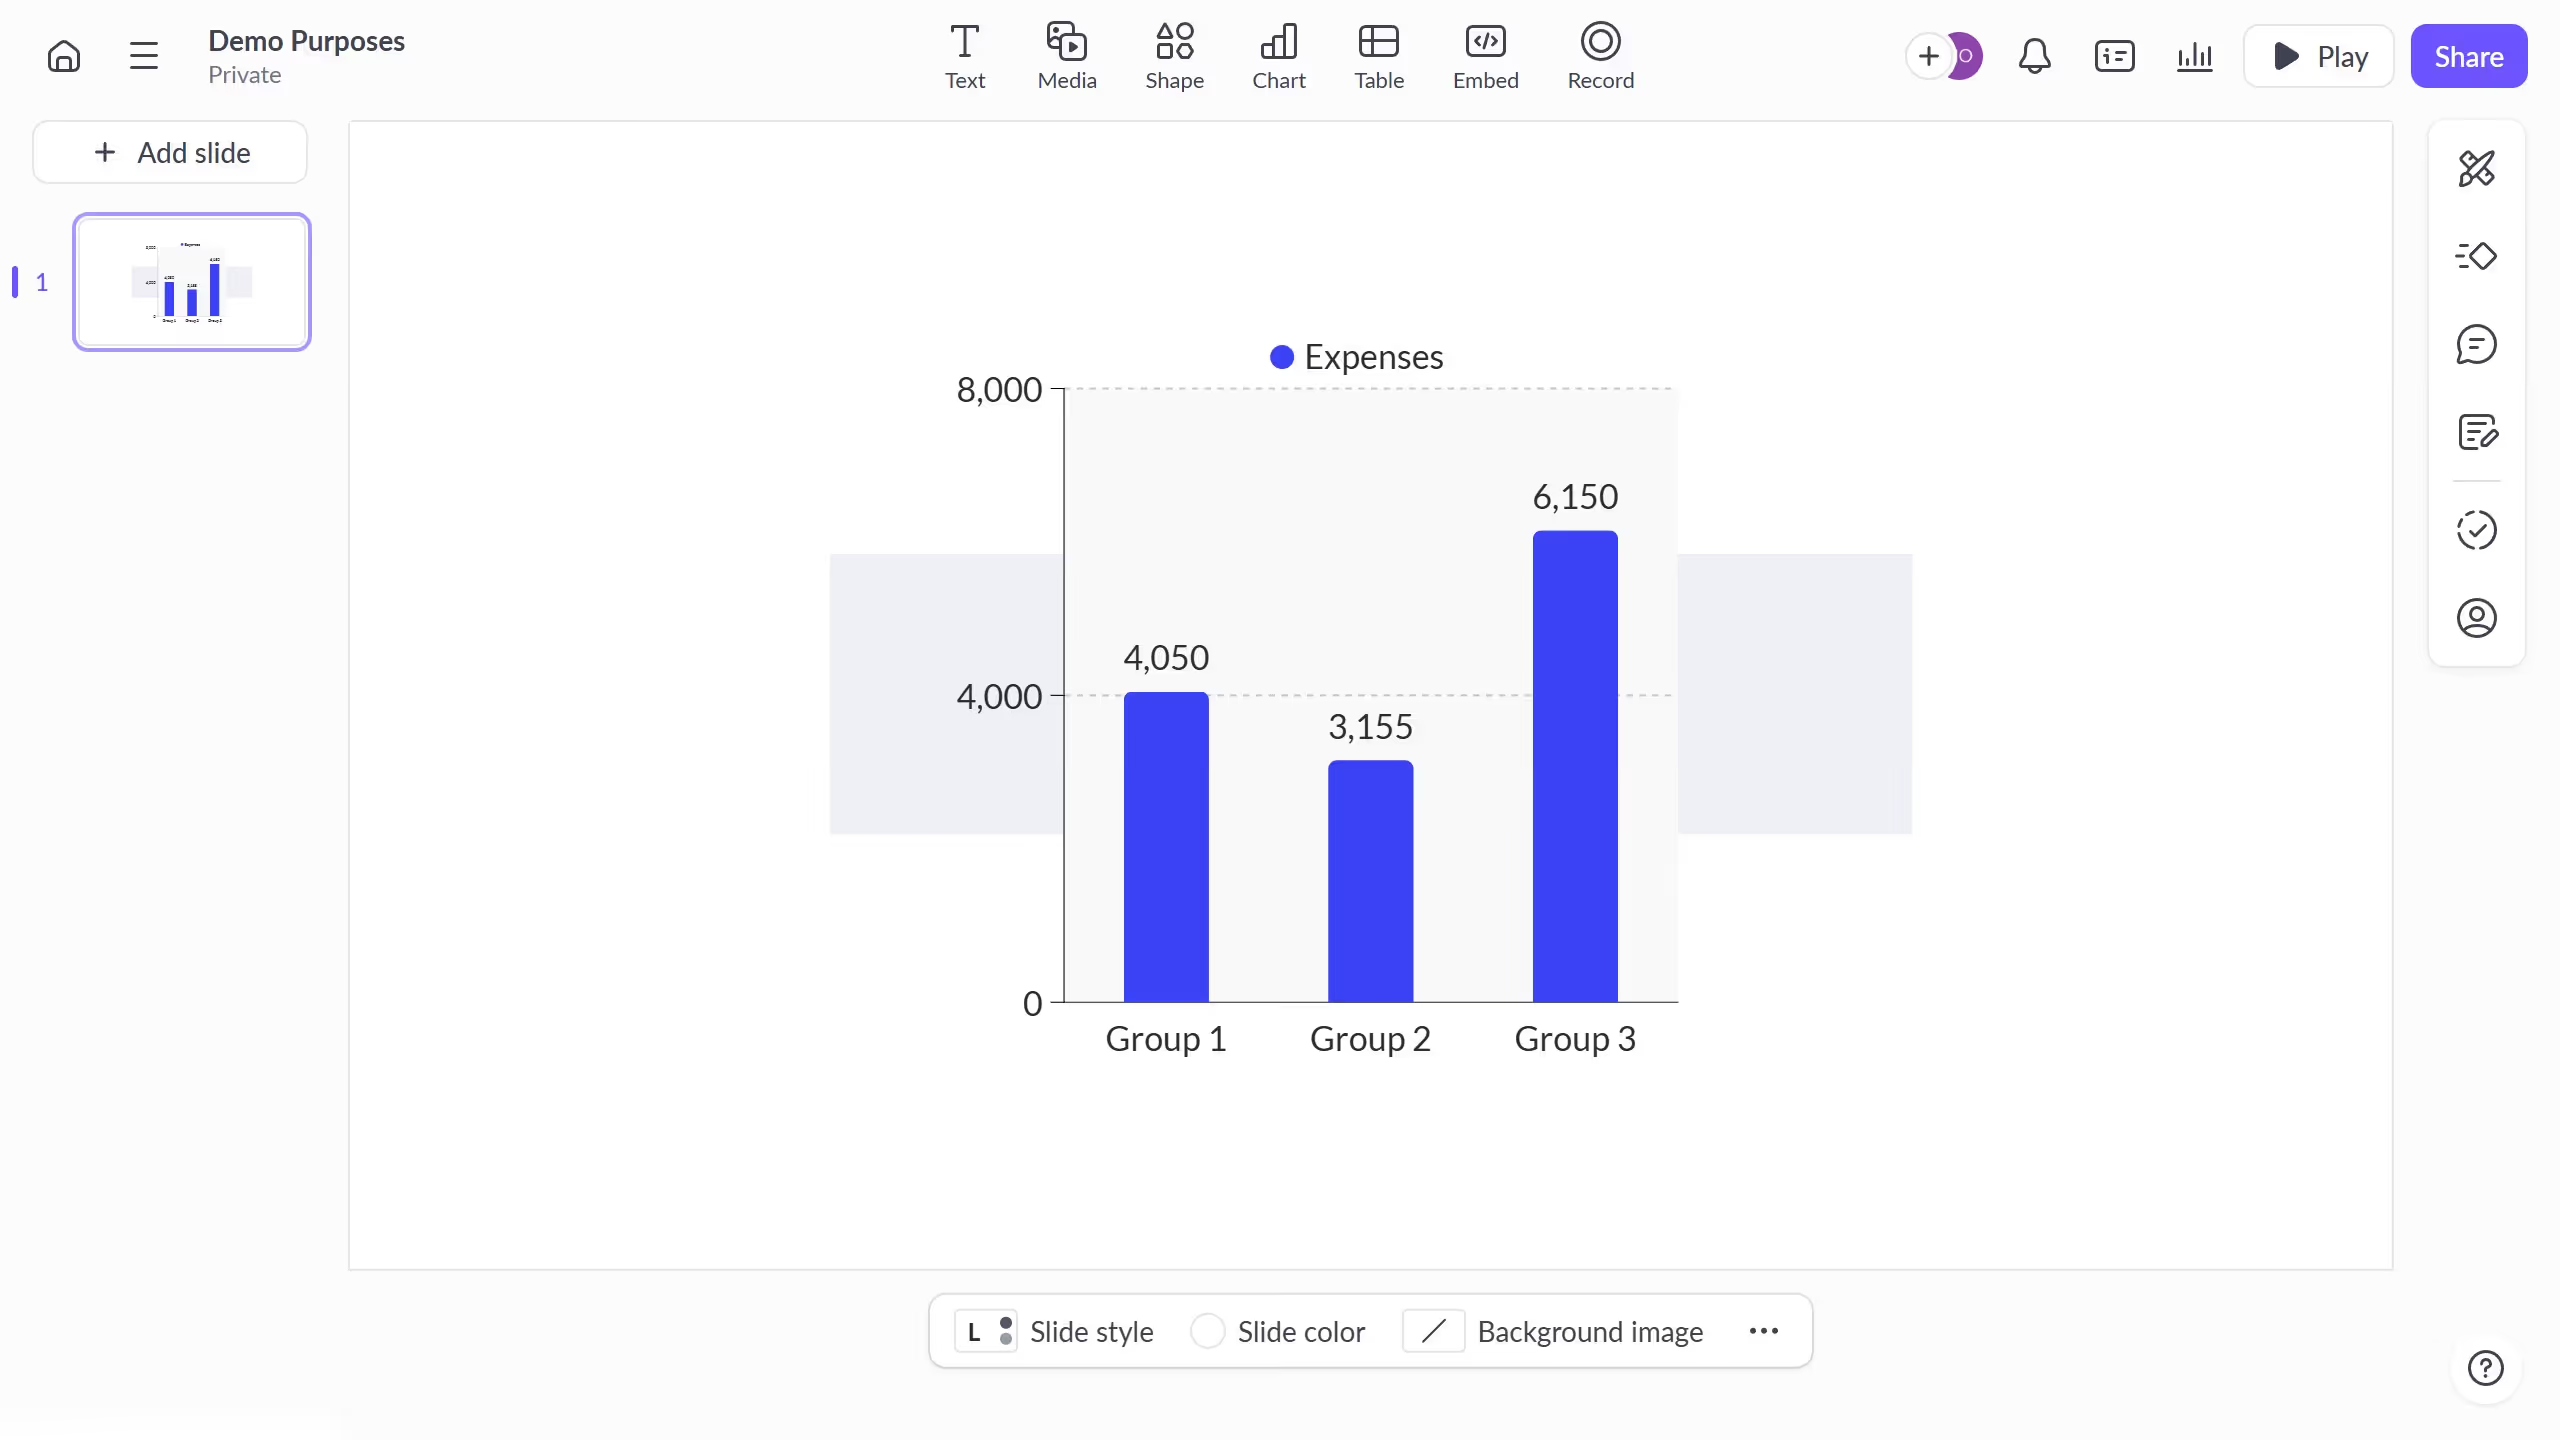
One useful feature within Pitch is the ability to enable chart gridlines, which enhances clarity in data visualization. When the gridlines are enabled, your charts become more readable and precise, helping to distinguish data points and trends effortlessly.

Utilizing this feature can significantly benefit teams by improving the accuracy of data analysis and facilitating better communication of complex information. This ultimately aids in more informed decision-making.

Last update
December 19, 2025
Cursor MariaA cursor points to a button labeled "James."

Create your first demo in less than 30 seconds.