Your cloud link just spiked. The monitoring dashboard has 500 alerts. None of them tell you whether the problem is a misconfigured route, a saturated uplink, or a failed device three hops away. By the time someone figures it out, the call has dropped and the customer noticed first.
Network environments have changed faster than most monitoring stacks. On-prem devices, cloud services, remote endpoints, IoT hardware, and branch locations now share the same operational responsibility, and over 79% of network and IT professionals spend at least 10% of their working time just troubleshooting, according to NetOp Cloud's 2025 survey. The cost of poor visibility scales with the complexity of what you're running.
This guide cuts through the vendor claims. It covers 21 network management tools, from mature enterprise platforms to open-source utilities and security-focused engines, with verified pricing, confirmed G2 ratings, and honest notes on where each fits. Use it to shortlist, not to read everything.
What's inside
This guide is for IT teams, network administrators, infrastructure engineers, SecOps analysts, MSP operators, and technical evaluators who need to compare network management software options for 2026.
Tools were selected and evaluated across four criteria:
- Monitoring coverage: SNMP, NetFlow, sFlow, IPFIX, packet capture, topology, and security telemetry
- Deployment model: SaaS, self-hosted, open-source, cloud-native, or probe-based
- Pricing model: per-sensor, per-device, per-node, ingest-based, open-source, or quote-based
- Operational fit: alerting quality, scalability, integration support, and team ownership model
The list spans commercial platforms, open-source projects, cloud-native services, and specialized security tools.
TL;DR
- Best enterprise network platform: SolarWinds Network Performance Monitor for mature infrastructure operations with topology and path analysis
- Best sensor-based monitoring: Paessler PRTG for flexible device-level coverage with a predictable per-sensor model
- Best open-source all-rounder: Zabbix for teams that can manage setup and want broad coverage without license fees
- Best cloud-native monitoring: Datadog Network Monitoring for SaaS and DevOps teams already invested in Datadog observability
- Best traffic intelligence: Kentik for flow analytics, BGP visibility, and internet performance analysis
- Best security and packet-level add-ons: Wireshark for packet capture, Suricata for intrusion detection, Splunk or IBM QRadar for log correlation and SIEM workflows
What are network management tools?
Network management tools are software platforms that help teams discover, monitor, configure, troubleshoot, secure, and report on the devices and services that keep a network running.
The term covers a spectrum. Network monitoring tracks uptime, latency, bandwidth, device health, and alert states. Network management extends that to include configuration backup, change tracking, topology mapping, IP address management, log correlation, compliance reporting, and operational workflows. Security monitoring adds threat detection, packet inspection, intrusion detection, and SIEM correlation.
Most teams need a mix. The right blend depends on device count, cloud footprint, security posture, and who owns the tool.
Core capabilities to evaluate
- Device discovery and inventory
- SNMP polling and trap collection
- Traffic and bandwidth analysis
- NetFlow, sFlow, and IPFIX collection
- Topology and dependency mapping
- Configuration backup and change tracking
- Alert routing, escalation, and deduplication
- Dashboards and scheduled reporting
- Cloud and hybrid network visibility
- Security monitoring and log correlation
Deployment models
Tools differ as much by how they run as by what they monitor. The main deployment types are SaaS, self-hosted, open-source, probe-based, cloud-native services, packet or flow analyzers, and SIEM-adjacent security platforms. Choosing a deployment model before evaluating features saves significant time.
When to use network management tools
Troubleshoot outages before users escalate
Network tools detect interface errors, failed devices, routing anomalies, overloaded links, and dependency failures before the help desk gets flooded. Without monitoring coverage, teams learn about problems from users, not dashboards, which means longer resolution times and eroded trust.
Validate hybrid and cloud network performance
SNMP polling covers on-prem devices well. Hybrid environments with cloud links, VPN tunnels, branch offices, and SaaS dependencies need flow data, path analysis, and cloud-native metrics alongside traditional SNMP. Relying on SNMP alone in a hybrid environment creates blind spots at the exact layers where modern failures occur.
Reduce alert noise and operational guesswork
Baseline monitoring, dependency-aware alerts, and proper threshold tuning separate signal from noise. A dashboard with 500 undifferentiated alerts is operationally worse than no dashboard. Good network monitoring systems surface what changed, not just what's wrong.
Network management tools comparison
The table below summarizes all 21 tools by fit, differentiator, pricing, and G2 rating. Each tool fits a different operating model. Use the table to narrow your shortlist, then read the full entries for tools that match your environment.
| # | Product | Best for | Key differentiator | Pricing | G2 rating |
|---|---|---|---|---|---|
| 1 | SolarWinds Network Performance Monitor | Enterprise network operations | Topology and hop-by-hop path analysis | From $2,829 (30-day trial) | N/A |
| 2 | Paessler PRTG | Sensor-based monitoring | 250+ sensors with probe-based distribution | From $200/mo (Freeware up to 100 sensors) | 4.7/5 |
| 3 | Zabbix | Open-source infrastructure monitoring | Zero license cost; broad protocol and template support | Free (open-source); Cloud from $50/mo | 4.3/5 |
| 4 | Nagios Core | Lightweight open-source monitoring | Plugin-based extensibility for technical teams | Free (open-source) | N/A |
| 5 | Nagios XI | Commercial Nagios deployment | Enterprise UI with configuration wizards | From $2,595 (perpetual, 100 nodes) | 4.5/5 |
| 6 | Datadog Network Monitoring | Cloud-native and DevOps teams | Network telemetry inside unified Datadog observability | From $5/host/mo (annual) | 4.4/5 |
| 7 | Netdata | Real-time infrastructure metrics | Per-second metrics with ML anomaly detection | Free Community; Business from $4.50/node/mo | 4.6/5 |
| 8 | Kentik | Traffic and internet performance | Flow analytics, BGP visibility, and DDoS detection | Pro from $2,000/mo (annual); 30-day trial | 4.8/5 |
| 9 | LogicMonitor | Hybrid SaaS infrastructure monitoring | AIOps with 3,000+ integrations and dynamic thresholds | From $16/Hybrid Unit/mo; 15-day trial | 4.5/5 |
| 10 | LibreNMS | Open-source SNMP monitoring | Auto-discovery with community-driven device support | Free (open-source) | 4.6/5 |
| 11 | OpenNMS | Open-source and enterprise monitoring | Event-driven monitoring with Meridian enterprise edition | Horizon free; Meridian from $6,000/yr | 4.1/5 |
| 12 | Icinga | Open-source monitoring customization | Git-based and infrastructure-as-code configuration | Free edition; subscriptions from 5,000 EUR/yr | 4.4/5 |
| 13 | Cacti | Graphing and bandwidth trends | RRDTool-based long-term performance graphing | Free (open-source) | N/A |
| 14 | Progress WhatsUp Gold | SMB and mid-market network monitoring | Discovery, maps, alerts, and reporting in one product | Contact Progress for pricing | 4.4/5 |
| 15 | Site24x7 Network Monitoring | SaaS monitoring for distributed teams | Cloud-hosted SNMP plus NetFlow and topology maps | All-in-one plans from $10/mo | 4.6/5 |
| 16 | Microsoft Azure | Azure-native network visibility | Native telemetry for Azure networking through Network Watcher | Consumption-based; free account available | 4.4/5 |
| 17 | Wireshark | Packet-level troubleshooting | Deep protocol inspection for root-cause analysis | Free (open-source) | 4.7/5 |
| 18 | Splunk | Log and security analytics | Data correlation across network, infrastructure, and security | Quote-based (Cloud Platform, Enterprise) | 4.4/5 |
| 19 | IBM QRadar | Enterprise security monitoring | SIEM correlation for network and security events | Quote-based; EPS/FPM or MVS licensing | 4.4/5 |
| 20 | Nmap | Network discovery and scanning | Fast host discovery, port scanning, and OS detection | Free for end users (OEM licenses separate) | N/A |
| 21 | Suricata | Intrusion detection and security monitoring | Multi-threaded IDS/IPS with Eve JSON output | Free (open-source) | N/A |
Best 21 network management tools for 2026
1. SolarWinds Network Performance Monitor
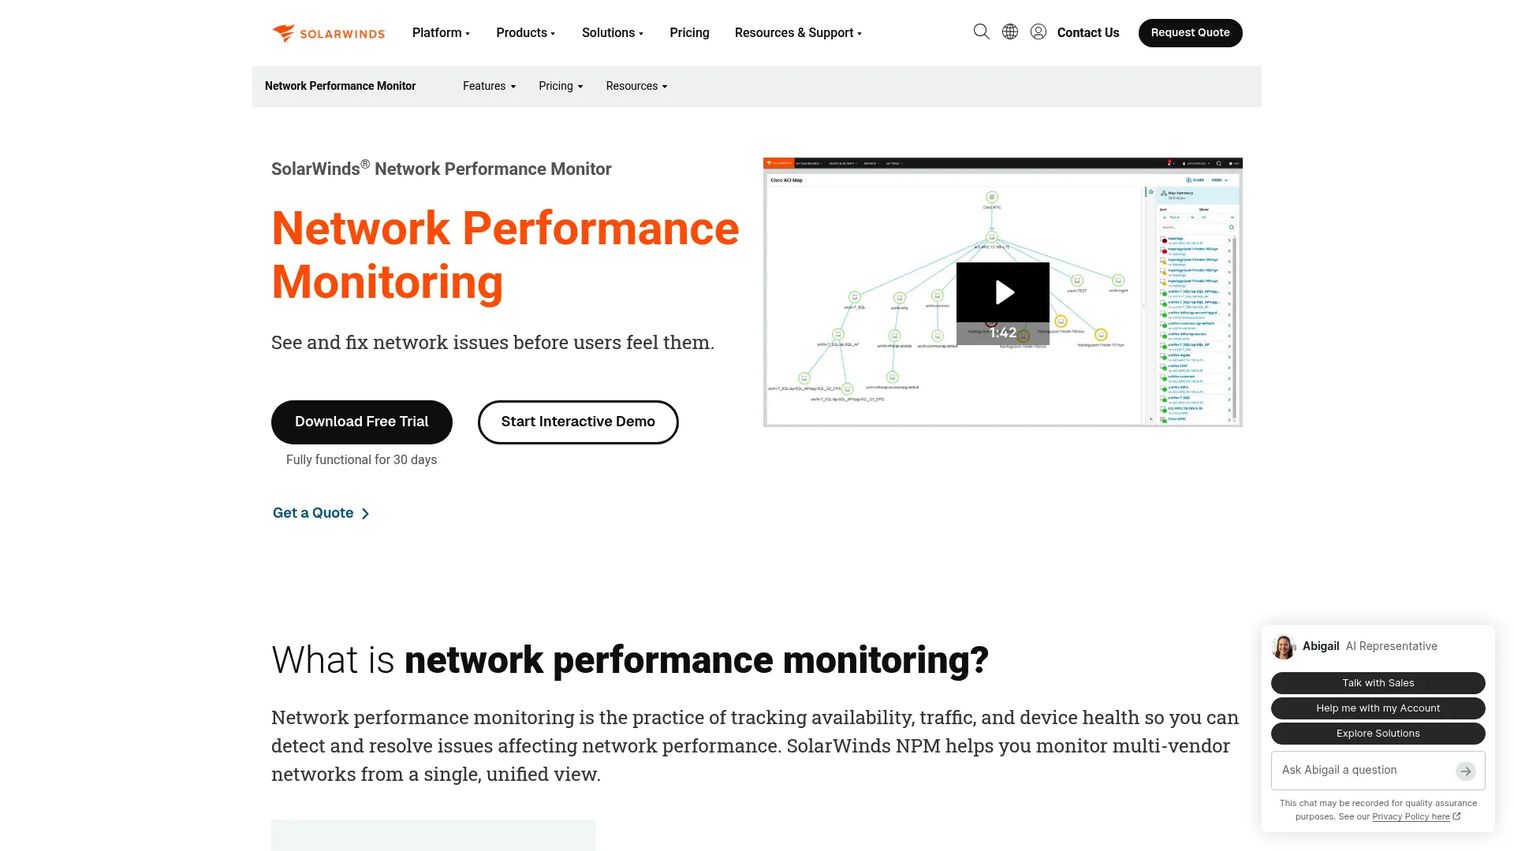
SolarWinds Network Performance Monitor is an enterprise-grade monitoring platform for detecting, diagnosing, and resolving network issues across on-premises, hybrid, and cloud environments. It covers multi-vendor device discovery, real-time and historical performance dashboards, and cross-stack performance correlation through its PerfStack view. NetPath provides hop-by-hop path analysis that shows exactly where a connection degrades.
Best for: IT and network operations teams managing complex multi-vendor enterprise networks.
Key features
- Automatic topology mapping with multi-vendor discovery
- NetPath hop-by-hop network path analysis
- PerfStack cross-stack performance correlation
- Customizable dashboards, charts, and capacity forecasting
- Intelligent alerting with customizable thresholds
Why choose SolarWinds Network Performance Monitor: It suits teams that need detailed network maps, troubleshooting workflows, and a mature enterprise feature set. The breadth of protocol and vendor support is hard to match in a single platform.
SolarWinds Network Performance Monitor pricing: Starts at $2,829. A fully functional 30-day trial is available.
2. Paessler PRTG
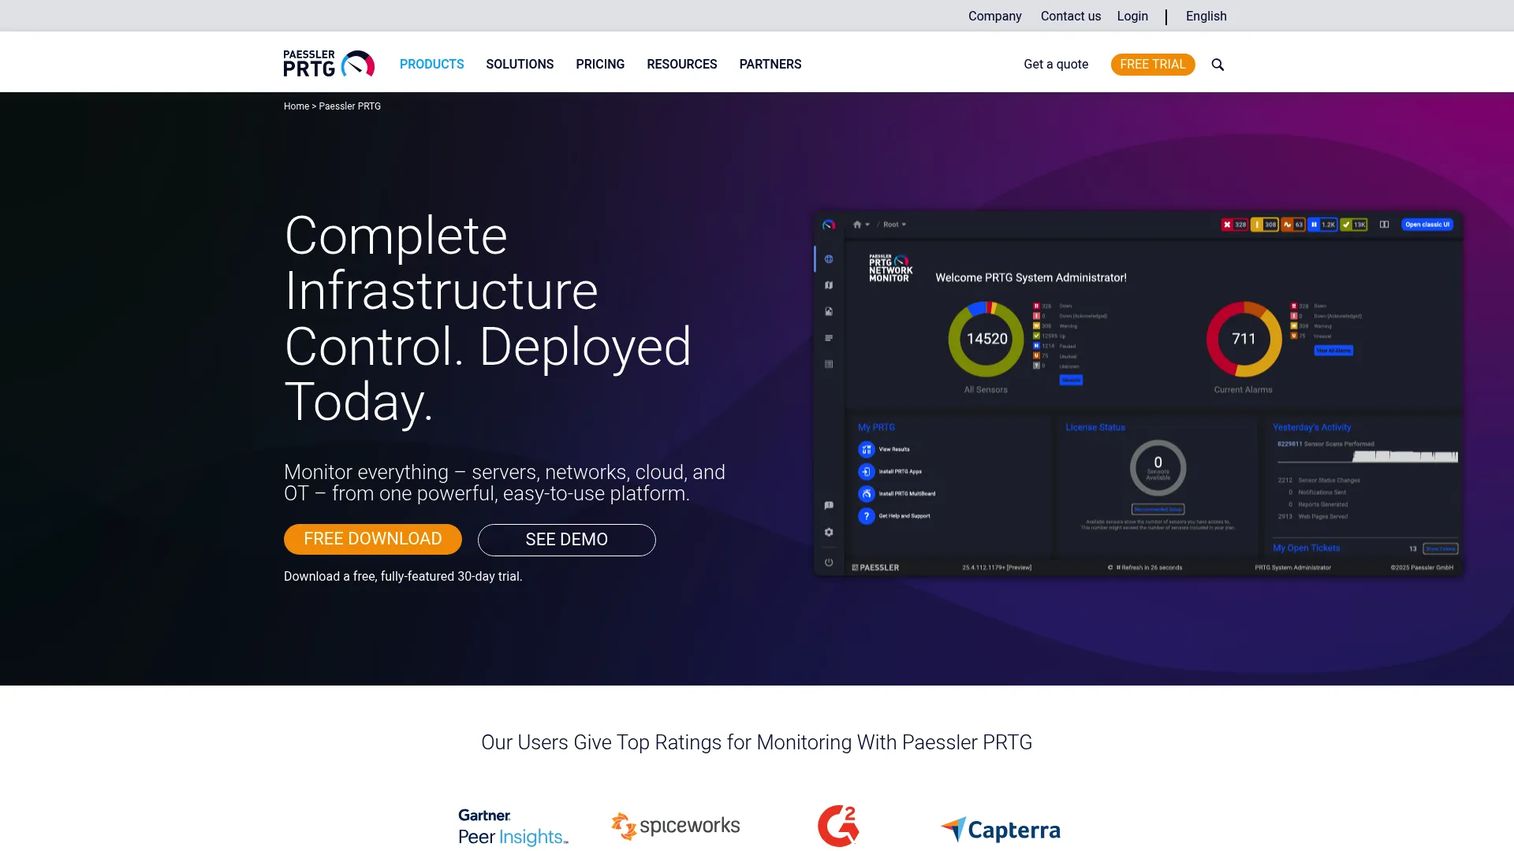
Paessler PRTG monitors networks, servers, applications, cloud services, and OT infrastructure through a sensor-based model. Each sensor monitors one specific data point: A bandwidth reading, a device status check, a ping result. Over 250 preconfigured sensors cover most environments out of the box. Remote probes extend coverage to distributed sites without opening firewall rules.
Best for: IT teams that want broad, customizable monitoring coverage with a predictable sensor-based license.
Key features
- 250+ preconfigured and customizable sensors
- Distributed monitoring via remote probes
- Real-time dashboards and network maps
- Custom alerts with multi-channel notifications
- Web, desktop, iOS, and Android interfaces
Why choose Paessler PRTG: It's a practical choice for teams that want quick coverage across devices, traffic, and applications without building an open-source stack from scratch. The sensor model makes it easy to understand exactly what you're paying for.
Paessler PRTG pricing: A Freeware Edition supports up to 100 sensors at no cost. Paid subscription tiers start at $200/month (PRTG 500, billed annually) and scale to $1,642/month for PRTG 10000. A 30-day trial with unrestricted sensors is also available.
G2 rating: 4.7/5
3. Zabbix
Zabbix is an open-source monitoring platform for networks, servers, cloud environments, containers, IoT devices, applications, and services. It supports both agent-based and agentless monitoring and includes a large template library for rapid onboarding of common devices. Synthetic monitoring covers web applications and APIs. Flexible alerting and auto-remediation support complex escalation scenarios.
Best for: Technical teams that want powerful open-source monitoring and can manage the initial configuration and ongoing maintenance.
Key features
- SNMP, WMI, agent, and agentless monitoring
- Auto-discovery with out-of-the-box templates
- Dashboards, maps, graphs, and PDF reporting
- Kubernetes monitoring and REST API integrations
- Flexible alerting with escalation and auto-remediation
Why choose Zabbix: The software carries no license fee, making it one of the most cost-effective options for teams with Linux or infrastructure expertise. A survey from Extreme Networks in 2025 found that 75% of IT leaders use three or more tools to manage their networks, and Zabbix often serves as the monitoring core that other tools feed.
Zabbix pricing: The Zabbix platform is free and open-source. Zabbix Cloud tiers start at $50/month for the Nano tier. Commercial support subscriptions start at EUR 245/month (Silver tier, billed annually). Platinum, Enterprise, and Global tiers use custom pricing.
G2 rating: 4.3/5
4. Nagios Core
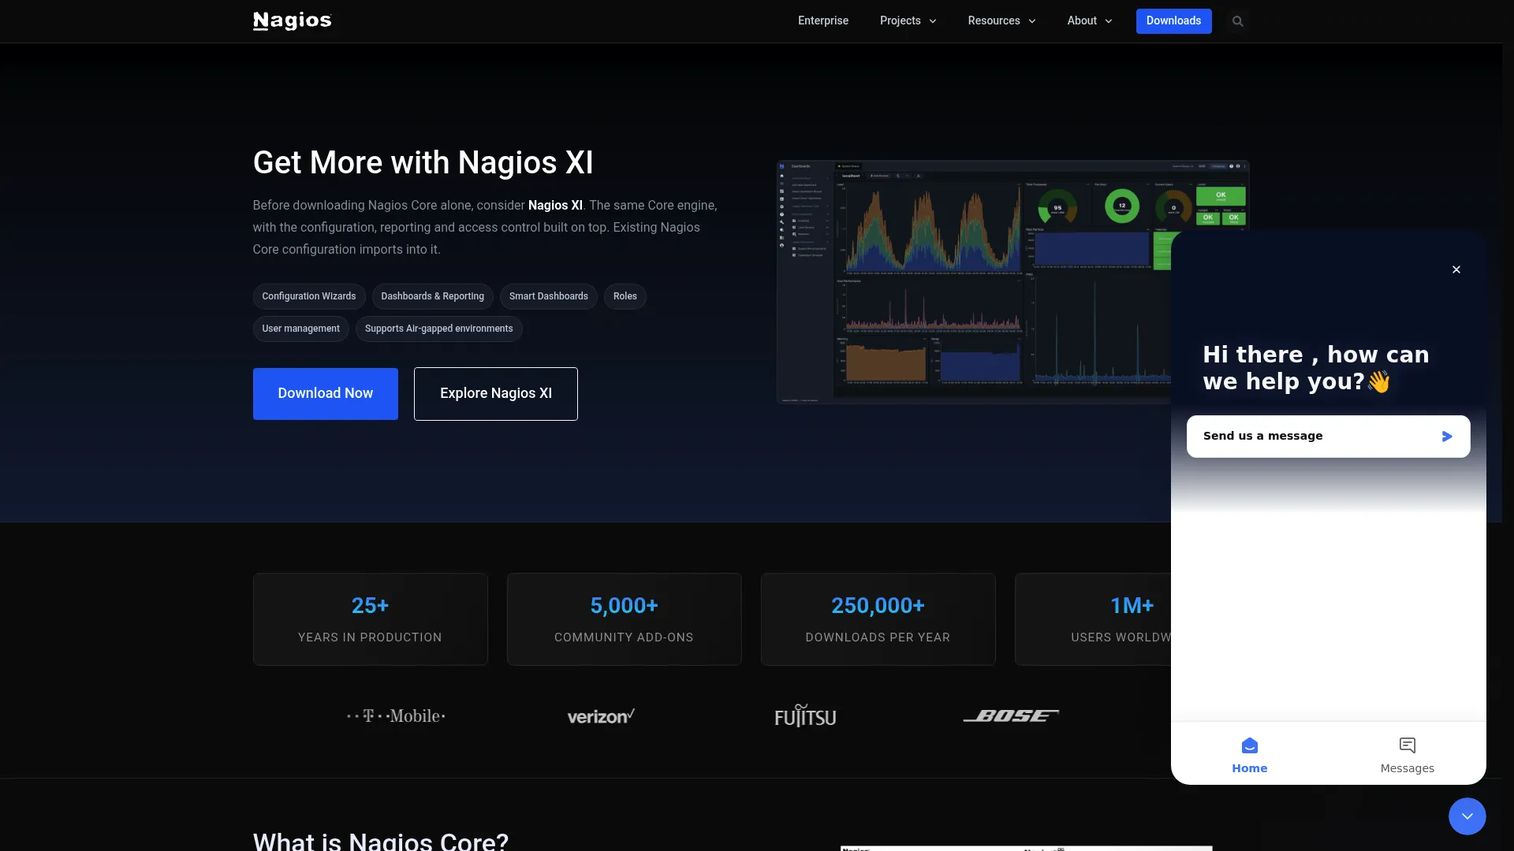
Nagios Core is the open-source monitoring engine that has powered IT infrastructure monitoring for over two decades. It uses a plugin architecture that lets admins define custom checks for hosts, services, applications, and network devices. Alerting, escalation, and dependency management are configurable through text-based files. There is no modern web UI in the core product.
Best for: Admins who want lightweight, extensible open-source monitoring and are comfortable with configuration-file management.
Key features
- Plugin-based host and service monitoring
- Alerting, notifications, and escalation rules
- Dependency and event handler configuration
- Community plugin library with hundreds of extensions
- Basic availability reporting
Why choose Nagios Core: It suits teams that value control over abstraction and prefer building their monitoring stack precisely to their requirements. The long track record means an extensive community knowledge base exists for almost every configuration challenge.
Nagios Core pricing: Free under the GPL. Commercial support and enterprise features are available through Nagios XI.
5. Nagios XI
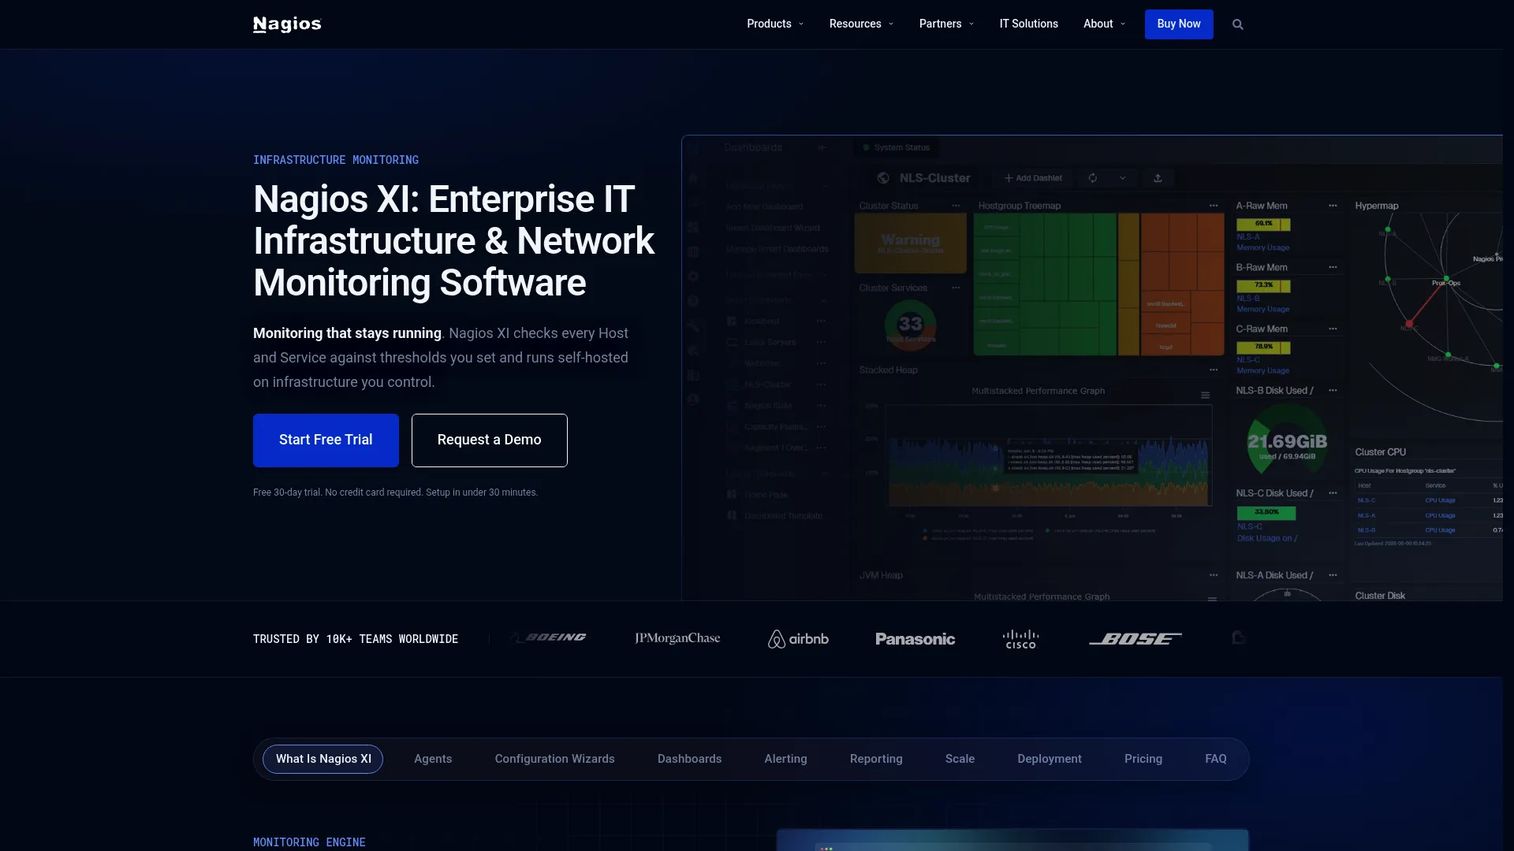
Nagios XI is the commercial version of Nagios, adding a web-based configuration interface, dashboards, reporting, capacity planning, and configuration wizards. It supports agent-based and agentless monitoring across Linux, Windows, macOS, AIX, and network devices. A REST API and configuration rollback are included.
Best for: Organizations that want Nagios-style extensibility packaged with enterprise UI, reporting, and commercial support.
Key features
- Web-based configuration wizards and auto-discovery
- Performance graphs, dashboards, and reporting
- Capacity planning with trend analysis
- REST API and configuration rollback
- Agent-based and agentless monitoring
Why choose Nagios XI: It fits teams that want the Nagios plugin ecosystem and community resources without relying entirely on manual file-based configuration. The perpetual license model avoids recurring subscription costs for stable environments.
Nagios XI pricing: Standard license starts at $2,595 for 100 nodes (perpetual). Enterprise starts at $4,690 for 100 nodes. A free license covers 7 nodes or 100 services, whichever comes first.
G2 rating: 4.5/5
6. Datadog Network Monitoring
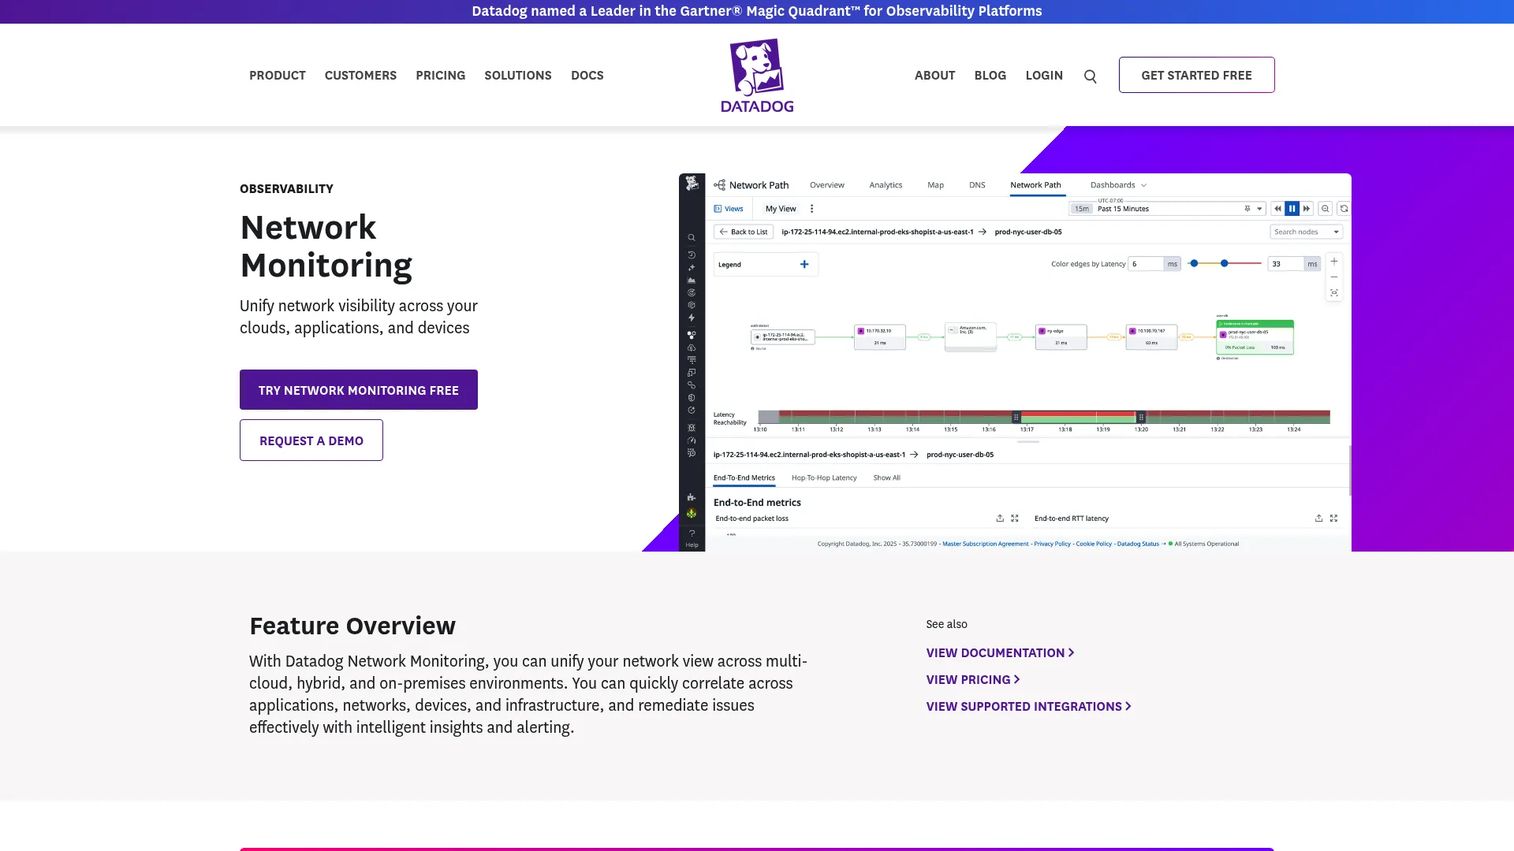
Datadog Network Monitoring delivers network visibility across cloud, hybrid, and on-premises environments within the Datadog observability platform. It covers service-to-service traffic, container networking, cloud network paths, and SNMP-based device monitoring. Network Device Monitoring adds autodiscovery, SNMP traps, NetFlow ingestion, and syslog collection. Network Path provides hop-by-hop route analysis with latency and packet-loss data.
Best for: DevOps, SRE, and network teams already invested in Datadog who want network data alongside application and infrastructure telemetry.
Key features
- Cloud Network Monitoring for service and container traffic
- Network Device Monitoring with SNMP, traps, and NetFlow
- Network Path with hop-by-hop latency and packet-loss insight
- Unified dashboards across network, application, and infrastructure data
- 14-day free trial available
Why choose Datadog Network Monitoring: The integration with the broader Datadog platform is its main advantage. Network events correlate directly with application traces, infrastructure metrics, and logs, which shortens the mean time to root cause for issues that cross multiple observability layers.
Datadog Network Monitoring pricing: Cloud Network Monitoring costs $5 per network host per month (annual). Network Device Monitoring costs $7 per device per month (annual). Network Path costs $5 per 1,000 tests per month (annual). Month-to-month and on-demand rates are higher.
G2 rating: 4.4/5
7. Netdata
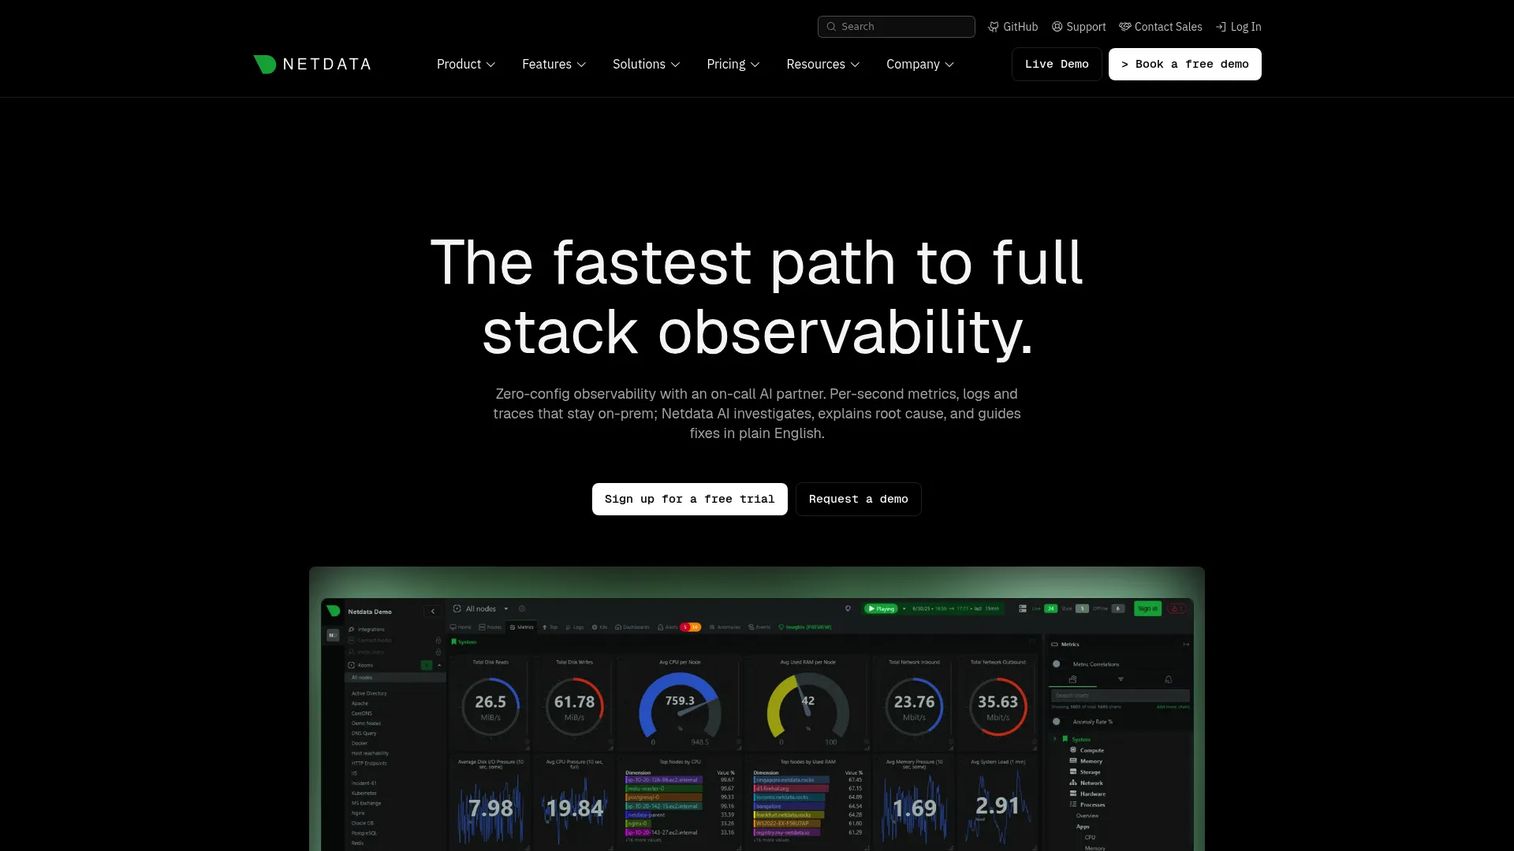
Netdata is a real-time observability platform focused on per-second infrastructure and application metrics, log correlation, and machine-learning anomaly detection. It runs as a lightweight agent on each node and collects hundreds of metrics automatically without manual configuration. Netdata AI assists with troubleshooting investigations and generates automated diagnostic reports.
Best for: Operations, DevOps, and SRE teams that need fast, granular infrastructure diagnostics and automated anomaly detection.
Key features
- Per-second real-time metrics with auto-discovered charts
- Machine-learning anomaly detection across all metrics
- AI-powered troubleshooting and investigation reports
- Distributed architecture with local data retention
- Cloud and self-hosted deployment options
Why choose Netdata: The per-second resolution and automated anomaly detection make it particularly effective during active incidents. When a problem is occurring right now, Netdata's granularity is useful in a way that lower-resolution polling tools are not.
Netdata pricing: Community tier is free and supports up to 5 active connected nodes. Business tier costs $4.50 per node per month (billed annually) and includes unlimited metrics, custom dashboards, unlimited retention, Netdata AI, RBAC, SSO, and SCIM.
G2 rating: 4.6/5
8. Kentik
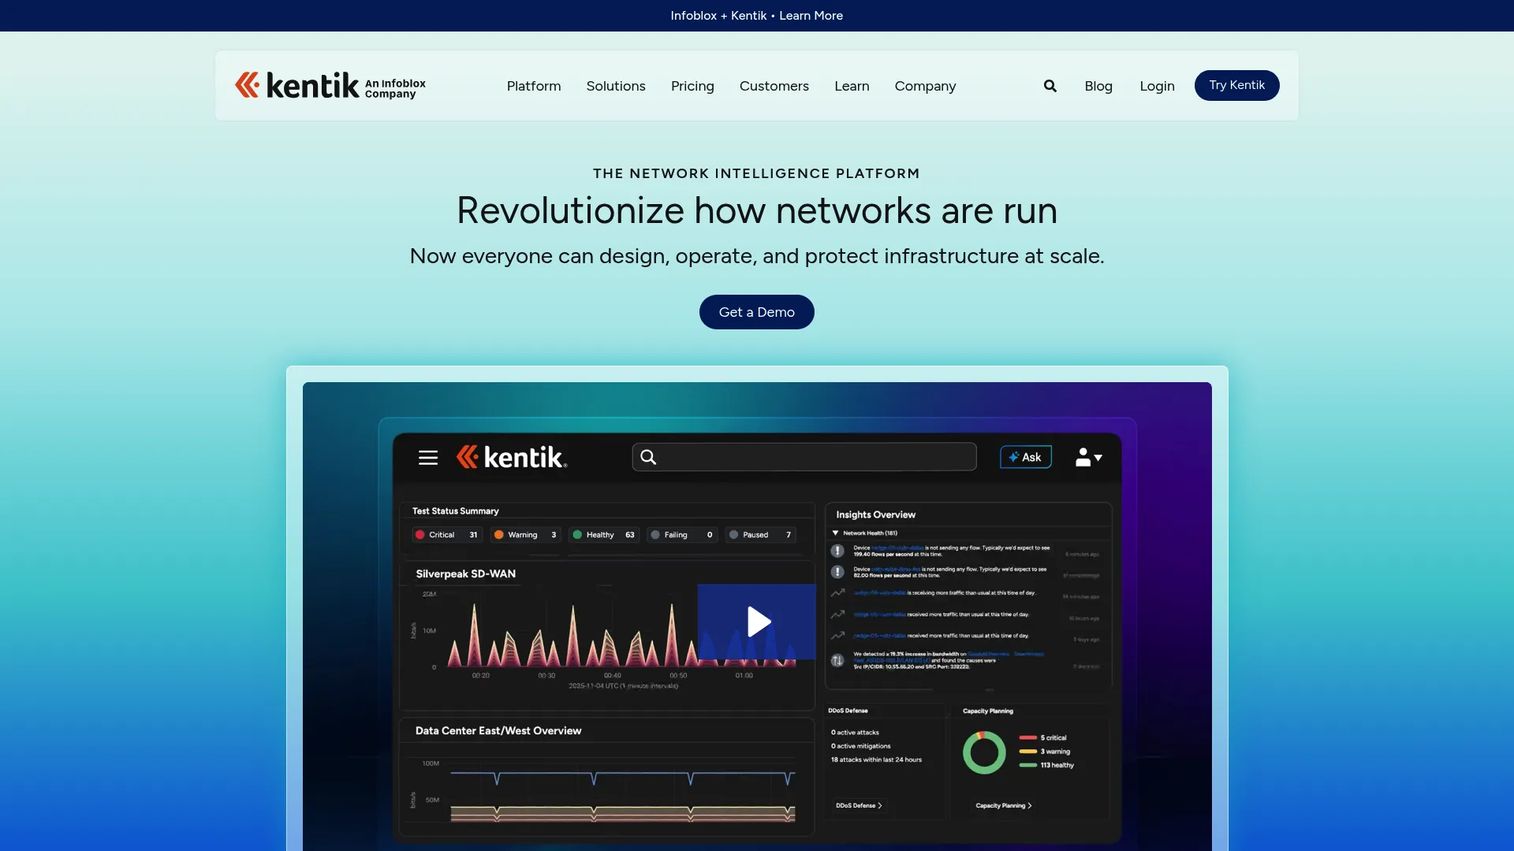
Kentik is a network intelligence and observability platform for traffic analysis, routing visibility, cloud networking, and security monitoring. It ingests flow data at scale and provides an AI-assisted investigation layer for root-cause analysis across complex hybrid and multi-cloud networks. BGP monitoring and DDoS detection capabilities address service-provider and large-enterprise use cases.
Best for: Network teams, service providers, and large enterprises where traffic engineering, internet path performance, and flow analytics matter as much as device uptime.
Key features
- Unified network telemetry and traffic analysis
- BGP monitoring with routing visibility
- Multi-cloud observability and connectivity troubleshooting
- SNMP and streaming telemetry for network device monitoring
- DDoS detection and mitigation capabilities
Why choose Kentik: It fits teams where the question is not just "is the device up?" but "where is the traffic going, how is it behaving, and why did that path change?" The AI Advisor layer makes large-scale investigations more manageable.
Kentik pricing: A 30-day free trial is available. Pro edition starts at $2,000 per month billed annually. Premier edition pricing requires contacting Kentik directly.
G2 rating: 4.8/5
9. LogicMonitor
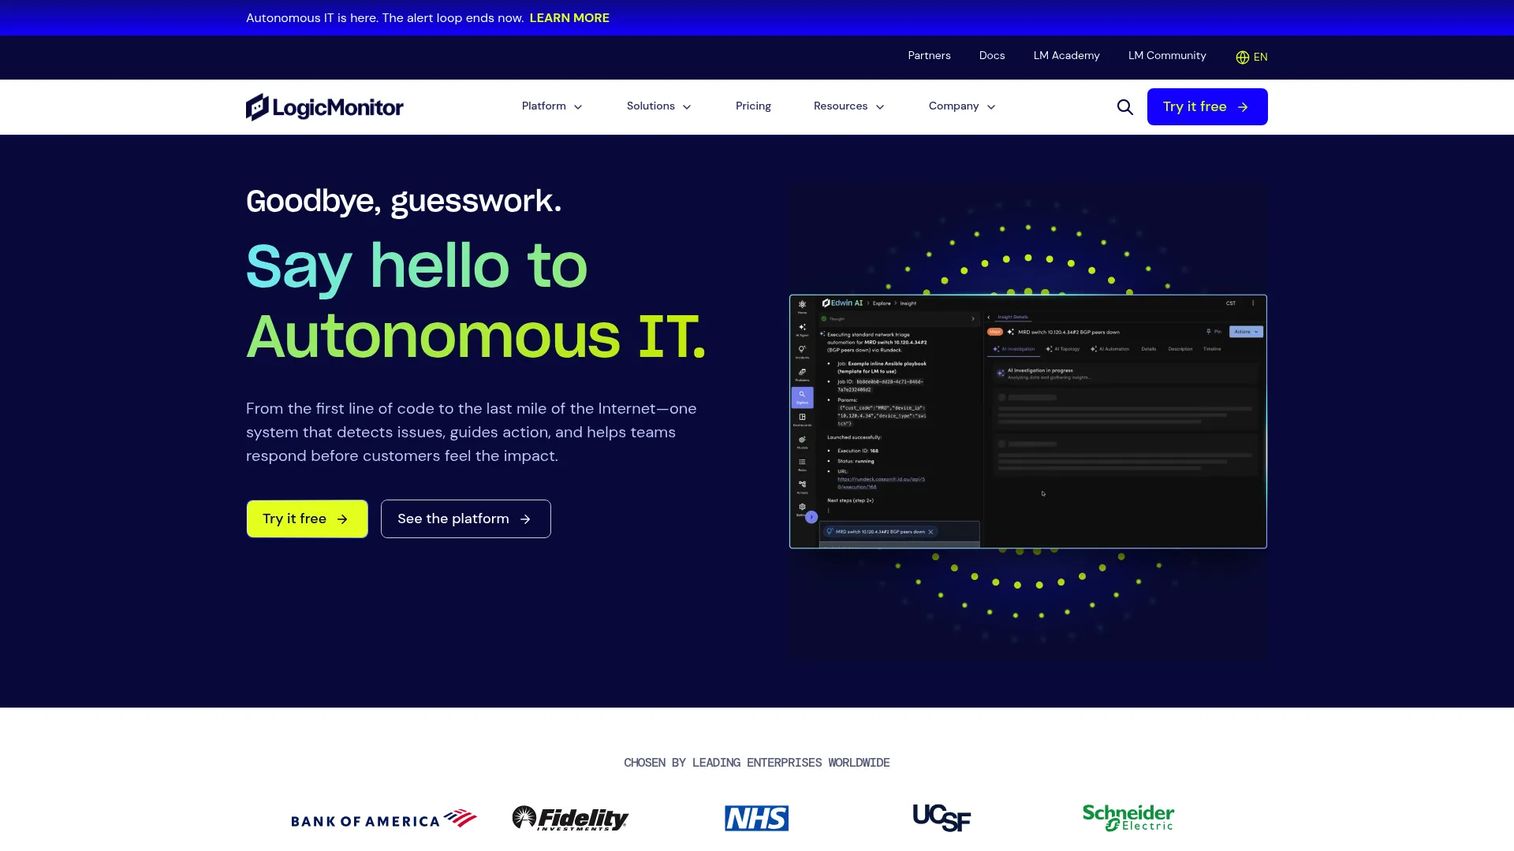
LogicMonitor is a SaaS observability platform for networks, cloud environments, applications, logs, and digital experience monitoring. It uses automated discovery, dynamic thresholds, and over 3,000 integrations to reduce manual configuration. AIOps features handle anomaly detection, event correlation, root-cause analysis, and automated remediation. A 15-day free trial is available.
Best for: Mid-market and enterprise IT operations, SRE, and managed service teams that want SaaS-delivered hybrid infrastructure monitoring without managing the monitoring server.
Key features
- Automated discovery across hybrid infrastructure
- Dynamic thresholds and alert routing
- AIOps with anomaly detection and automated remediation
- 3,000+ integrations and customizable dashboards
- Forecasting and capacity planning
Why choose LogicMonitor: The SaaS deployment removes the operational burden of maintaining a monitoring platform. Teams that have struggled with scaling self-hosted tools find the managed model removes a class of ongoing work.
LogicMonitor pricing: LM Essentials starts at $16 per Hybrid Unit per month. LM Advanced starts at $27 per Hybrid Unit per month. LM Signature with Edwin AI starts at $53 per Hybrid Unit per month. A 15-day free trial is available.
G2 rating: 4.5/5
10. LibreNMS
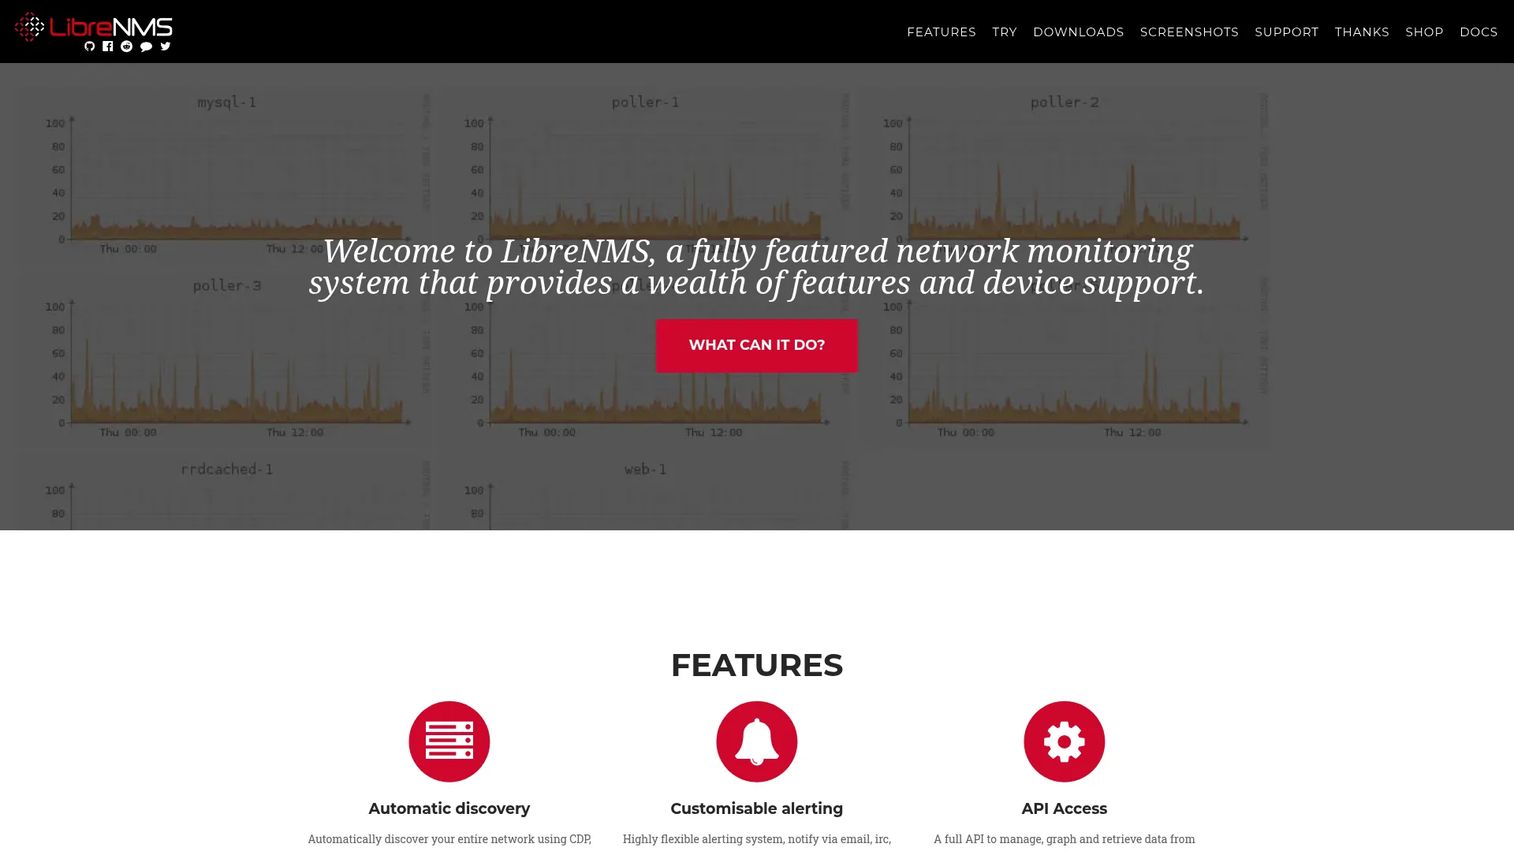
LibreNMS is an open-source network monitoring system with automatic discovery, SNMP monitoring, and broad device support driven by an active community. It supports NetFlow, sFlow, and IPFIX for traffic analysis alongside SNMP-based device health monitoring. A mobile-friendly web interface and API access are included. Distributed polling handles larger environments.
Best for: Organizations that want a free, community-maintained SNMP monitoring platform with broad device coverage and automatic discovery.
Key features
- SNMP auto-discovery with broad vendor device support
- NetFlow, sFlow, and IPFIX traffic analysis
- Customizable alerting with multi-channel notifications
- Distributed polling and API access
- Mobile-friendly web interface with two-factor authentication
Why choose LibreNMS: For teams that need solid SNMP monitoring without a license budget, LibreNMS covers a wide range of devices and protocols. The hosting, maintenance, and setup time represent the real cost to model.
LibreNMS pricing: Free and open-source. The cost driver is hosting infrastructure and the staff time to deploy and maintain it.
G2 rating: 4.6/5
11. OpenNMS
OpenNMS is an open-source network monitoring platform with community (Horizon) and enterprise (Meridian) editions. It handles fault management, performance data collection, network traffic analysis, and alarm correlation. Distributed monitoring via Minion supports large and distributed environments. The ALEC engine correlates related alarms to reduce alert noise.
Best for: Enterprise organizations that need scalable open-source monitoring with a supported commercial path.
Key features
- Network discovery and fault management
- NetFlow, IPFIX, and sFlow traffic analysis
- Distributed monitoring with Minion
- Alarm correlation using ALEC
- REST API and workflow integrations
Why choose OpenNMS: It suits technical teams that want open-source roots and the option to move to a commercially supported Meridian edition as their environment grows and support requirements increase.
OpenNMS pricing: Horizon is free. Meridian Basic costs $6,000/year. Standard costs $12,000/year. Essential costs $49,000/year. Premier costs $66,000/year. Premier+ pricing requires contacting OpenNMS directly.
G2 rating: 4.1/5
12. Icinga
Icinga is an open-source monitoring platform for servers, networks, applications, containers, and Kubernetes. It supports distributed and highly available monitoring with clustering and failover. Configuration management through Git-based workflows and infrastructure-as-code tools suits teams that treat monitoring configuration the same as application code.
Best for: Technical teams that need an extensible, highly configurable open-source monitoring stack with modern infrastructure-as-code support.
Key features
- Host, service, and network monitoring with plugin compatibility
- Distributed and highly available monitoring
- Git-based and infrastructure-as-code configuration workflows
- REST API and integrations with DevOps and ITSM tools
- Icinga Director for rule-based configuration management
Why choose Icinga: It fits infrastructure teams that want monitoring configuration to live alongside their other infrastructure definitions, with proper versioning and review workflows rather than GUI-based changes.
Icinga pricing: The Forever Free Edition is open-source with no host or service limits. Repository Subscription costs 5,000 EUR/year (annual). Module Subscription costs 2,000 EUR/year. Support Subscription starts at 15,000 EUR/year.
G2 rating: 4.4/5
13. Cacti
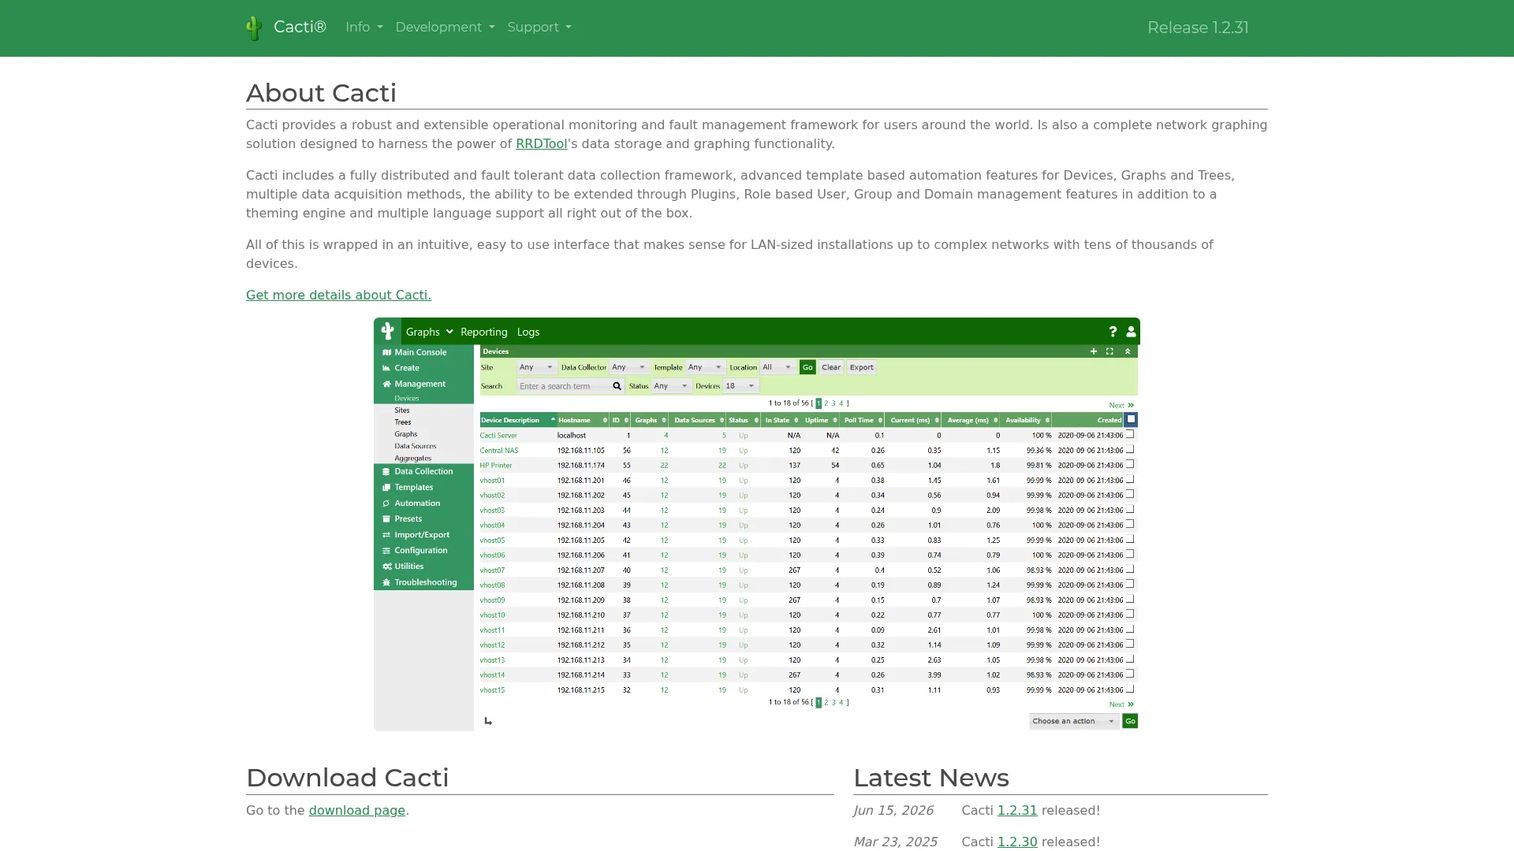
Cacti is an open-source graphing and performance monitoring framework built on RRDTool. It collects SNMP and custom data from network devices and renders long-term performance graphs. The plugin architecture adds alerting, device tracking, and router configuration backup capabilities. Distributed remote data collectors handle larger environments with offline caching support.
Best for: Organizations that need self-hosted, long-term bandwidth trend graphing and are comfortable managing an open-source stack.
Key features
- RRDTool-based graphing with templates and aggregation
- SNMP, ICMP, TCP, and UDP data collection
- Automated device discovery and graph creation
- Plugin architecture for alerting and dashboards
- Distributed remote data collectors
Why choose Cacti: It excels at one specific job: Rendering readable, long-term network performance graphs from SNMP data. For teams that need historical trending more than real-time alerting, Cacti covers that job without the overhead of a full monitoring platform.
Cacti pricing: Free under the GNU General Public License. The cost is hosting, maintenance, and setup time.
14. Progress WhatsUp Gold
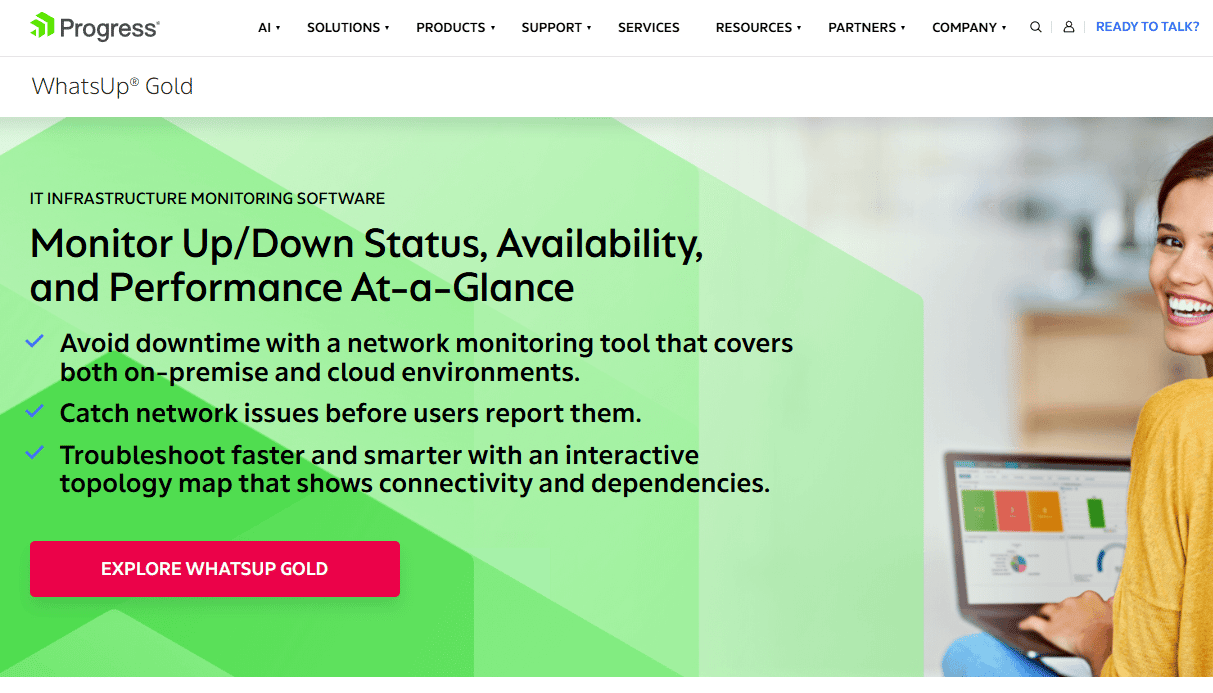
Progress WhatsUp Gold is a network monitoring platform from Progress that covers device discovery, interactive topology mapping, performance monitoring, traffic analysis, configuration management, and log management. It targets IT teams that want full-featured network visibility without assembling multiple separate tools. The interactive maps update in real time as device states change.
Best for: SMB and mid-market IT teams that want approachable, full-featured network monitoring with discovery and mapping included.
Key features
- Network discovery and interactive topology mapping
- Availability and performance monitoring for devices, cloud, and virtual infrastructure
- Network traffic analysis and bandwidth reporting
- Configuration management and log management
- Dashboards, alerting, and reporting
Why choose Progress WhatsUp Gold: It suits teams that do not have the resources or appetite for open-source configuration work and want a commercial product that covers discovery, mapping, alerts, and reporting in a single installation.
Progress WhatsUp Gold pricing: Contact Progress directly for current pricing. A free trial is typically available.
G2 rating: 4.4/5
15. Site24x7 Network Monitoring
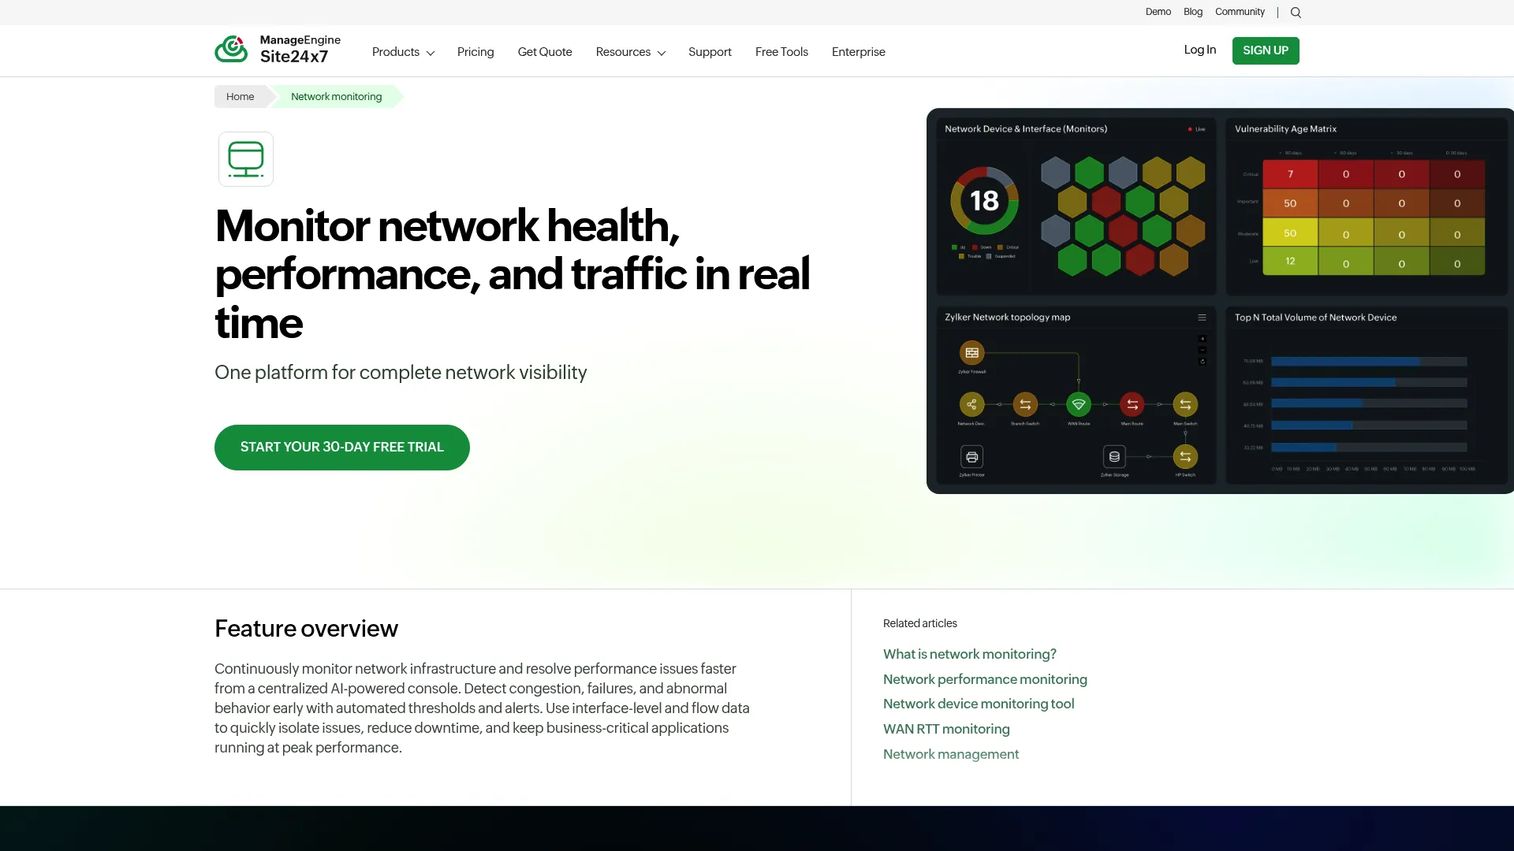
Site24x7 Network Monitoring is a cloud-hosted monitoring platform for routers, switches, firewalls, and wireless controllers alongside broader IT infrastructure. It handles SNMP-based device monitoring, traffic analysis via NetFlow, J-Flow, sFlow, and IPFIX, topology mapping, and SNMP trap alerting. Because the monitoring infrastructure is cloud-hosted, teams do not need to manage a monitoring server.
Best for: IT teams managing distributed or branch-heavy networks who want cloud-hosted monitoring without maintaining a local monitoring instance.
Key features
- SNMP monitoring for routers, switches, firewalls, and wireless controllers
- Traffic analysis via NetFlow, J-Flow, sFlow, IPFIX, and AppFlow
- Topology maps, Layer 2 maps, and customizable dashboards
- SNMP trap alerts and multi-channel notifications
- Network performance reports and configuration tracking
Why choose Site24x7 Network Monitoring: The cloud-hosted model means the monitoring platform itself is not a maintenance burden. Teams managing many distributed sites find the centralized cloud visibility useful without the complexity of a self-hosted distributed monitoring stack.
Site24x7 Network Monitoring pricing: All-in-one plans include network monitoring. All-in-one Lite starts at $10/month ($9/month billed annually). All-in-one Professional starts at $49/month ($42/month billed annually). All-in-one Enterprise starts at $625/month billed annually.
G2 rating: 4.6/5
16. Microsoft Azure
Microsoft Azure provides native network monitoring capabilities for teams running workloads in Azure. Azure Monitor collects telemetry across Azure resources. Network Watcher adds connection monitoring, flow logs, VPN diagnostics, and network topology visualization for Azure networking components. Network insights and traffic analytics surface bandwidth utilization and anomalous traffic patterns.
Best for: Teams running Azure-heavy environments who want native network visibility without adding an external monitoring tool.
Key features
- Azure Monitor integration for resource and network telemetry
- Network Watcher with connection monitoring and VPN diagnostics
- Flow logs and traffic analytics
- Network topology visualization for Azure resources
- Native integration with Azure alerts and dashboards
Why choose Microsoft Azure: For teams whose networks live largely in Azure, native monitoring is the natural starting point. Adding an external tool makes sense when on-premises or multi-cloud coverage is also required.
Microsoft Azure pricing: Azure uses consumption-based pricing. A free account includes 65+ always-free services, a 30-day $200 credit, and 12 months of free access to selected services.
G2 rating: 4.4/5
17. Wireshark
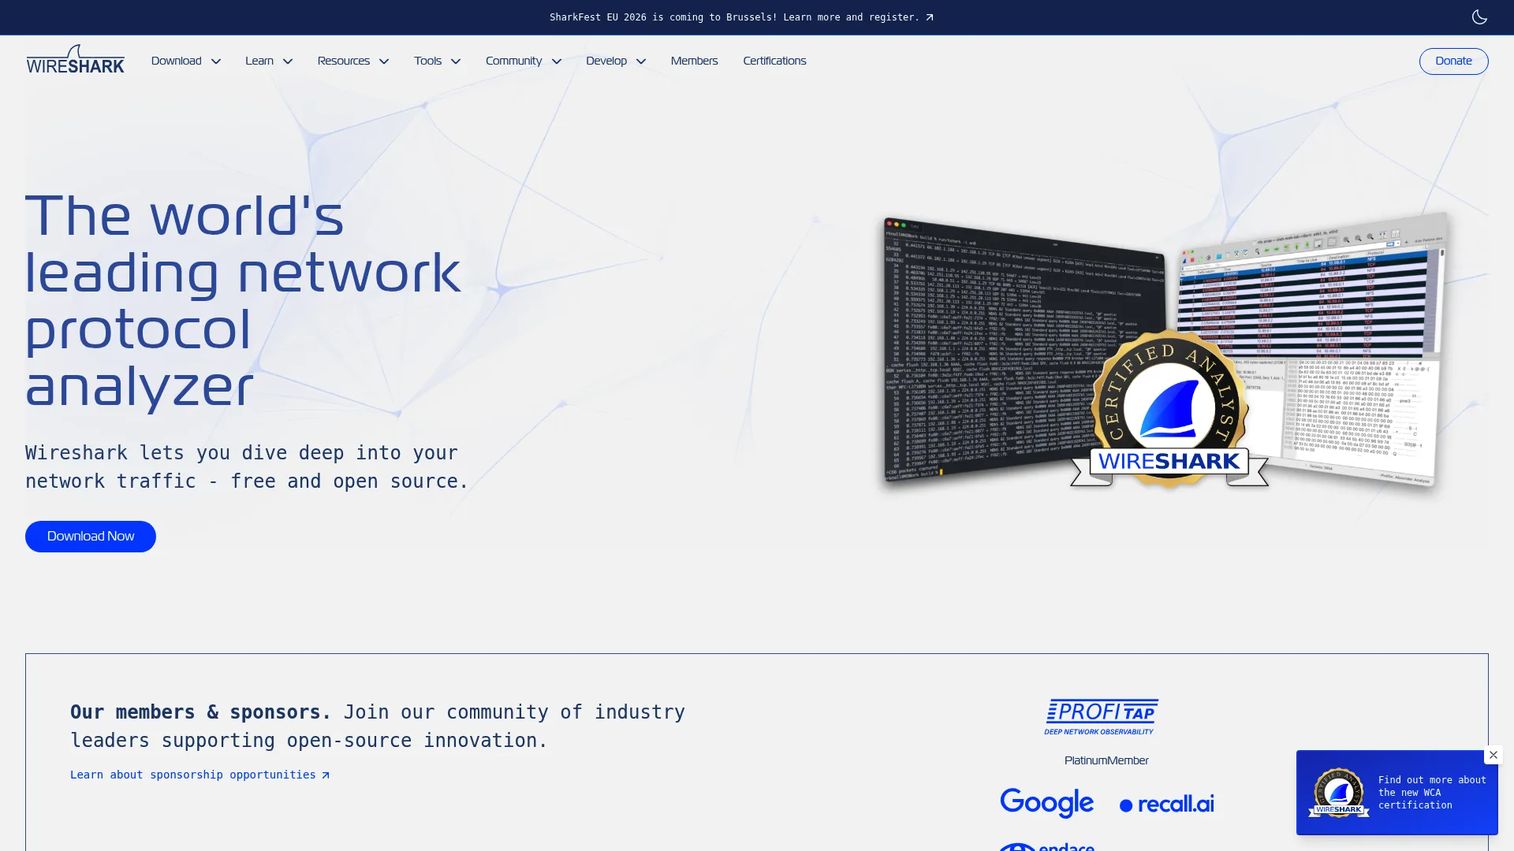
Wireshark is a free, open-source network protocol analyzer for capturing and examining network traffic at the packet level. It decodes hundreds of protocols and lets engineers filter, follow, and reconstruct conversations from captured data. It is not a network management system or monitoring platform. Engineers reach for it when dashboards show something is wrong but cannot explain why.
Best for: Network engineers and security analysts doing packet-level troubleshooting and protocol analysis.
Key features
- Live packet capture and offline trace file analysis
- Deep inspection of hundreds of protocols
- Powerful display and capture filters
- Follow stream for TCP, UDP, and other conversations
- Export and statistics tools for traffic summaries
Why choose Wireshark: It provides proof at the packet level. When a routing issue, a TLS failure, or a slow application response cannot be explained by SNMP or flow data alone, Wireshark shows exactly what traversed the wire and where the problem occurred.
Wireshark pricing: Free under the GNU General Public License version 2.
G2 rating: 4.7/5
18. Splunk

Splunk is a data analytics and security platform for searching, correlating, and acting on machine data across networks, infrastructure, and security systems. It ingests logs, events, metrics, and telemetry from nearly any source. Dashboards, alerting, and the Splunk Processing Language power investigation and operational analytics workflows. Enterprise Security adds SIEM, SOAR, and threat intelligence capabilities.
Best for: Enterprise teams that need log correlation and analytics across network, infrastructure, and security data at scale.
Key features
- Log ingestion and correlation across any data source
- SPL-powered search, investigation, and reporting
- Real-time alerting and dashboards
- SIEM and SOAR capabilities in Enterprise Security edition
- Integration with network devices, cloud services, and security tools
Why choose Splunk: It fits environments where network events need to correlate with application, security, and infrastructure signals to understand the full scope of an incident. The investment in Splunk Search is high, but the analytical flexibility is broad.
Splunk pricing: The Cloud Platform, Splunk Enterprise, and Enterprise Security products use ingest-based, workload-based, or entity-based pricing that requires a quote. Some add-on products have published starting prices: Splunk On-Call starts at $5 per user per month (annual).
G2 rating: 4.4/5
19. IBM QRadar
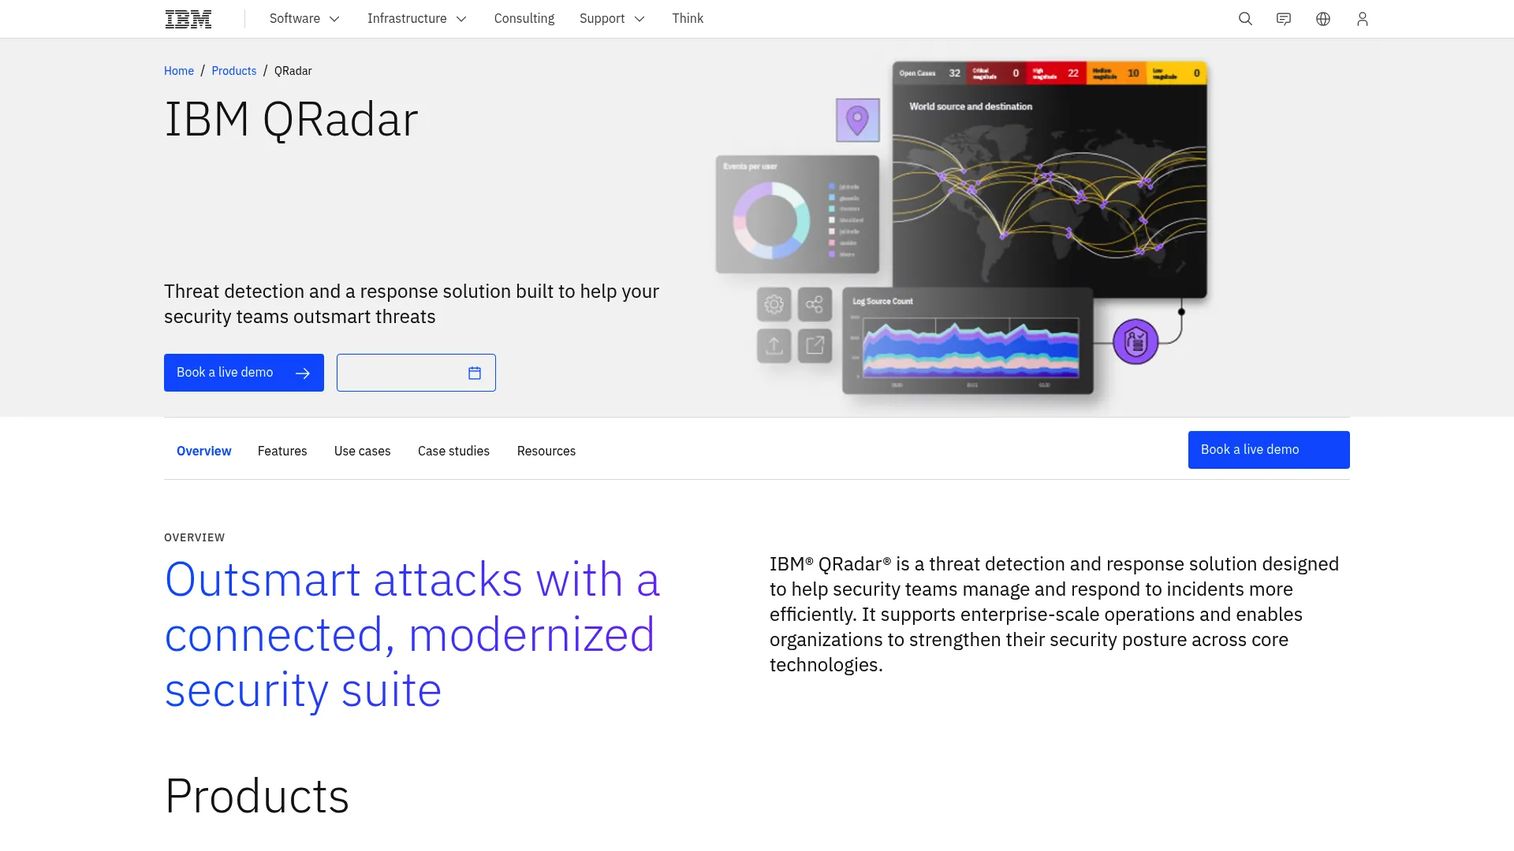
IBM QRadar is a SIEM and security analytics platform for threat detection, network behavior monitoring, log management, and incident response. It correlates security events from network devices, endpoint systems, and cloud environments using AI-driven prioritization. Network flow analysis adds visibility into traffic patterns and potential lateral movement.
Best for: Enterprise security and SOC teams that need SIEM correlation for network events alongside broader security telemetry.
Key features
- AI-driven security event correlation and threat prioritization
- Network flow analysis and user behavior monitoring
- Real-time threat intelligence integration
- Log management and compliance reporting
- Incident response orchestration
Why choose IBM QRadar: It belongs in the stack when network visibility is part of a broader SOC, compliance, and incident-response workflow. The strength is event correlation across many data sources, not point-in-time device monitoring.
IBM QRadar pricing: QRadar uses Events per Second/Flows per Minute or Managed Virtual Servers licensing models, with subscription and perpetual options. IBM does not display numeric prices publicly; contact IBM or an IBM partner for a quote.
G2 rating: 4.4/5
20. Nmap
Nmap is a free, open-source network discovery and security auditing utility. It identifies live hosts, open ports, running services, operating systems, and firewall configurations through active scanning. The Nmap Scripting Engine extends its detection and auditing capabilities. Nmap is a point tool, not a monitoring platform, but it complements monitoring systems by providing discovery and inventory data on demand.
Best for: IT administrators, network engineers, and security professionals performing network discovery, asset inventory, and scanning.
Key features
- Host discovery and network mapping
- TCP and UDP port scanning
- Service and version detection
- Operating system fingerprinting
- Nmap Scripting Engine for extensible scans
Why choose Nmap: It's the fastest way to answer the question "what is on this network?" without running a full monitoring platform. Teams use it for initial discovery, security audits, compliance checks, and verifying firewall rules.
Nmap pricing: Free for end users. OEM redistribution licenses for software vendors start at $59,980 (perpetual, small/startup company).
21. Suricata

Suricata is an open-source intrusion detection and prevention engine developed by the Open Information Security Foundation. It inspects network traffic at multi-gigabit speeds using a multithreaded architecture and rule-based detection. Beyond IDS/IPS, it provides network security monitoring through HTTP, DNS, and TLS logging, automatic protocol detection, and Eve JSON output for integration with log management and SIEM platforms.
Best for: Security teams that need an open-source IDS/IPS engine and network security monitoring layer.
Key features
- Network IDS and IPS engine with rule-based detection
- HTTP, DNS, and TLS logging and protocol analysis
- Multi-gigabit, multithreaded traffic inspection
- Eve JSON output for SIEM and log platform integration
- Lua scripting for custom detection logic
Why choose Suricata: It adds a dedicated threat-detection layer to network monitoring stacks that are strong on device health but weak on traffic inspection and behavioral detection. The Eve JSON format makes integration with Splunk, Elasticsearch, or QRadar straightforward.
Suricata pricing: Free and open-source under GPLv2. Practical cost drivers are hardware or cloud compute for packet processing, analyst time for rule tuning, and integration work with downstream platforms.
Considerations when choosing network management tools
Match the tool to the network you actually run
Device count, cloud footprint, branch count, remote workers, and vendor diversity all shape what you need. A 50-device on-premises network has completely different requirements from a 5,000-node hybrid environment spanning multiple cloud regions and branch offices. Start with an honest inventory before evaluating any tool.
Check protocol and telemetry coverage
SNMP, traps, NetFlow, sFlow, IPFIX, WMI, logs, packet capture, API telemetry, and cloud-native metrics each cover different failure modes. A monitoring program that only polls SNMP misses the class of problems visible only in flow data or packet traces. Map your environment's telemetry needs before comparing tools.
Understand pricing shape before you scale
Sensor-based, per-device, per-node, per-host, flow-volume, ingest-based, and quote-based models all behave differently at scale. Model the cost at your current size and at one year of growth. A tool that looks affordable at 200 devices may become expensive at 800. The gap between sensor-based and per-ingest models is especially wide in fast-growing environments.
Evaluate alert quality, not alert volume
A monitoring system that generates 500 undifferentiated alerts is operationally worse than one that surfaces 10 actionable ones. Evaluate baseline support, dependency-aware alerting, deduplication, escalation routing, and maintenance window handling before committing to a platform.
Decide who owns the tool
Network Ops, IT Ops, SecOps, DevOps, and MSP teams have different workflows, different integration requirements, and different standards for what "configured correctly" means. Mismatched ownership creates tools that no one maintains. Clarify who configures, who monitors, and who responds before choosing between open-source and SaaS options.
Conclusion
The network management software market covers a wide range of operating models. The right shortlist depends on what you're monitoring, who manages the tool, and how your environment is likely to grow.
For mature enterprise operations, SolarWinds Network Performance Monitor or LogicMonitor provide depth and breadth. PRTG, WhatsUp Gold, and Site24x7 give teams a faster commercial path with less configuration overhead. When license cost is the primary constraint, Zabbix, LibreNMS, OpenNMS, Icinga, or Cacti cover most monitoring needs without platform fees.
For cloud-native environments, Datadog Network Monitoring and Azure's native tooling integrate directly with the infrastructure they monitor. Kentik and Netdata address traffic engineering and high-resolution diagnostics. Wireshark, Nmap, Suricata, Splunk, and IBM QRadar add the security and packet-level visibility layer that general-purpose monitoring tools typically omit.
The most effective approach: Shortlist three tools that fit your operating model, deploy them against the same devices, and compare alert quality over one week of real traffic. Feature counts on paper tell you far less than alert accuracy in production.
FAQs
Network management tools handle device discovery, uptime monitoring, bandwidth analysis, configuration tracking, topology mapping, and alerting. Security-oriented tools add intrusion detection, log correlation, and SIEM workflows. The goal in every case is visibility into what the network is doing, what changed, and what needs attention.
Network monitoring tracks the status and performance of devices and connections in real time. Network management is the broader category that includes monitoring plus configuration management, topology documentation, IP address management, change tracking, compliance reporting, and operational workflows. Monitoring answers "what is happening now?" Management answers "what changed, who changed it, and what does the full picture look like?"
Small teams with a limited budget and simple on-premises environments generally find PRTG's Freeware Edition (up to 100 sensors), LibreNMS, or Site24x7's entry-level plans workable. Teams that want something commercial and approachable without a large configuration investment tend toward WhatsUp Gold or Site24x7. The answer depends on how many devices you're monitoring and whether you have staff comfortable managing Linux-based open-source tools.
Zabbix, Nagios Core, LibreNMS, Icinga, and Cacti are all free and open-source network monitoring programs. Wireshark, Nmap, and Suricata are free utilities for specific jobs (packet capture, discovery, and intrusion detection). The distinction that matters: Free software is not cost-free. Setup, maintenance, hosting, and staff time are real costs that should factor into any open-source evaluation.
Most traditional network monitoring tools support SNMP. SNMP polling retrieves device metrics on a schedule, while SNMP traps send alerts to the monitoring system when a specific event occurs. SNMP support covers interface statistics, hardware health, CPU and memory utilization, and vendor-specific MIB data. SNMP alone does not show traffic flows or packet-level details, which is why most environments pair SNMP with NetFlow or sFlow collection.
SNMP shows device and interface status by polling counters on a schedule. NetFlow (Cisco) and IPFIX (the IETF-standardized version) export summaries of traffic flows from network devices, showing source, destination, protocol, and byte counts. sFlow samples traffic packets and exports both header data and counter information at a configurable rate. Wireshark and similar tools capture raw packets for full protocol inspection. Each telemetry type reveals different aspects of network behavior, and most enterprise monitoring stacks combine several.
Model the cost at your current device count and at your expected count in 12 months. Sensor-based tools (like PRTG) charge per data point monitored. Per-device or per-node tools charge per discovered asset. Ingest-based tools (like Splunk) charge per volume of data processed. Open-source tools have zero license cost but carry real hosting, maintenance, and labor costs. Getting a price for your specific environment requires more than reading a starting price, especially for quote-based tools like Kentik, IBM QRadar, and SolarWinds NPM.
Security tools like Suricata, Splunk, and IBM QRadar add threat detection and log correlation, but they do not replace uptime monitoring, topology mapping, bandwidth trending, and configuration management. Most mature teams run a general-purpose network monitoring system alongside security-focused tools. The monitoring system tells you a device is down or a link is saturated. The security tool tells you whether that anomaly looks like an attack.