How to filter apps by the Charts/Graphs use case in the Confluence Marketplace
Here is how to filter apps by the charts/graphs use case in the confluence marketplace
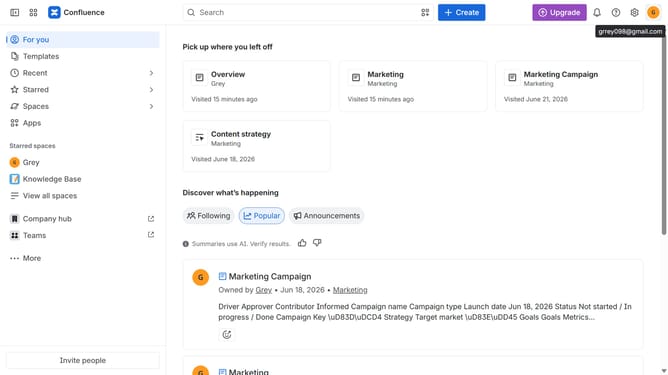
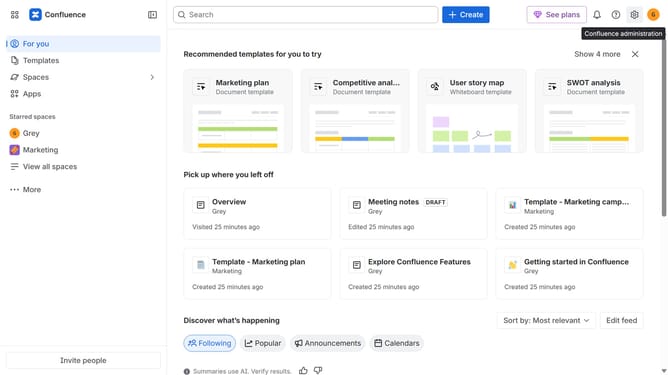
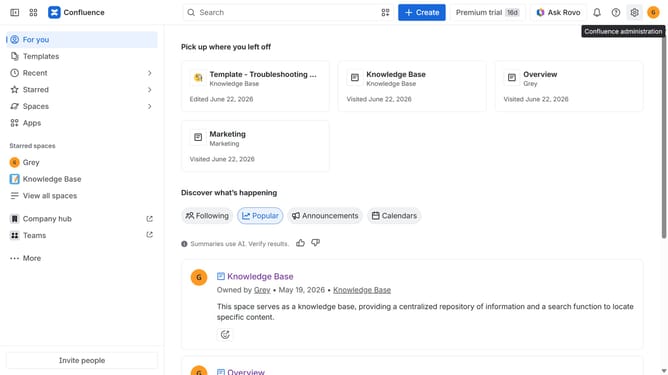
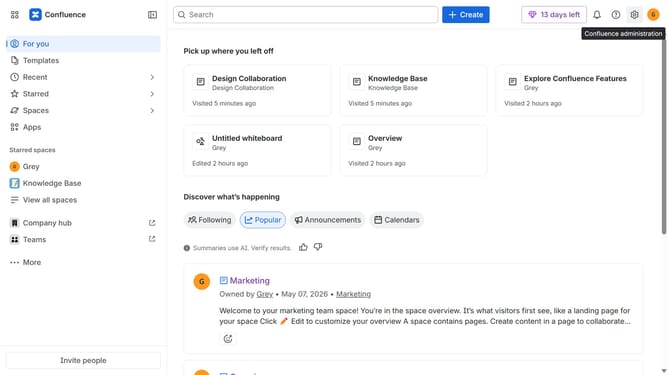
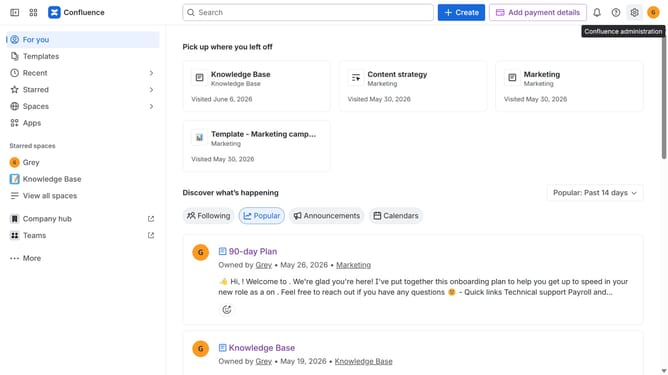
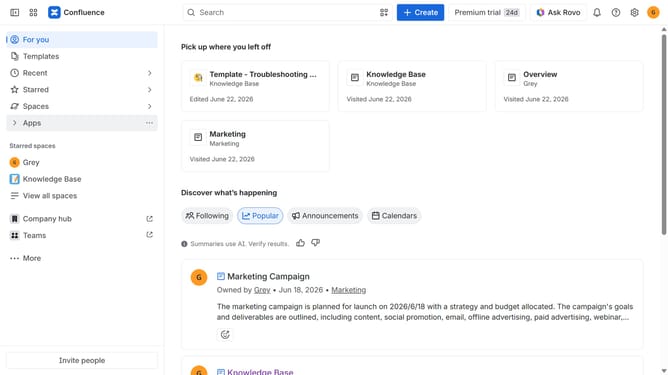
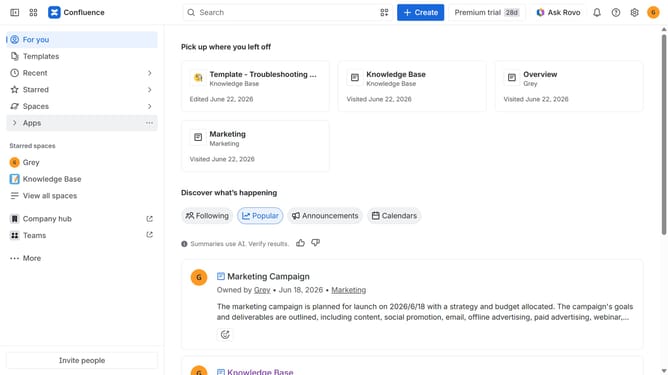
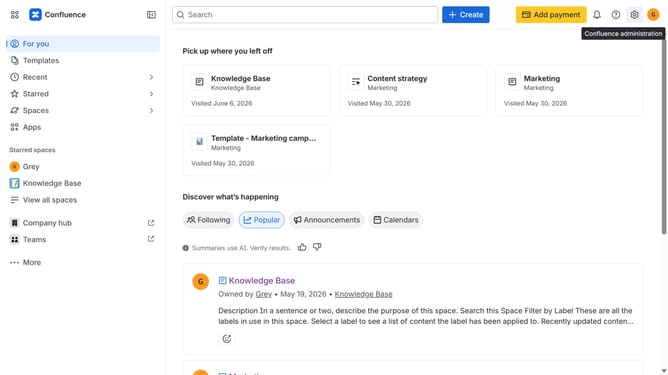
- First click on the "Apps" in the left sidebar
- Next, click on the "Explore more apps" option
- Click on the "Use cases" filter in the top menu bar
- Then, select the "Charts/Graphs" checkbox
- Optionally, select additional use case options
Why should you filter apps by the Charts/Graphs use case in the Confluence Marketplace
Confluence is a dynamic collaboration hub that empowers teams to share knowledge and work smarter together.
Finding the right app to visualize data in Confluence Marketplace becomes a breeze with the Charts/Graphs filter. This feature streamlines the search, pinpointing exactly the solutions designed for data representation.
Using this filter not only saves time but ensures you select apps that enhance your team’s decision-making capabilities with clear and impactful visuals.
Ultimately, it supports a more efficient workflow by integrating intuitive visualization tools into your Confluence experience.
Last update