How to create a bar chart for channel count in Folk
Here is how to create a bar chart for channel count in folk
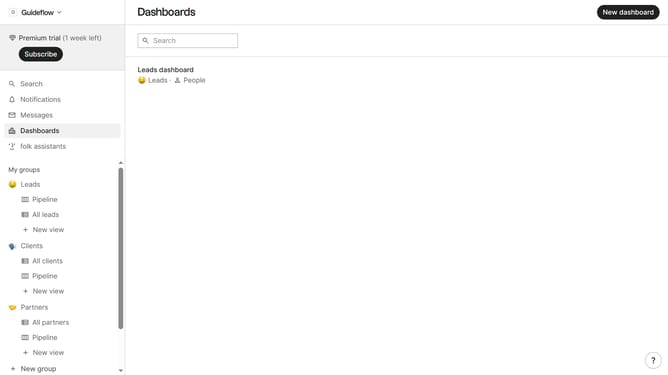
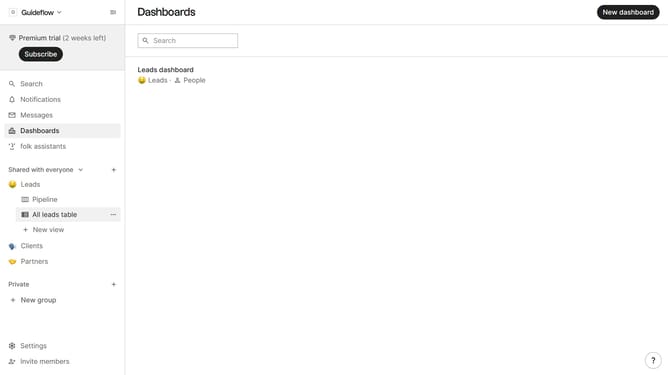
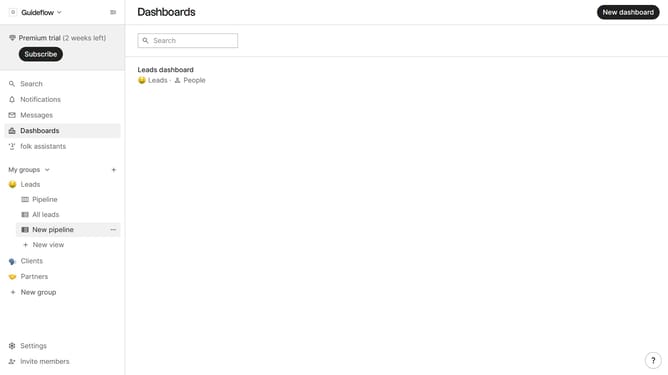
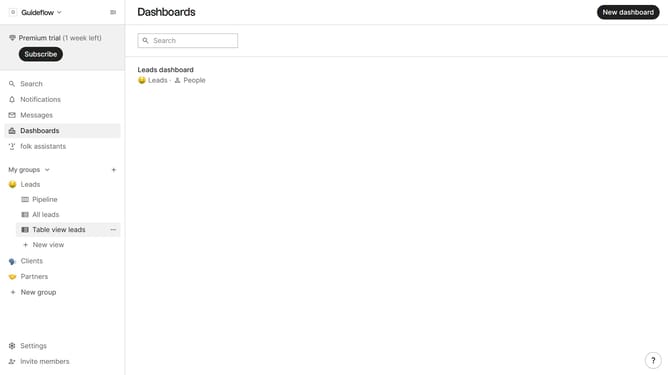
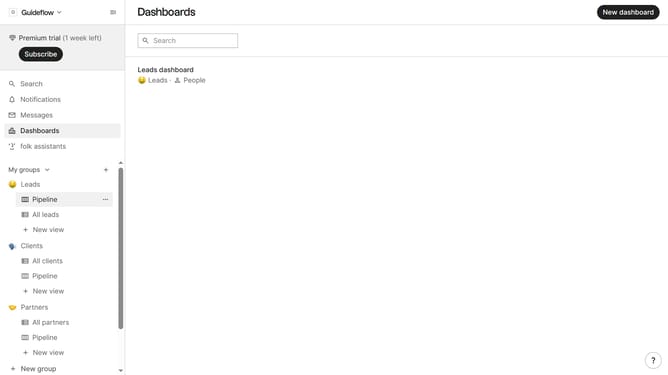
- First click on "Dashboards" in the sidebar menu
- Next click on the dashboard where you want to create a bar chart for channel count
- Then click on "Add chart" button
- Then click the "Chart type" dropdown button
- Next click on the "Bar" option from the dropdown menu
- Then click on the "Measure" dropdown button
- Next hover your mouse cursor over the "Count" menu
- Then click on the "Channel" option from the dropdown menu
- Next click on the "View by" dropdown button
- Then click on your preferred view option from the menu that appears
- Finally, click on the "Save" button
Why should you create a bar chart for channel count in Folk
Folk is a powerful tool that enables teams to seamlessly organize, track, and analyze data for strategic insights.
Creating a bar chart for channel count in Folk is an intuitive process that transforms raw data into visual clarity.
This feature enables users to compare different channels at a glance, making it easier to identify trends and allocate resources effectively.
By leveraging Folk's data visualization, teams can communicate complex information quickly and drive informed decisions with confidence.
Last update