How it works
1. First click the presentation that contains the chart you want to edit
2. Then click the chart to begin editing
3. Next click on the "Edit data" button in the chart toolbar
4. Then click on the "Format" dropdown in the edit data panel
5. Then click on the "Type" dropdown in the number format settings
6. Then select "Percentage" option from the format dropdown menu
7. Finally click the "Done" button to apply the percentage format changes
Create your own interactive guide with Guideflow
Why should you use this feature?
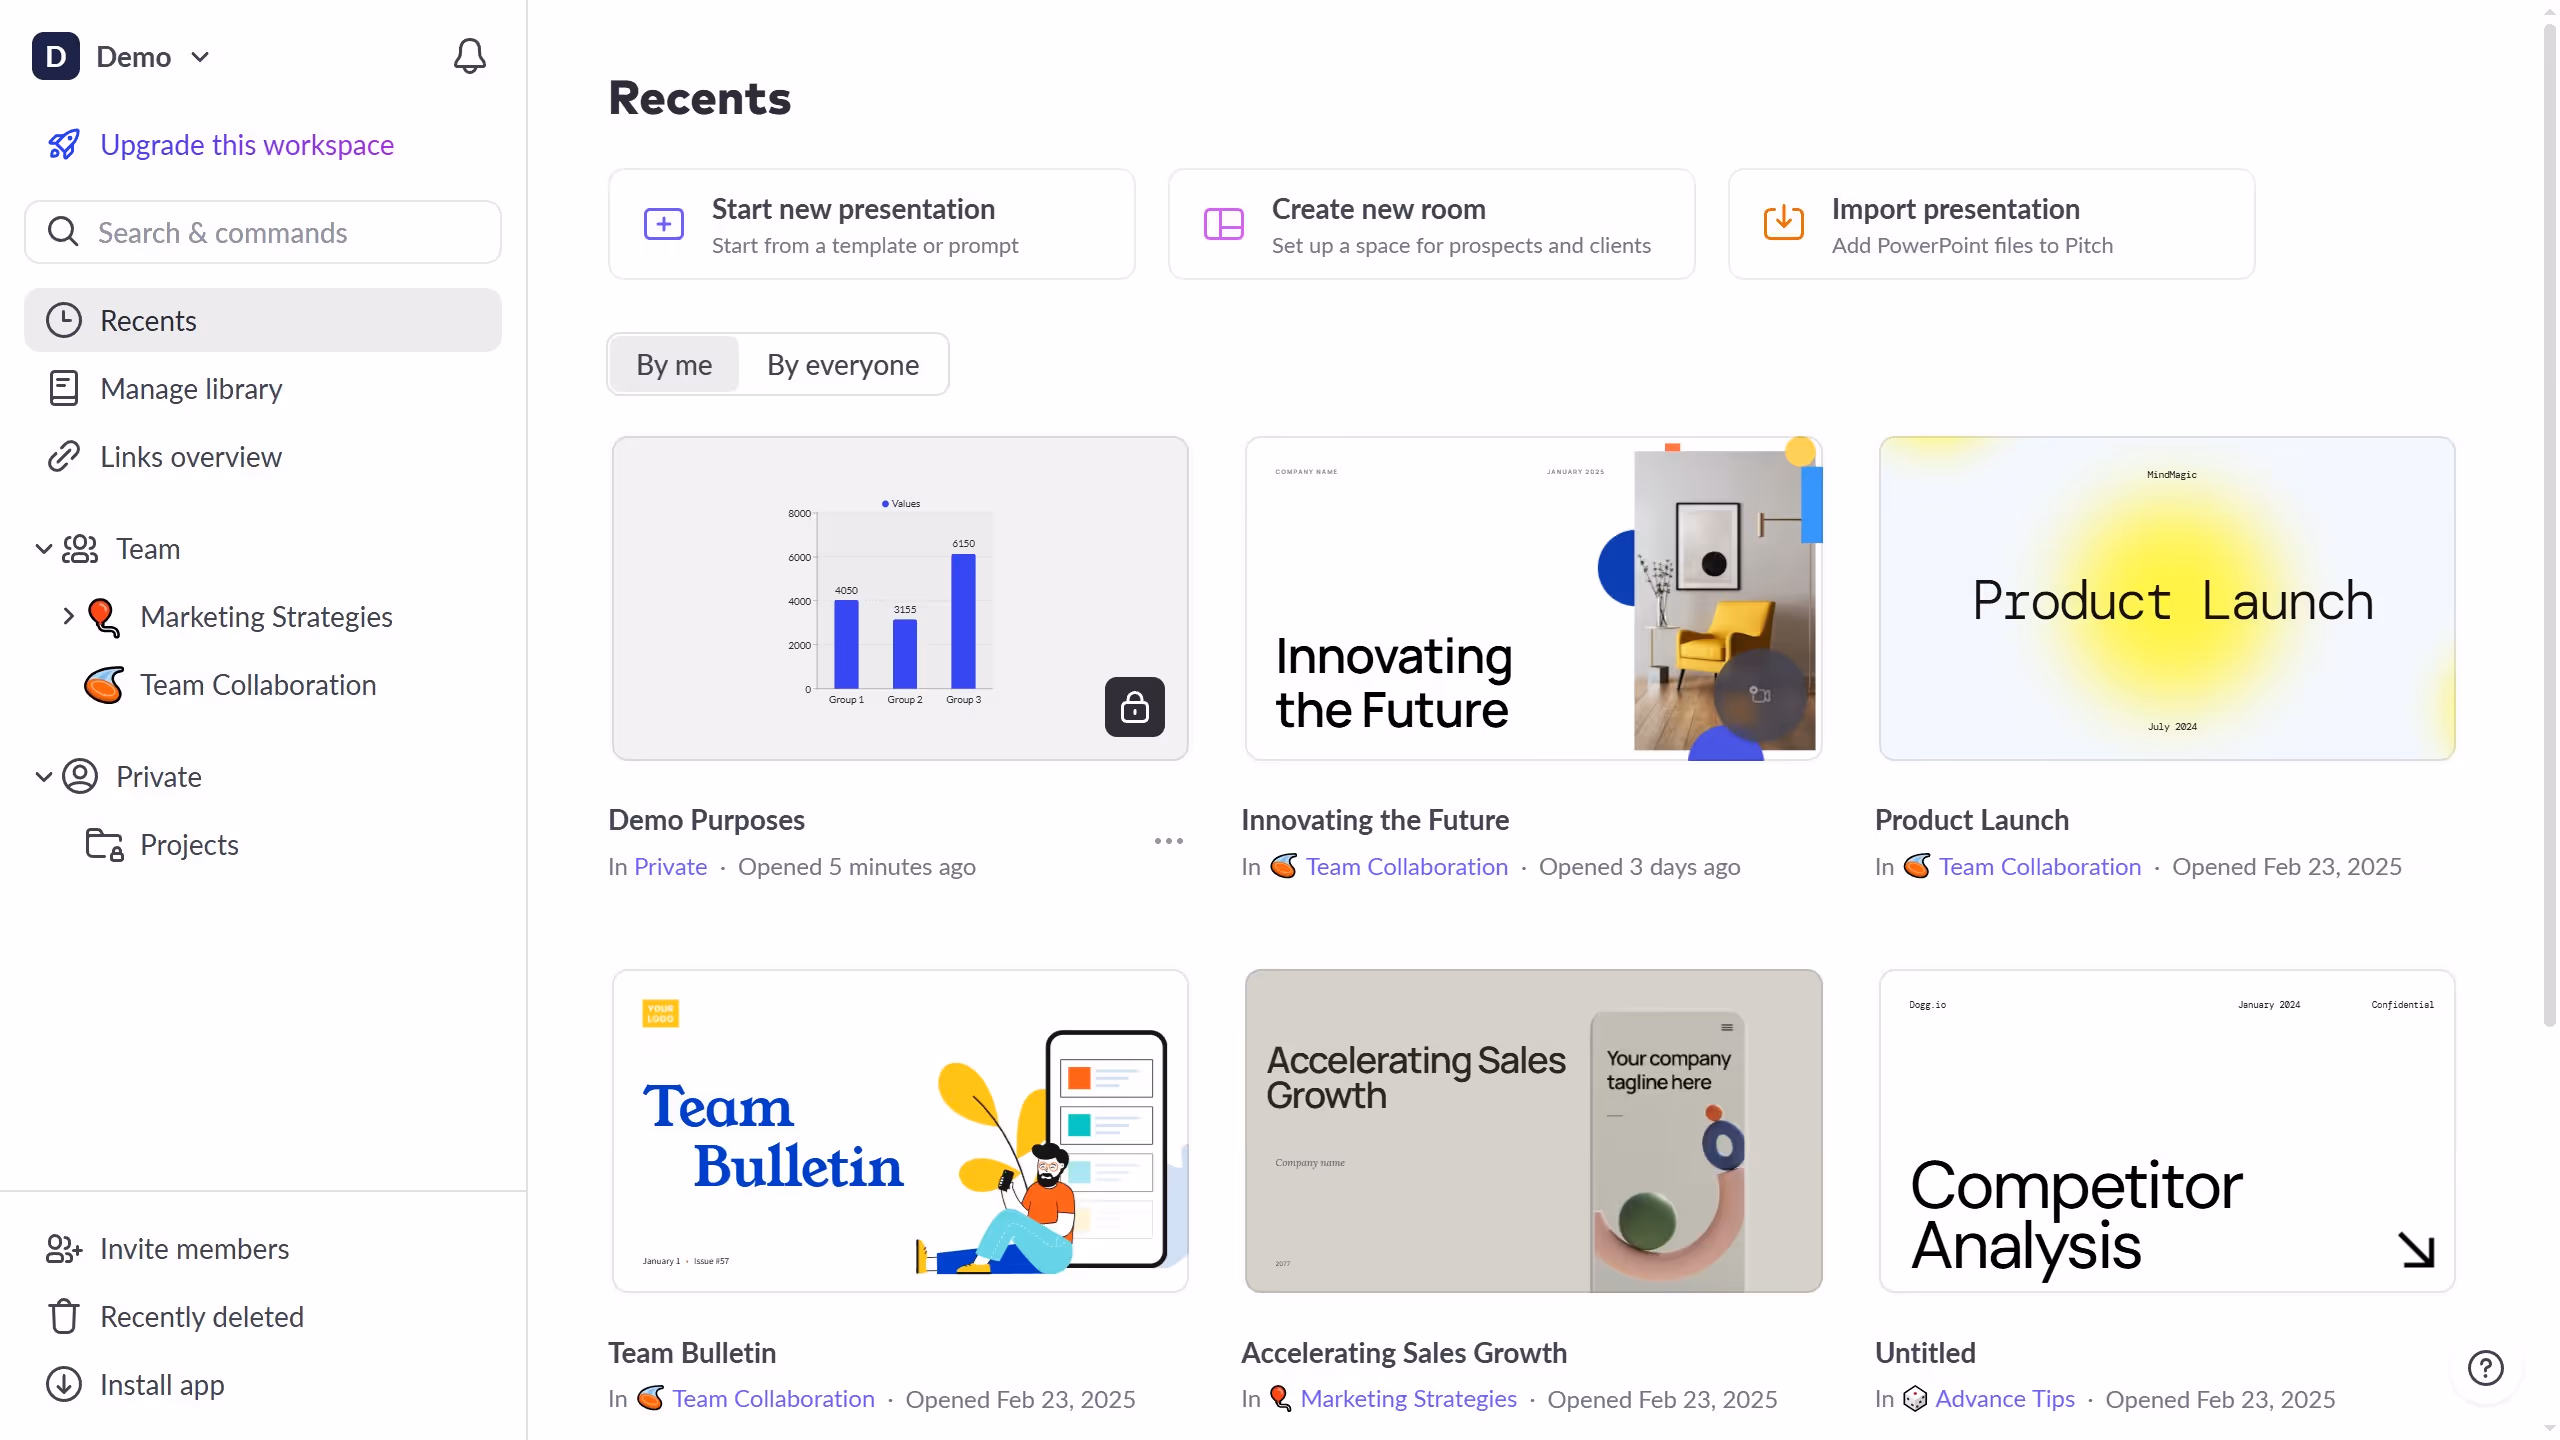
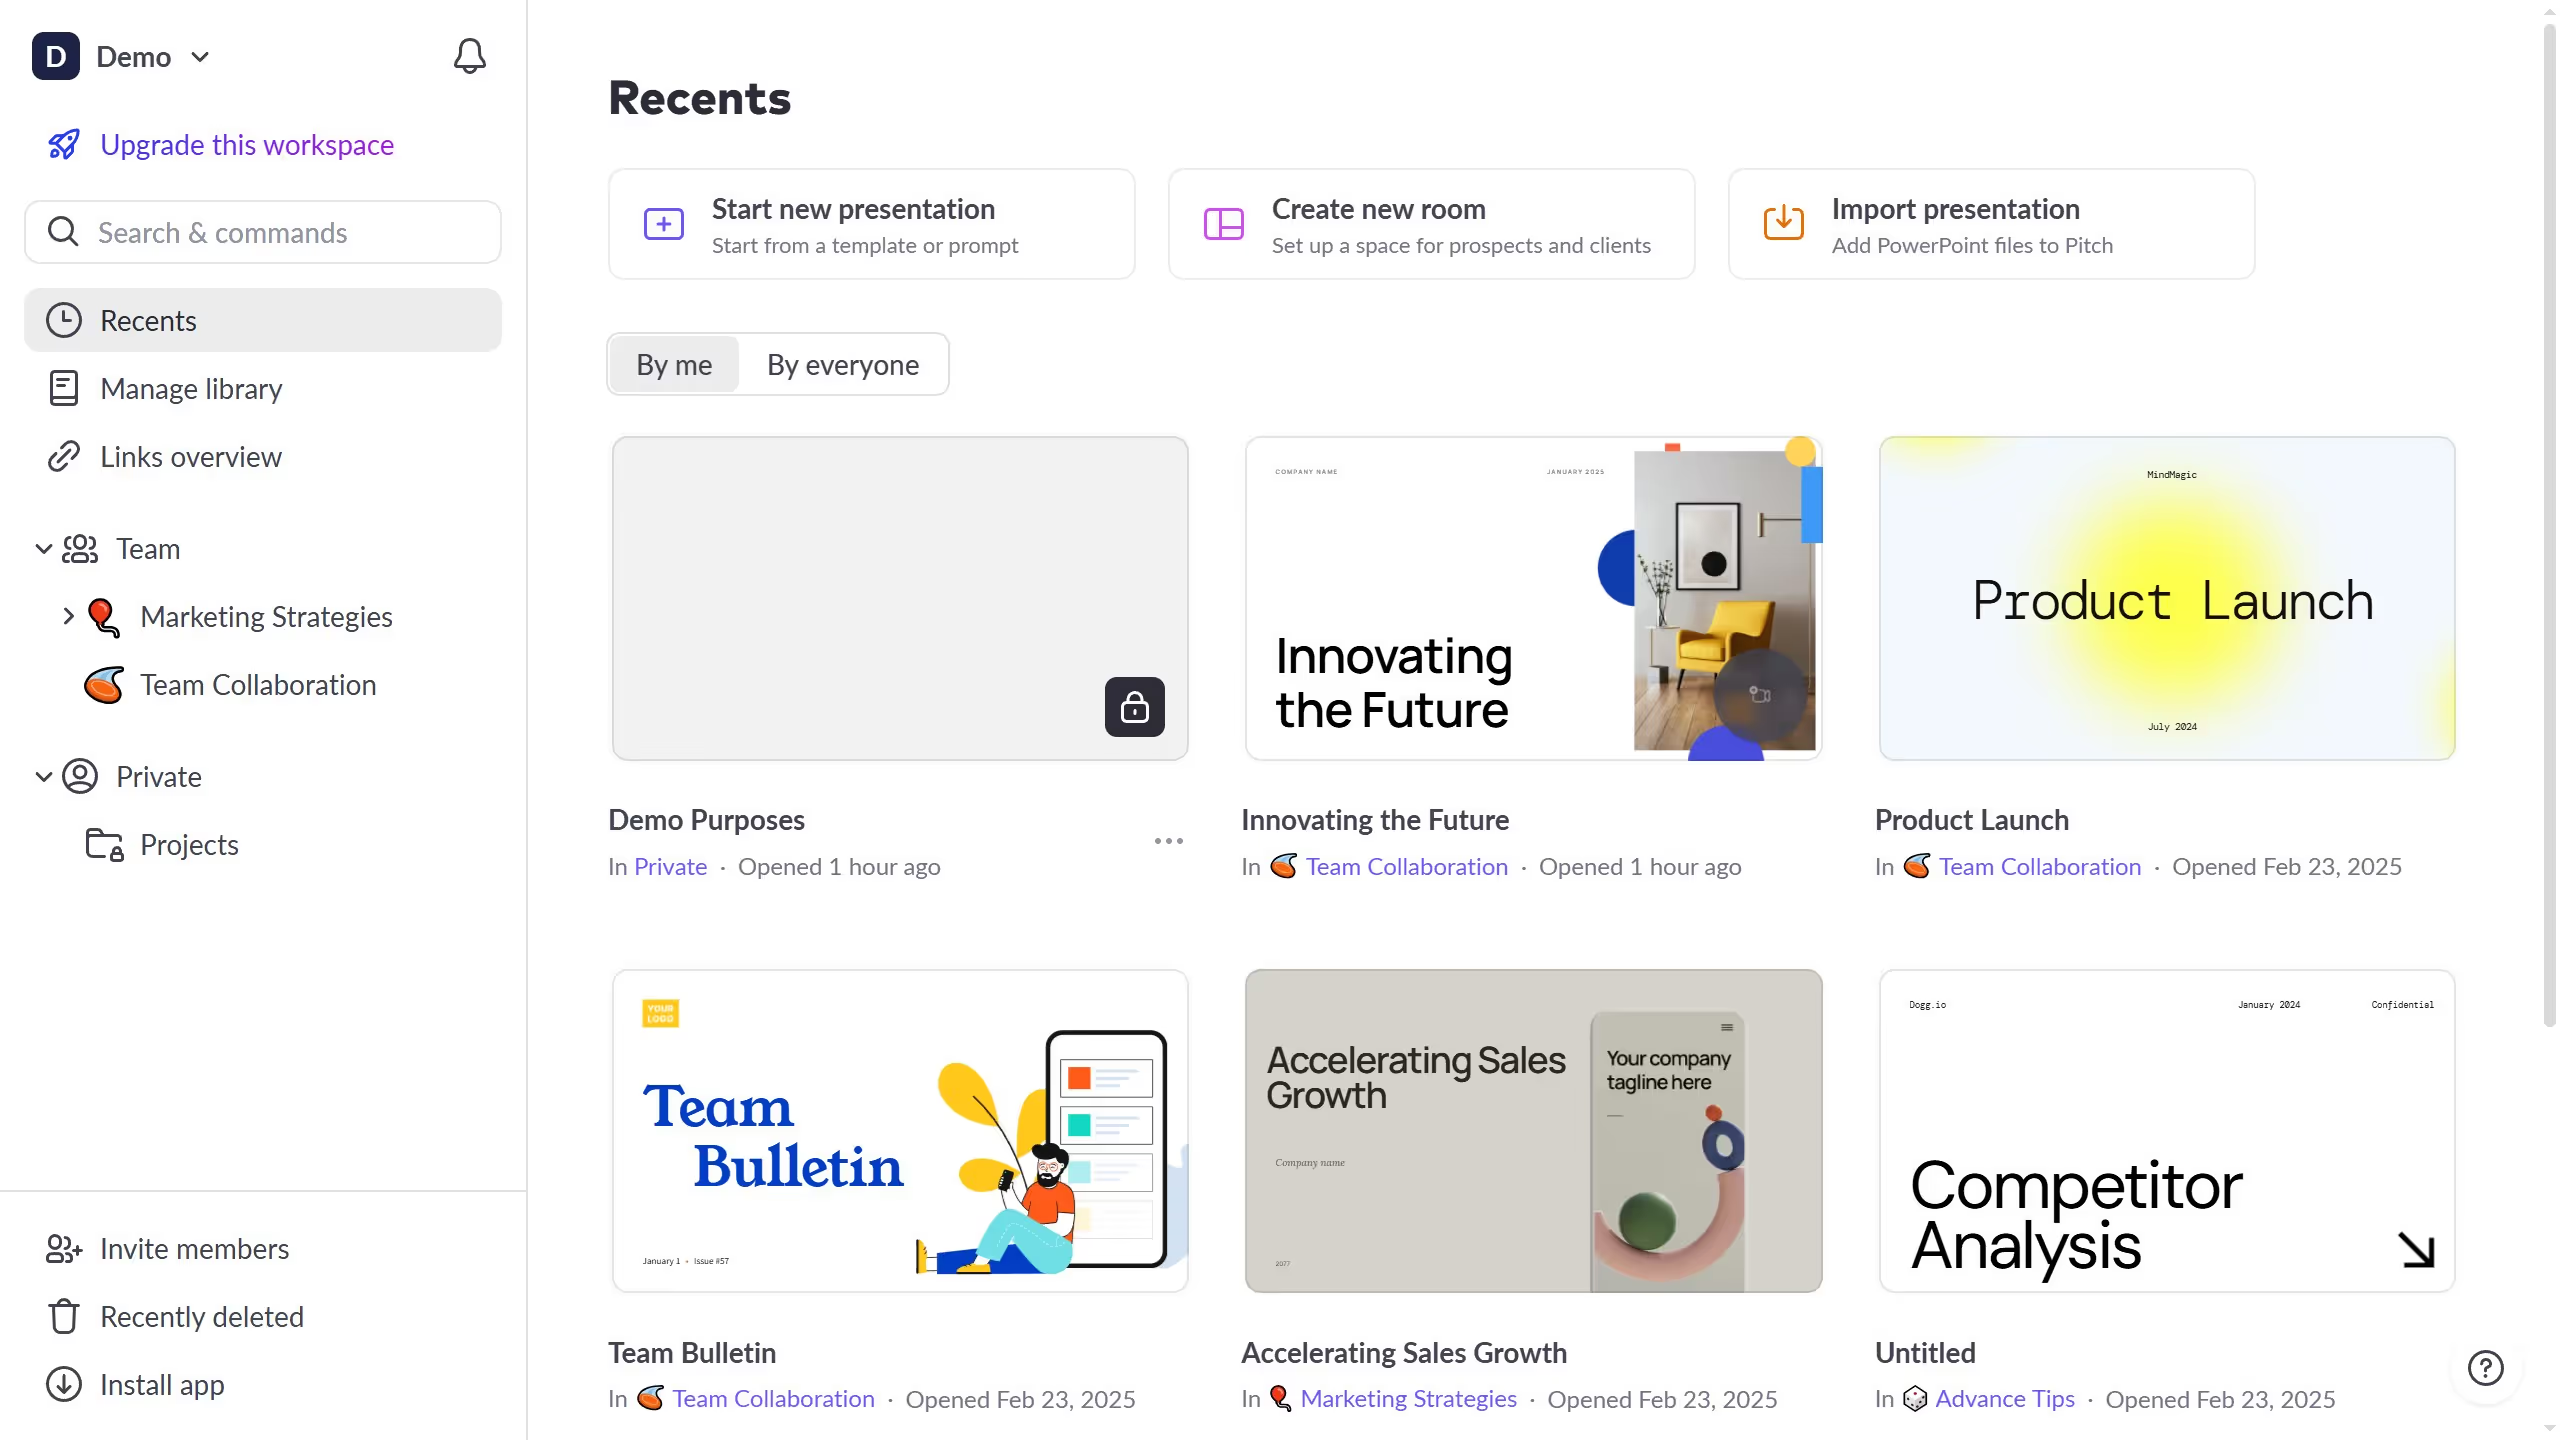
Pitch redefines the way teams create beautiful presentations efficiently and collaboratively.
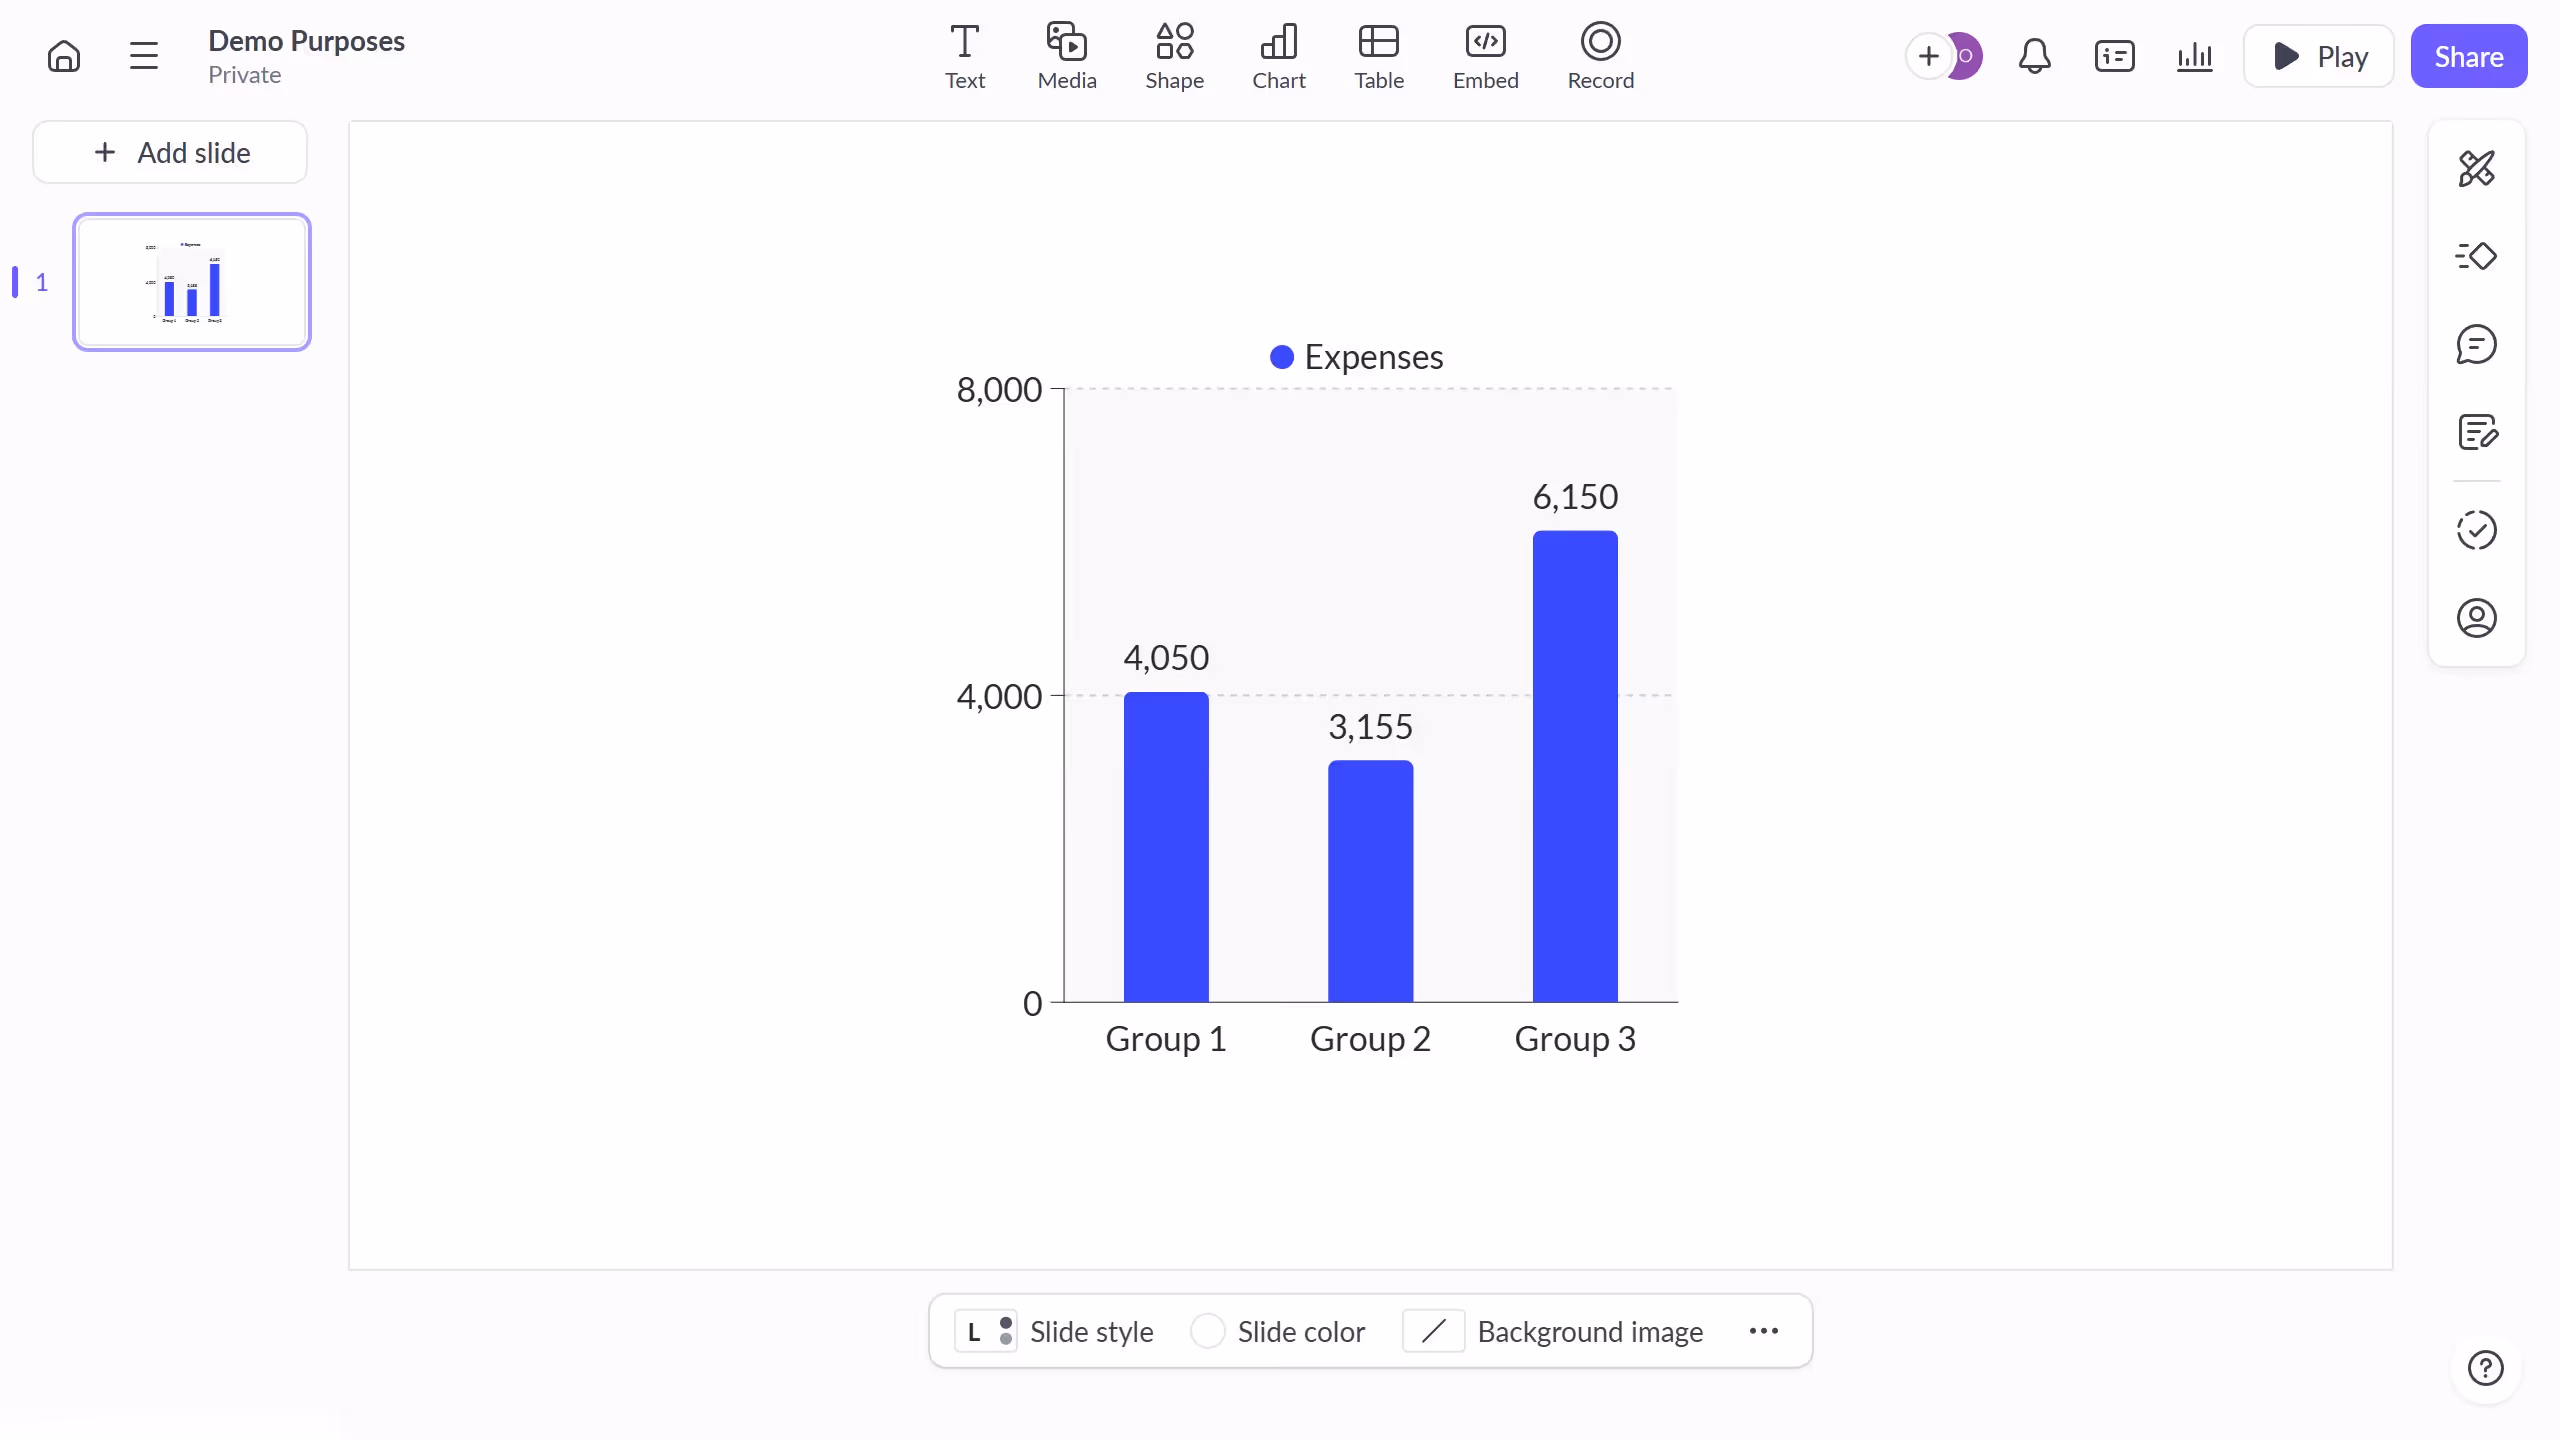
When presenting data, formatting percentages in charts within Pitch offers clarity and precision, ensuring the data is both impactful and comprehensible.
Utilizing this feature helps maintain consistency across presentations, providing a professional finish that resonates with audiences.
The ability to clearly format percentages not only enhances comprehension but also builds credibility, making your presentations stand out effortlessly.
Built to impress
Why leading companies build with Guideflow


