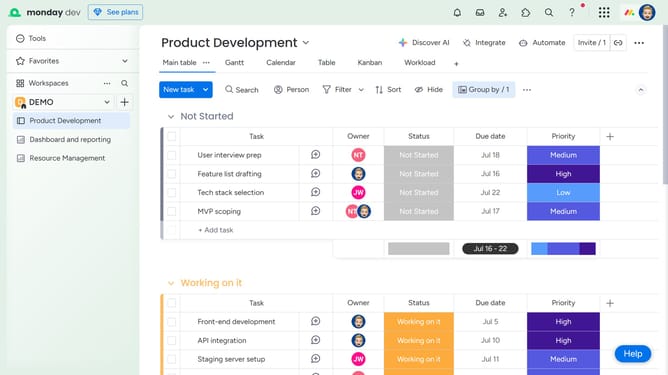
How to customize the colors in a Chart Widget in Monday.com
Here is how to customize the colors in a chart widget in monday.com
- First click on the dashboard in the left sidebar
- Find the Chart Widget you want to change the colors for
- Next click on the "More actions" button (three dots) in the chart widget header
- Then select the "Settings" option from the dropdown menu
- In the widget settings panel, click on the "Customize" dropdown section
- Next click on the "Edit color and text" button under Labels
- Then click the "paint bucket" icon next to your label
- Finally, select a color from the default palette to represent that label
- Repeat this process for the remaining labels as needed
- Now click the "Close" button (X) in the top-right corner to exit the settings
Why should you customize the colors in a Chart Widget in Monday.com
Monday.com is a versatile work operating system designed to boost team productivity and streamline workflows.
Customizing the colors in a Chart Widget on Monday.com empowers teams to visually differentiate data, enhancing clarity and focus.
This feature not only allows for a personalized touch but also helps in categorizing information efficiently, making data analysis more intuitive.
By tailoring chart colors to suit team preferences, users can increase engagement and make quicker, more informed decisions.
Last update