How to create a bar chart for company vertical count in Folk
Here is how to create a bar chart for company vertical count in folk
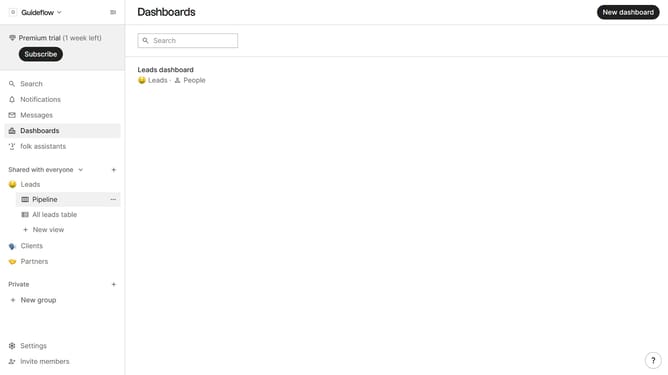
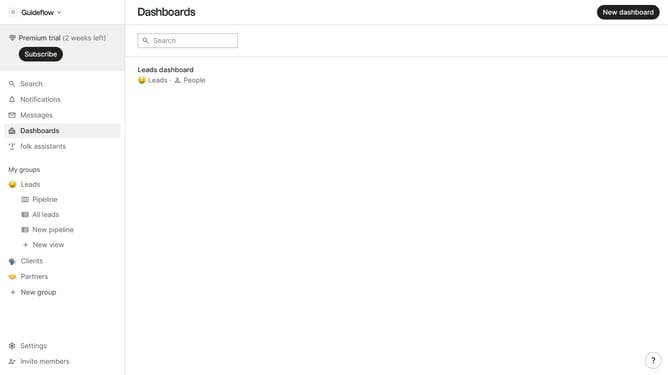
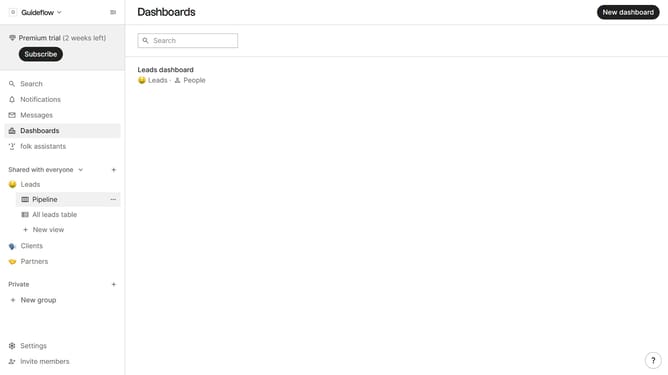
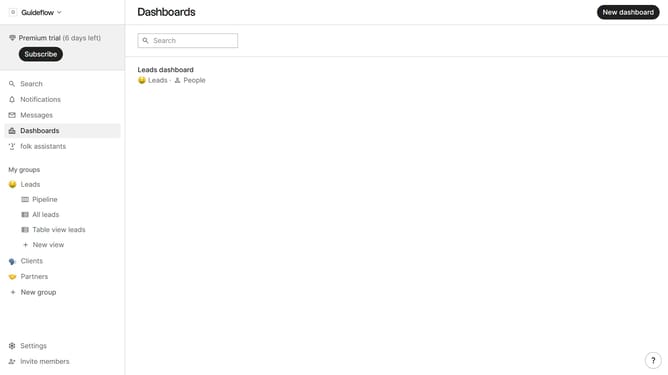
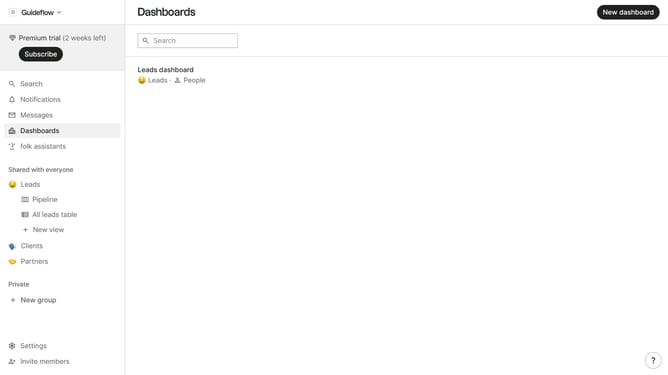
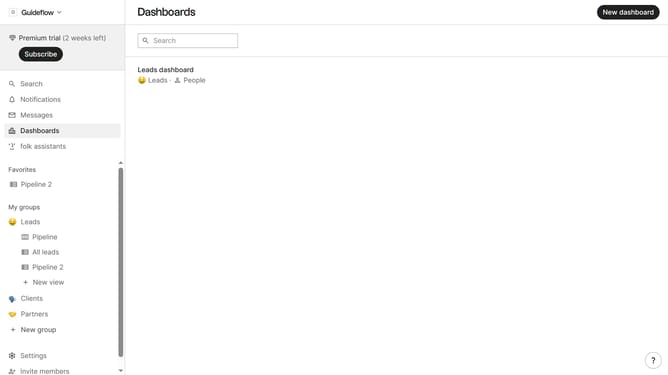
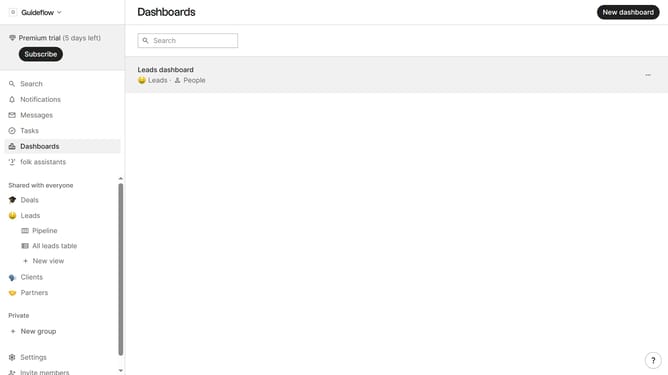
- First click on "Dashboards" item in the sidebar
- Next click on the dashboard where you want to create a bar chart for company vertical count
- Then click on "Add chart" button
- Next click the "Chart type" dropdown button
- Then click on the "Bar" option from the dropdown menu
- Next click on the "Measure" dropdown button
- Then hover your mouse cursor over the "Count" menu
- Then click on the "Company vertical" option from the dropdown menu
- Next click on the "View by" dropdown button
- Then click on your preferred view option from the menu that appears
- Finally click on the "Save" button
Why should you create a bar chart for company vertical count in Folk
Folk is a dynamic platform designed to simplify team collaboration and data management.
Creating a bar chart for company vertical count in Folk is a straightforward process that allows users to visually interpret the distribution of various sectors within their company.
This feature transforms raw data into a digestible and insightful format, facilitating easier analysis and decision-making. Users can swiftly identify trends and patterns, promoting informed business strategies and enhancing overall performance.
Last update