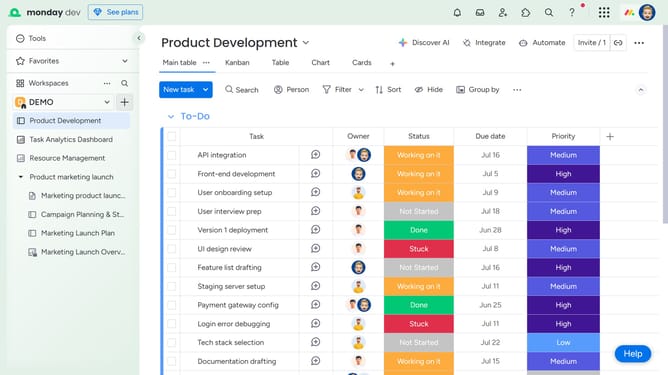
How to add a Chart Widget in Monday.com
Here is how to add a chart widget in monday.com
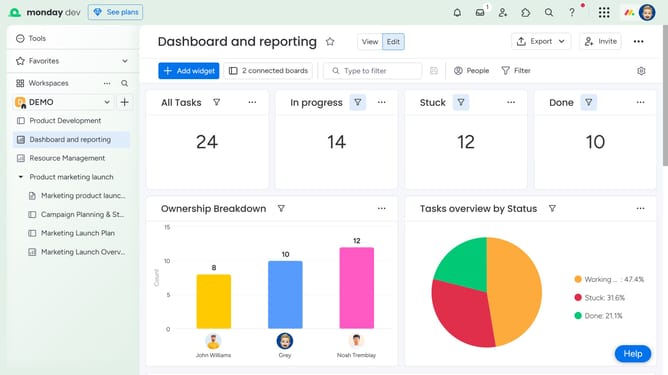
- First open the dashboard where you want to add the widget from the left sidebar
- Next click on the "Add widget" at the top left of the dashboard
- Then click on the "Chart" widget option in the widget selection menu
- The Chart Widget will now appear in your dashboard layout
- To confirgure the chart, click on the "More options" button (three dots)
- Select "Settings" from the dropdown menu
- In the widget settings panel, you can now configure the widget by selecting a chart type and customizing the data display
- Finally, once you're done, click the “X” icon at the top right to exit the settings panel
Why should you add a Chart Widget in Monday.com
Monday.com is an intuitive work operating system designed to simplify teamwork and streamline project management.
The Chart Widget is a dynamic feature within Monday.com that transforms complex data into visually appealing charts, enabling teams to quickly interpret and analyze information.
Using the Chart Widget offers enhanced clarity and better decision-making by allowing users to visualize data trends and patterns at a glance. This feature promotes efficient collaboration by helping teams stay connected and informed, ultimately leading to improved project outcomes.
Last update