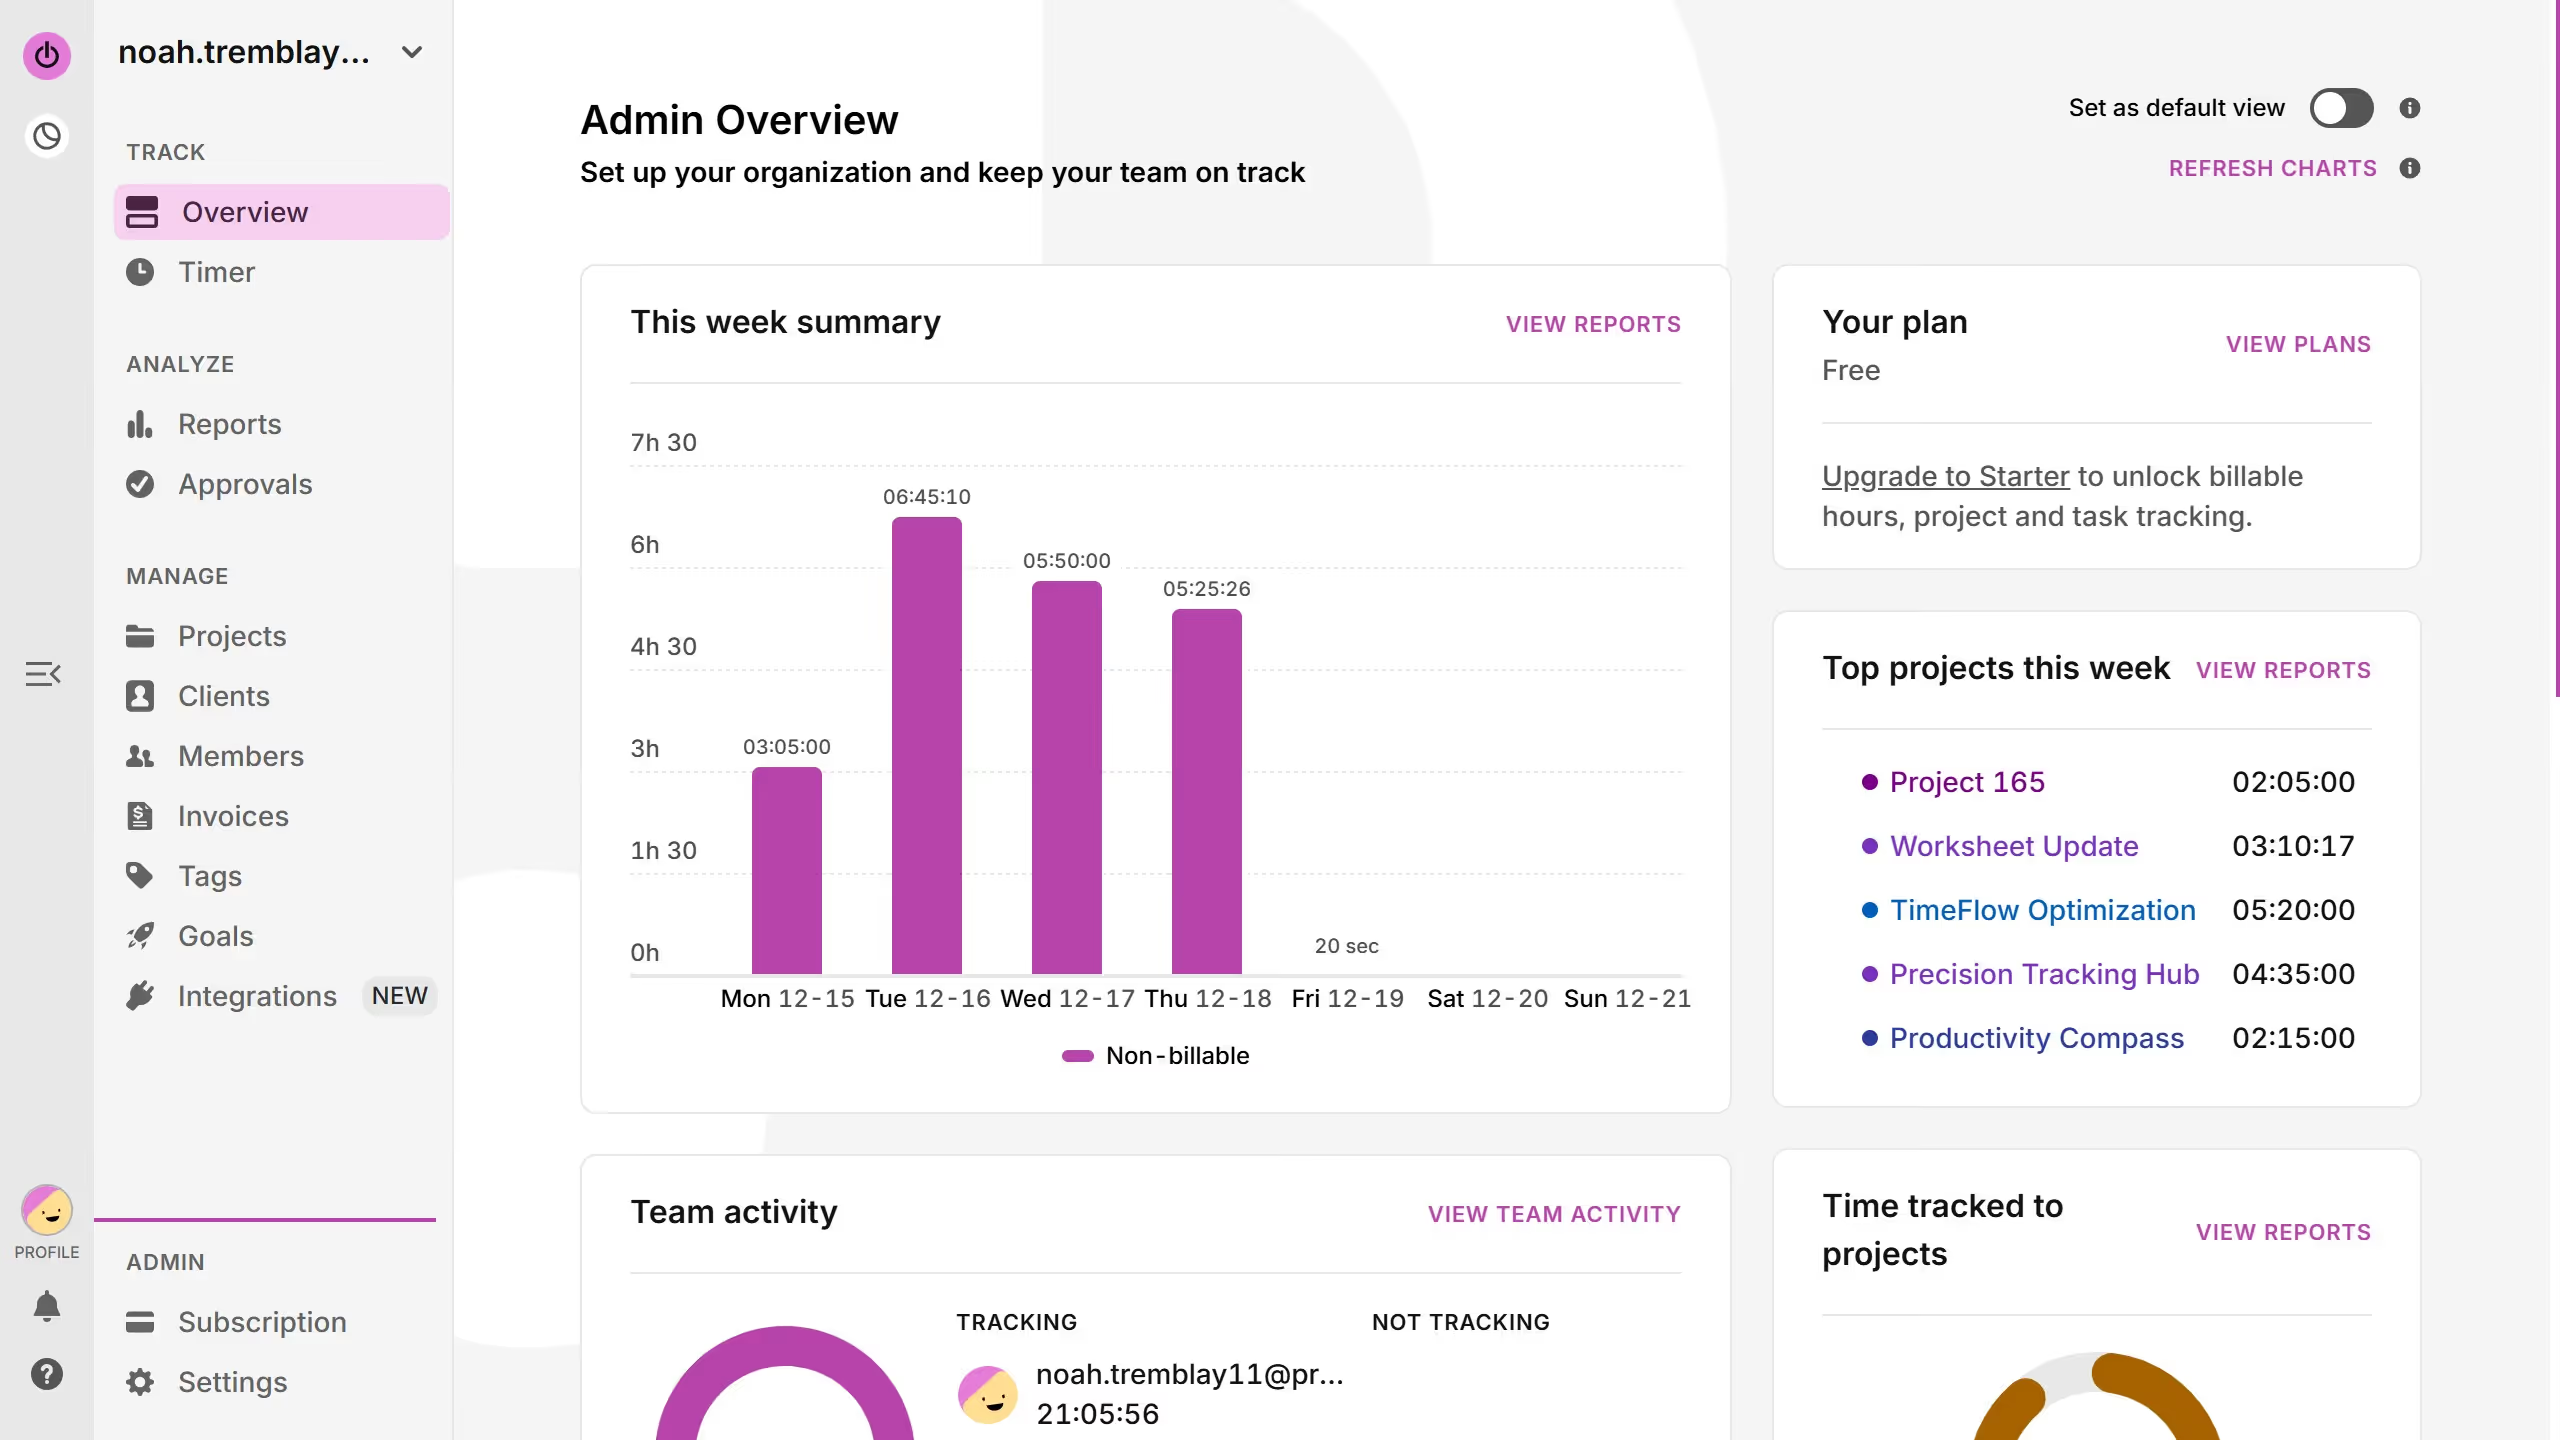
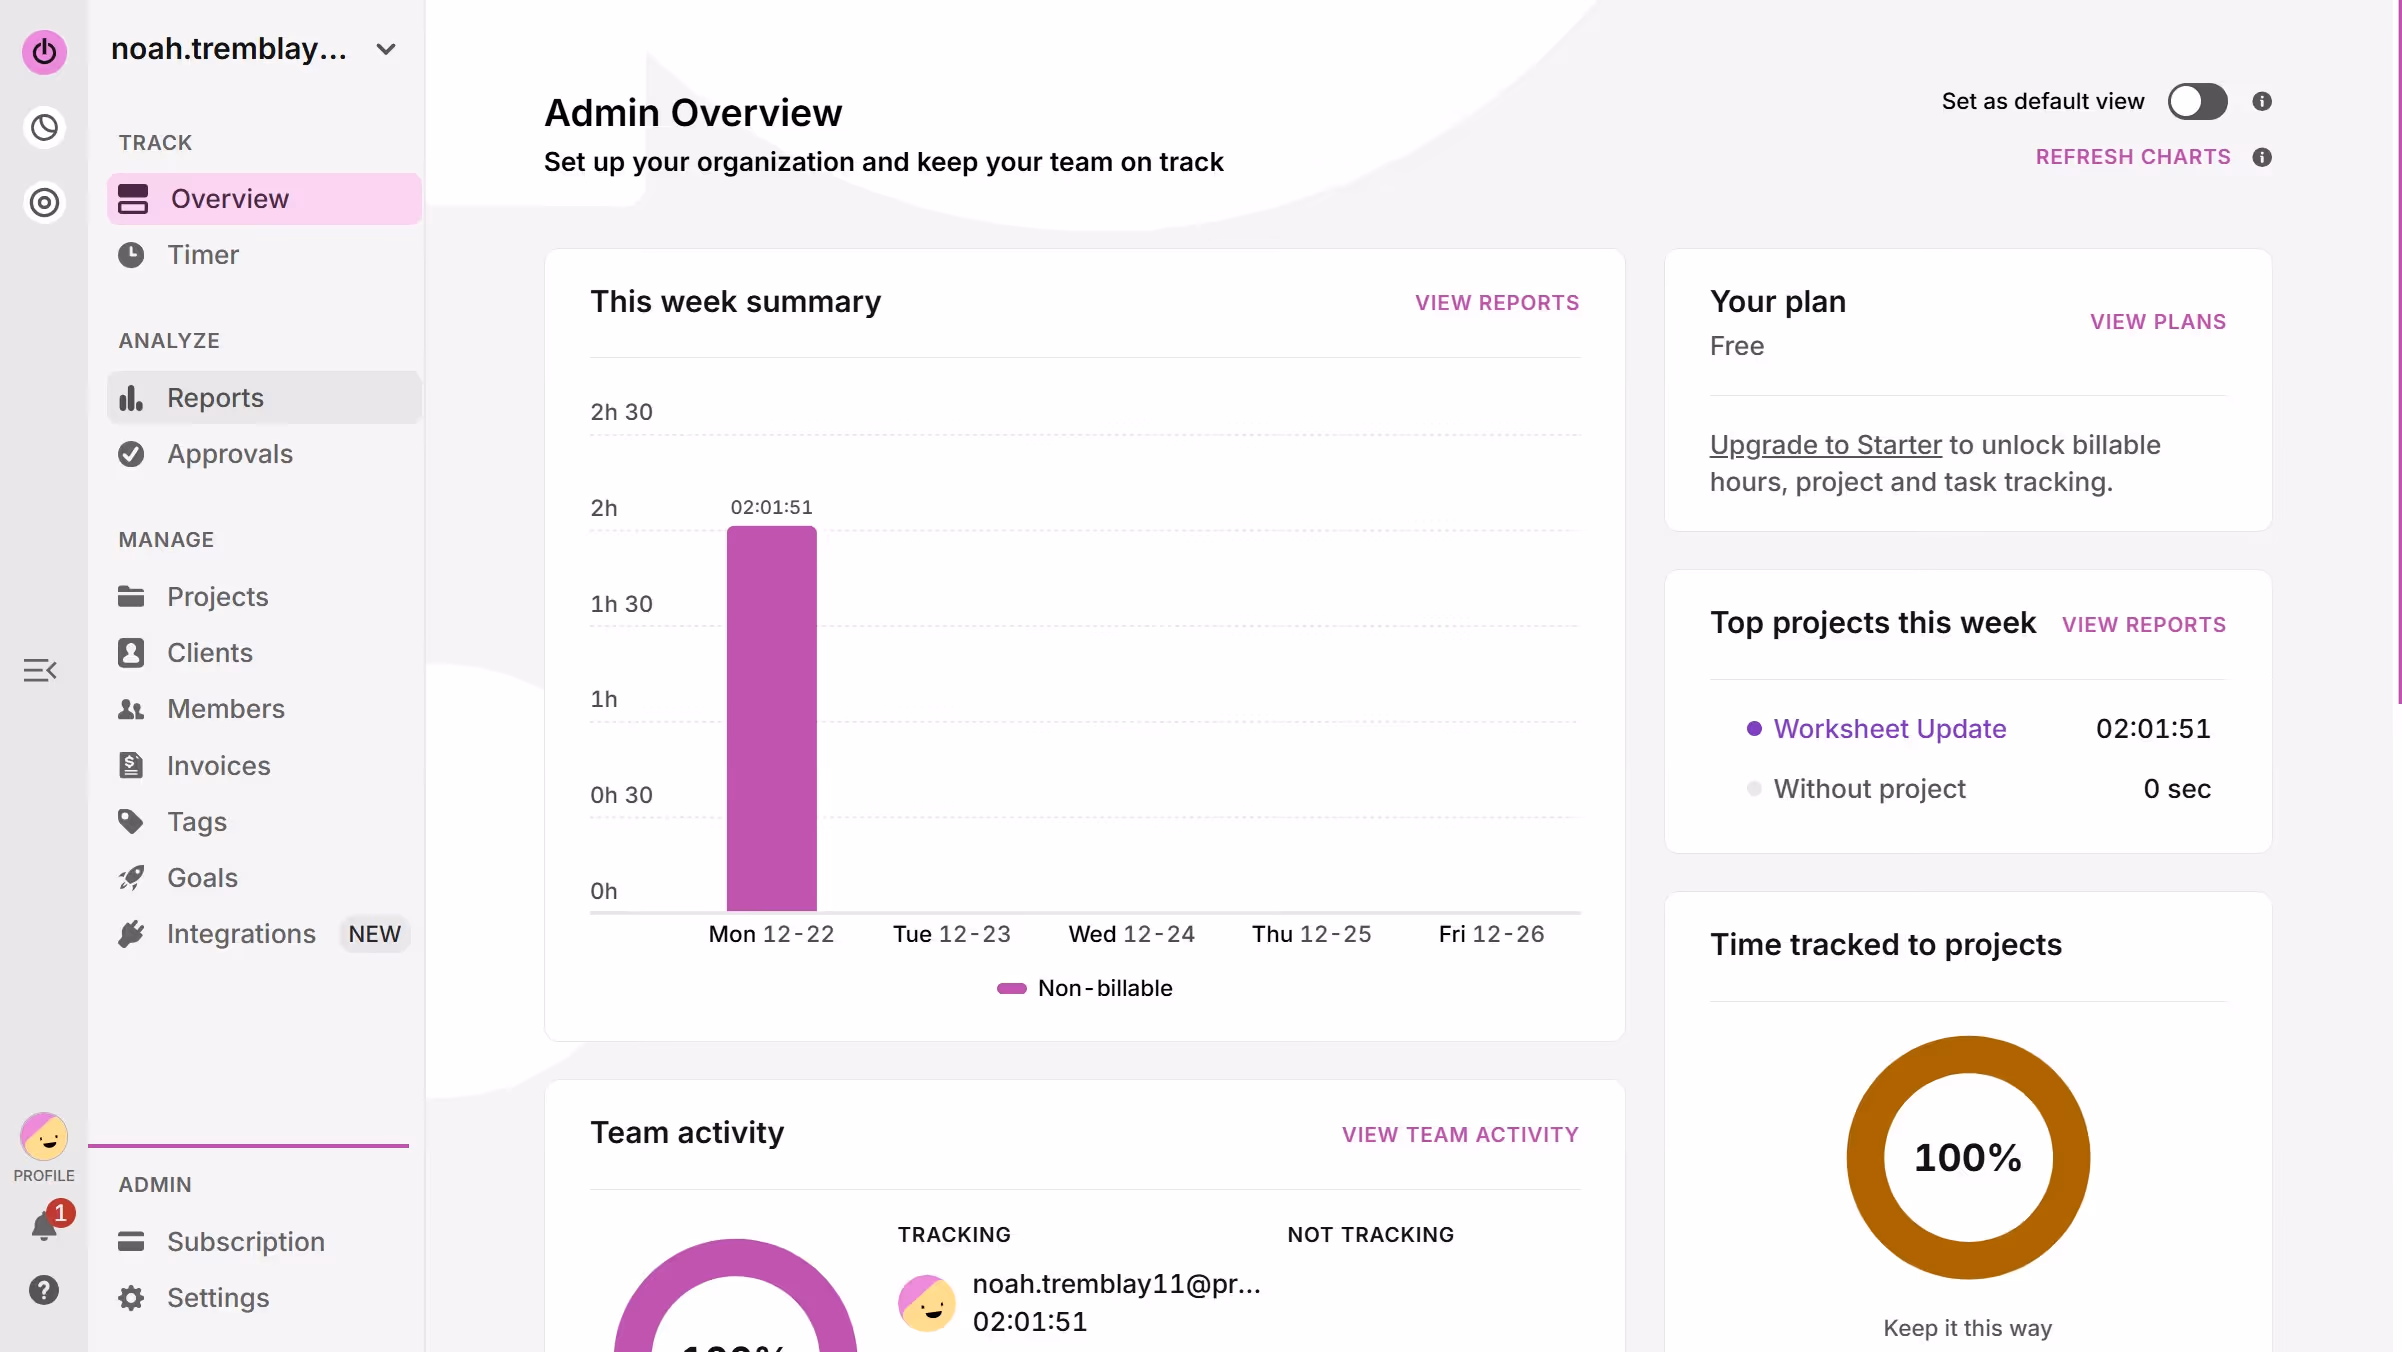
Here is how to view the weekly summary chart in toggl
- First click on "Reports" in the sidebar under the ANALYZE section
- Then click on the date range selector bar to open the calendar
- Finally select your desired week using the date selector

Create your own interactive guide with Guideflow
Toggl is an intuitive time management tool designed to enhance productivity and track efficiency.
Viewing the weekly summary chart in Toggl allows users to gain a comprehensive overview of how their time is allocated across tasks.
This feature is instrumental in identifying patterns, optimizing workflow, and making data-driven decisions that enhance productivity.
By providing a visual representation of time spent, it empowers individuals and teams to manage their time better and achieve their goals with precision.
Why leading companies build with Guideflow