How to switch between line and bar charts in Mixmax Reports
Here is how to switch between line and bar charts in mixmax reports
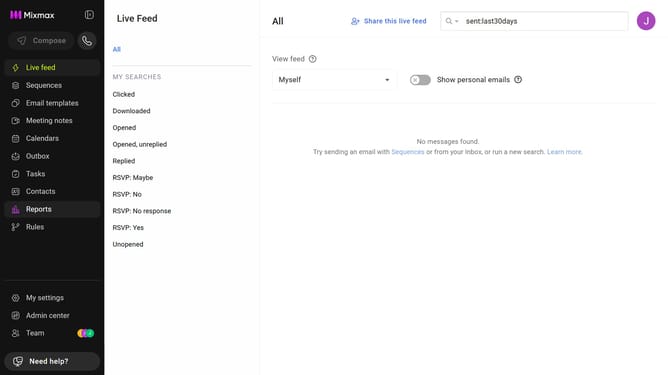
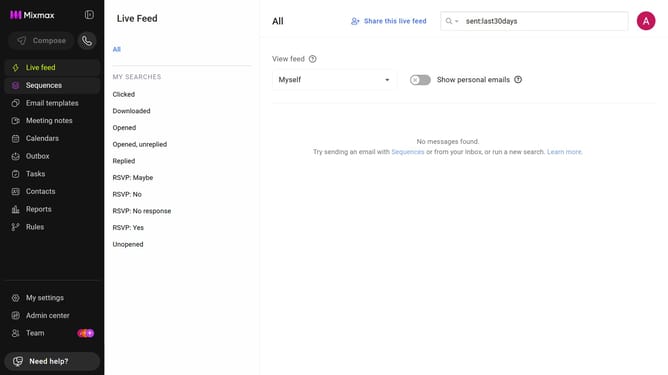
- First click on "Reports" in the sidebar menu
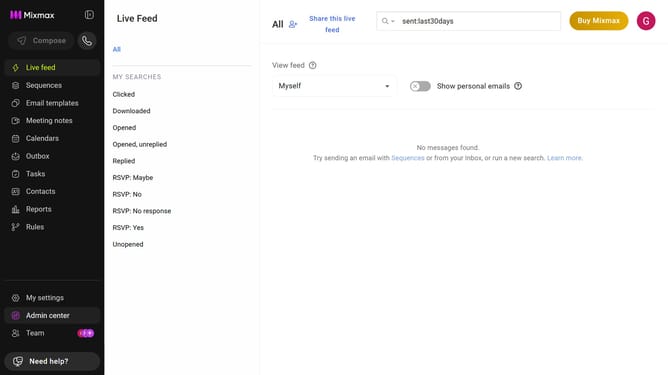
- Next, click on the "Dashboard" tab
- Then, find the chart you want to change
- Finally, locate the chart type option on the right side of the chart and select either Line Chart or Bar Chart
Why should you switch between line and bar charts in Mixmax Reports
Mixmax is an innovative productivity platform designed to streamline communications and enhance team efficiency.
One of its standout features is the ability to seamlessly switch between line and bar charts in Mixmax Reports.
This flexibility allows users to choose the most intuitive format for understanding their data at a glance.
Whether you're identifying trends with a line chart or comparing quantities with a bar chart, this feature ensures that your reporting is always tailored to your specific analysis needs.
Last update