How to show category labels on a chart on Pitch
Here is how to show category labels on a chart on pitch
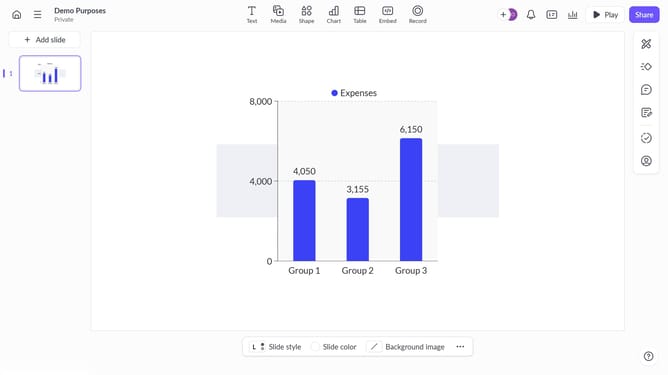
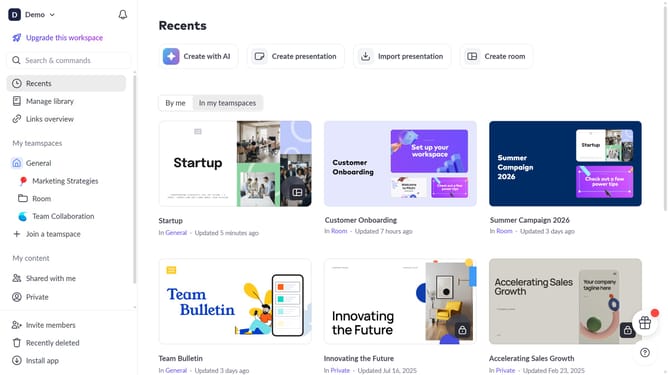
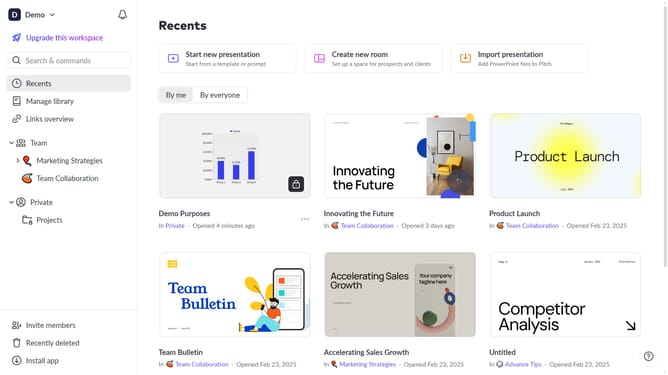
- First, open the presentation containing the chart you want to edit
- Select the slide containing the chart in the slide navigator
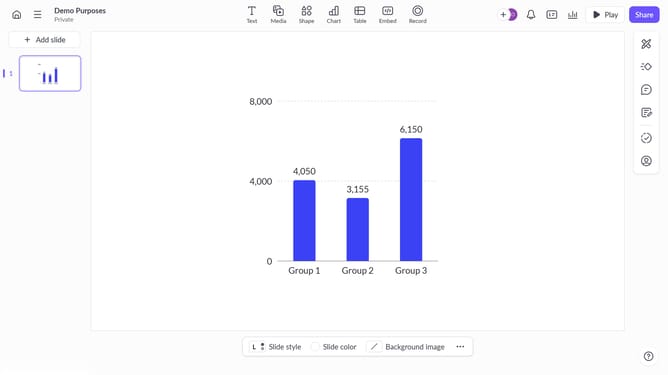
- Next, click on the chart to select it
- After that, click on the "More options" button in the toolbar that appears
- Next locate the "Category labels" option in the right-hand panel
- Then, toggle on the switch next to "Category labels"
- Finally, customize the category labels font as needed
Why should you show category labels on a chart on Pitch
Pitch is an innovative platform designed to create stunning presentations effortlessly.
One of its standout features is the ability to show category labels on a chart. By displaying category labels, you can effectively convey important data, providing clarity and enhancing your narrative.
This feature supports better comprehension, allowing your audience to quickly grasp trends and insights at a glance. Using category labels in Pitch not only refines your data display but also ensures your message is communicated with precision and impact.
Last update