How to create a bar chart for deal value count in Folk
Here is how to create a bar chart for deal value count in folk
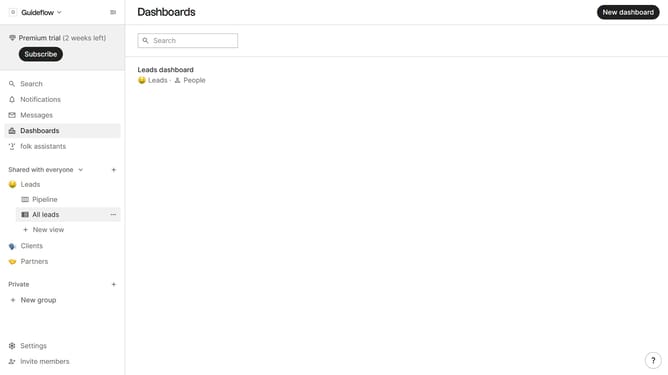
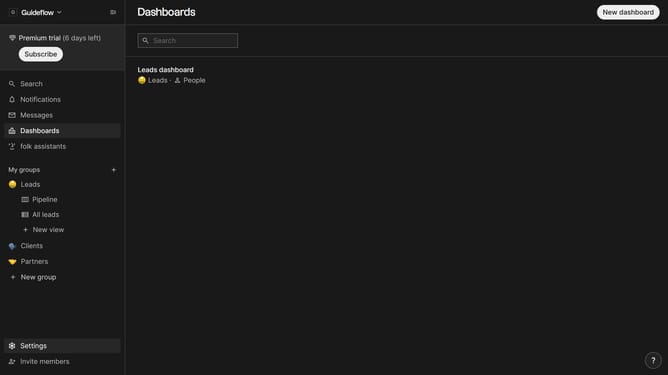
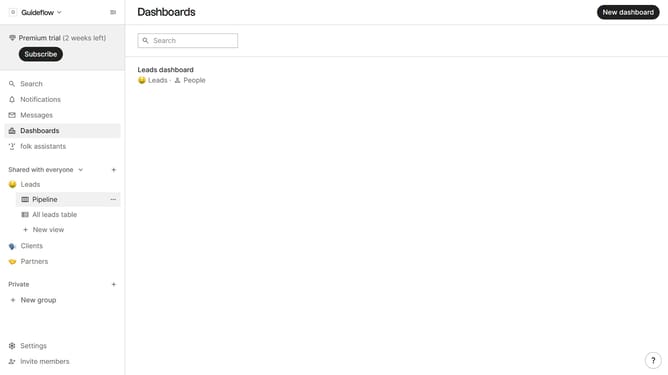
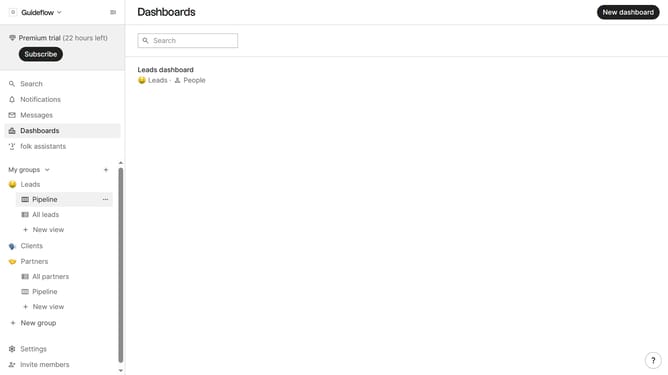
- First click on "Dashboards" in the sidebar menu
- Next click on the dashboard where you want to create a bar chart for deal value count
- Next click on the "Add chart" button
- Then click the "Chart type" dropdown button
- Next click on the "Bar" option from the dropdown menu
- Then click on the "Measure" dropdown button
- Next hover your mouse cursor over the "Count" menu
- Then click on the "Deal value" option from the dropdown menu
- Next click on the "View by" dropdown button
- Then click on your preferred view option from the menu that appears
- Finally click on the "Save" button
Why should you create a bar chart for deal value count in Folk
Folk is a dynamic platform designed to streamline and enhance collaboration within teams.
Creating a bar chart for deal value count in Folk is a straightforward process that empowers users with clear data visualization. It allows you to visually compare deal values, providing insightful perspectives on business performance at a glance.
This feature is particularly beneficial for teams looking to leverage data-driven decisions, ensuring that crucial insights are easily accessible and comprehensible to all team members.
Using this tool enhances decision-making and fosters a more strategic approach to managing deals, ultimately leading to improved outcomes.
Last update