Custom Charts for Confluence - Jira Dashboard Report | Tempo
Here is custom charts for confluence - jira dashboard report | tempo
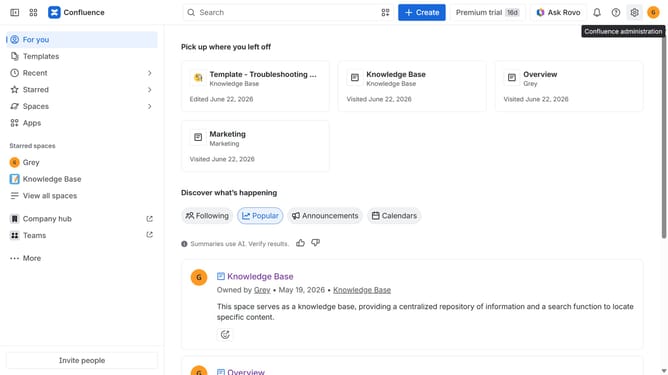
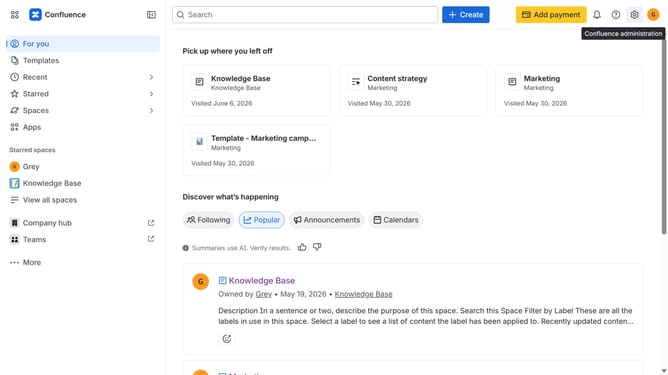
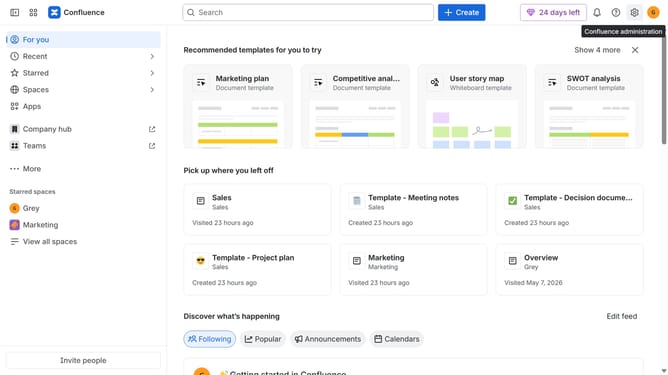
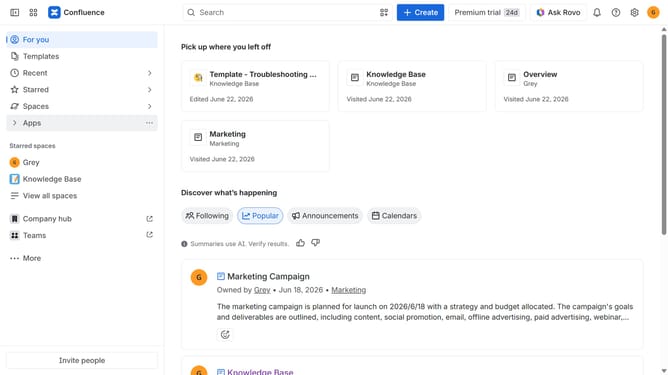
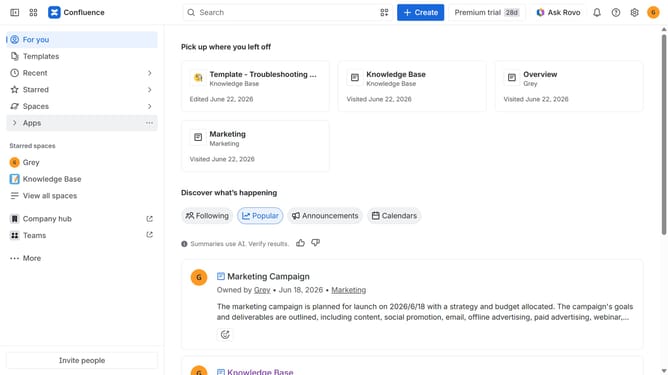
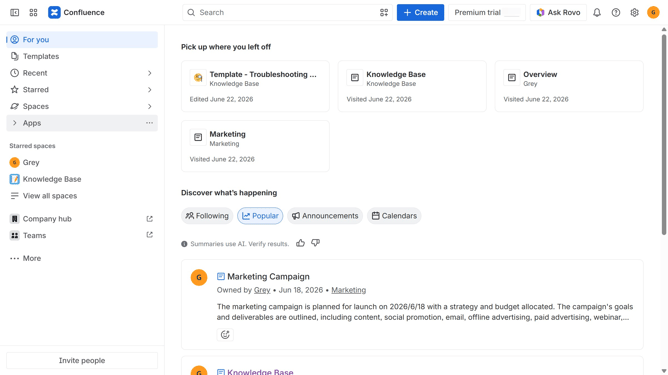
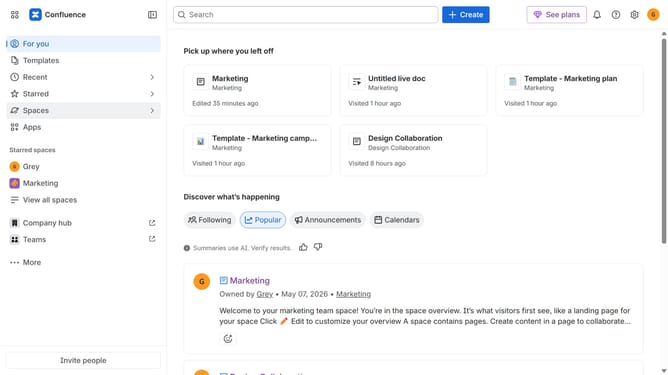
- First click on "Apps" in the navigation
- Next, select the "Explore more apps" option
- From the list, locate "Custom Charts" and click on it to open the app details page
- After that, click on the "Try it free" button
- Select the Confluence site where the app will be installed
- Then click on the "Review" button to proceed
- Review the app details, permissions, and other information
- Finally, click on the "Start free trial" button
Why should you Custom Charts for Confluence - Jira Dashboard Report | Tempo
Confluence is a collaborative workspace where teams can share knowledge and information seamlessly.
Custom Charts for Confluence - Jira Dashboard Report | Tempo offers teams the ability to create visually appealing and easy-to-understand charts. This feature enhances project management by transforming complex data into clear insights.
With these custom charts, teams can efficiently track progress, allocate resources, and identify trends, ensuring teams stay informed and aligned.
The ease of customization allows for tailored visual reporting, aligning perfectly with diverse business needs and preferences.
Last update