How to show value labels on a chart on Pitch
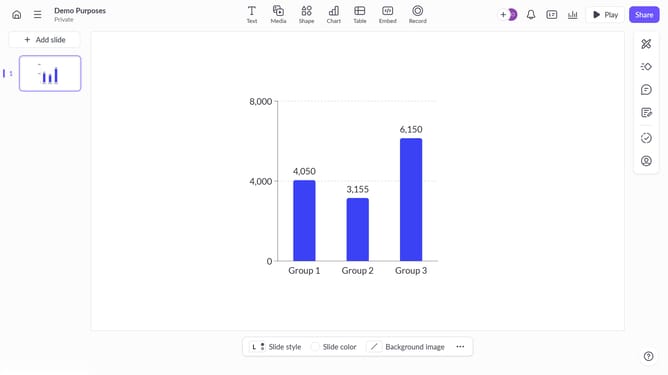
Here is how to show value labels on a chart on pitch
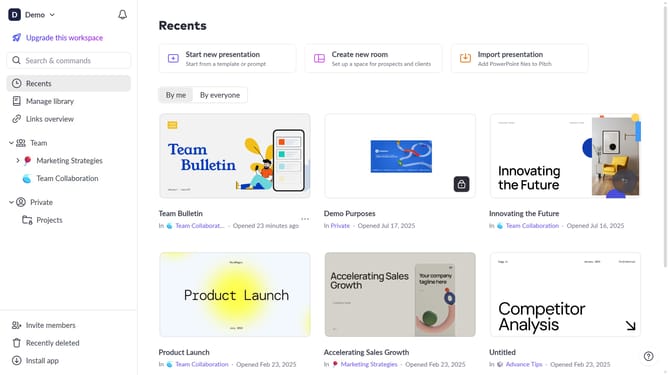
- First, open the presentation containing the chart you want to edit
- Select the slide containing the chart in the slide navigator
- Next, click on the chart to select it
- After that, click on the "More options" button in the toolbar that appears
- Next locate the "Value labels" option in the right-hand panel
- Then, toggle on the switch next to "Value labels"
- Finally, customize the value labels font as needed
Why should you show value labels on a chart on Pitch
Pitch revolutionizes presentation creation by enabling seamless collaboration and dynamic design.
One standout feature is showing value labels on charts, elevating your data visualization to new heights. By displaying these labels, you provide clear, immediate insights that enhance audience understanding.
The ability to see precise data points at a glance helps maintain engagement and supports informed decision-making, making your presentations more impactful and memorable.
Last update