How to show clicked email metrics in Mixmax Reports
Here is how to show clicked email metrics in mixmax reports
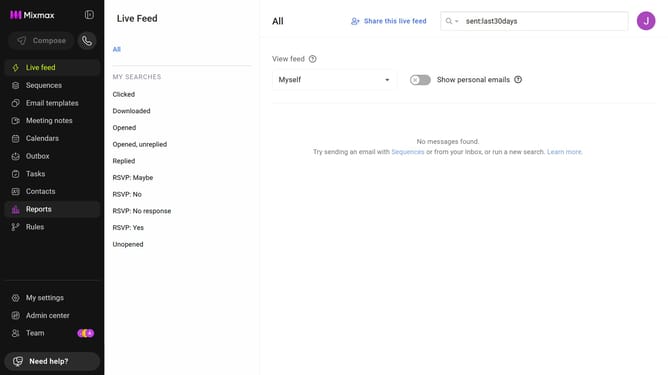
- First click on "Reports" in the sidebar menu
- Next, click on the "Dashboard" tab
- After that, scroll down to the "Email Analysis" chart
- Locate the "Clicked" checkbox below the chart
- Then check it to display clicked email data on the chart
Why should you show clicked email metrics in Mixmax Reports
Mixmax is a powerful email tool designed to enhance productivity and communication efficiency for professionals.
Understanding how to display clicked email metrics in Mixmax Reports is essential for gaining insights into your email campaigns' effectiveness. By leveraging this feature, users can see which links in their emails are being engaged with the most.
Seeing clicked email metrics allows for more informed decision-making, helping tailor future correspondence to enhance engagement and achieve better results.
This feature benefits anyone seeking to optimize email strategies, drive better interactions, and maximize outreach successes.
Last update