How to change the meeting trend activity chart view in Mixmax Reports
Here is how to change the meeting trend activity chart view in mixmax reports
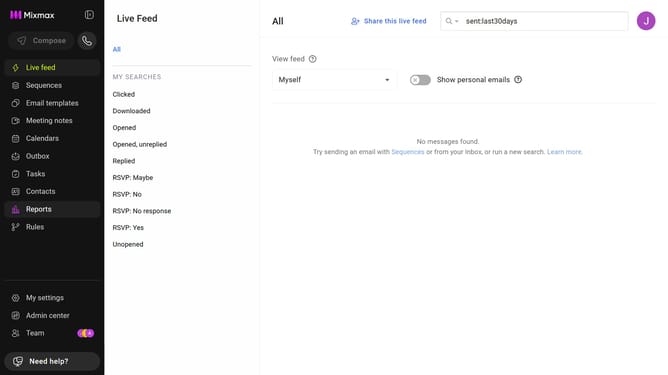
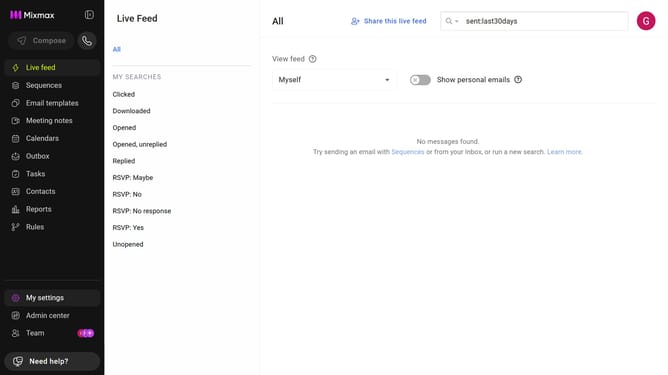
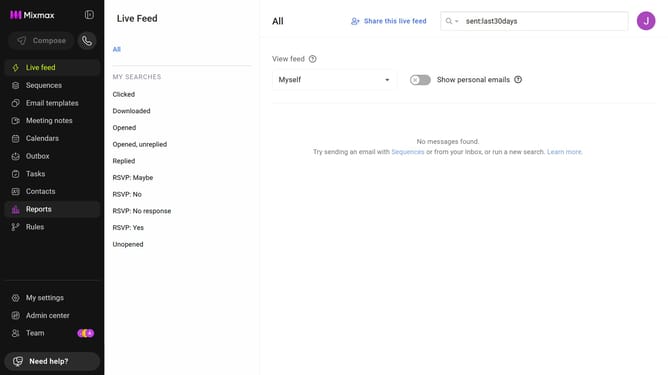
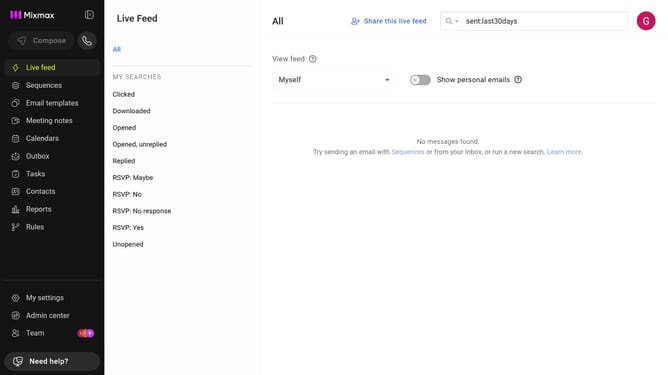
- First click on "Reports" in the sidebar menu
- Next, click on the "Dashboard" tab
- After that, scroll down to the "Meeting Trend Activity" chart
- Then, select either a Line Chart or a Bar Chart using the chart view option above the chart
- The meeting trend activity chart will now display in the selected view
Why should you change the meeting trend activity chart view in Mixmax Reports
Mixmax is a powerful tool designed to enhance productivity and streamline your communication efforts.
One of its standout features is the ability to change the meeting trend activity chart view in Mixmax Reports. This feature allows you to customize how your meeting data is displayed, making it easier to interpret patterns and trends.
By adjusting the chart view, you can quickly identify shifts in meeting activity, enabling better decision-making and optimizing team performance. This flexibility in data visualization ensures that you can glean the most relevant insights to enhance your workflow.
Last update