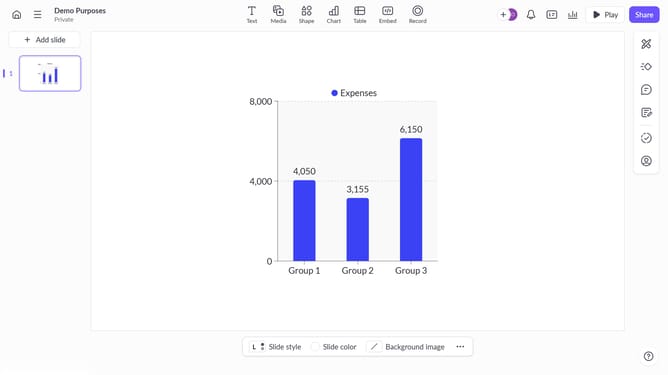
How to add a chart to a presentation on Pitch
Here is how to add a chart to a presentation on pitch
- First, open the presentation where you want to add a chart
- Select the slide where you want to insert the chart
- Next click on the "Chart" button in the toolbar
- Then, select the type of chart you want to add
- Finally, enter your chart data and customize the chart as needed
Why should you add a chart to a presentation on Pitch
Pitch is an innovative platform designed to transform your presentations into impactful visual stories.
Adding a chart to your presentation on Pitch is effortless and seamlessly integrates dynamic data visualization.
Charts enhance understanding by illustrating complex information clearly, allowing your audience to grasp insights quickly.
This feature not only augments the visual appeal of your presentation but also strengthens your message, keeping your audience engaged and informed.
Last update